


Aggregations and pivots are just two of the many ways you can transform data. In this blog, I'll be defining each one, providing examples, and covering how you can achieve them in Tableau Prep.
Aggregations
To start off, aggregation is the process of combining many rows of data into a high-level summary. It is useful because it reduces the size of our data, making it easier to process and allowing us to extract quick insights.
A real-world example of aggregation can be seen in the retail industry. Instead of looking at millions of individual transactions, a business would be more interested in seeing a condensed version of that data, such as total revenue by store and month.
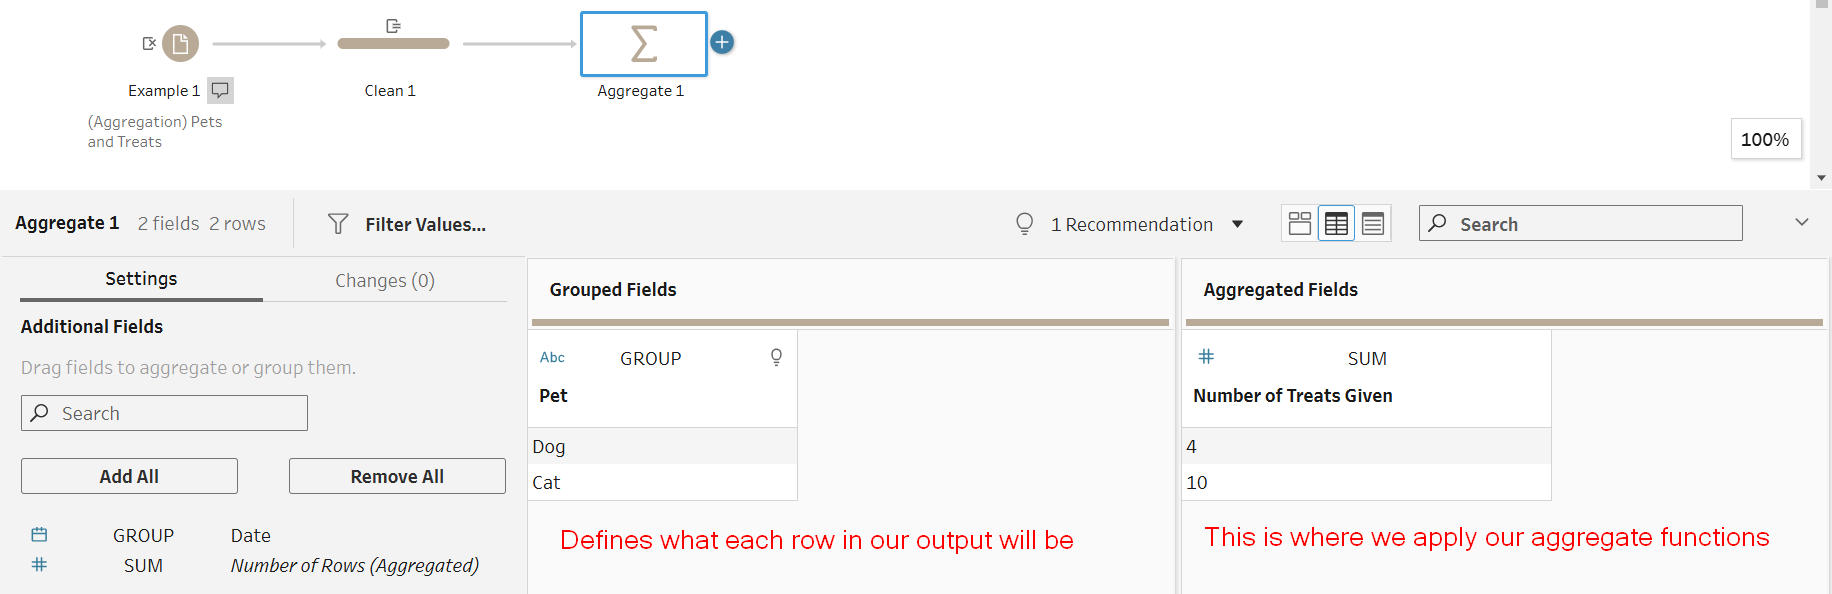
In Tableau Prep, aggregation requires two main components: the field(s) to group by, and the result field(s) with an aggregate function applied (e.g., SUM, MIN, MAX, COUNT). The field(s) you group by tell you what each row will represent in your result.
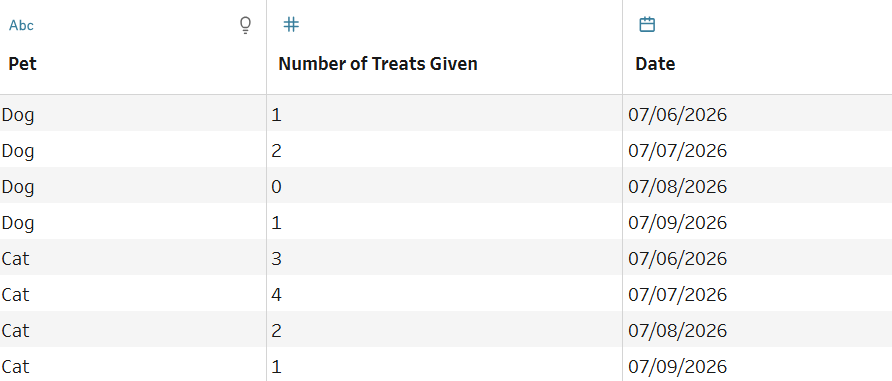
Let's see an example in Prep! Here, I have a simple table with pets and the amount of treats they were given on specific dates:
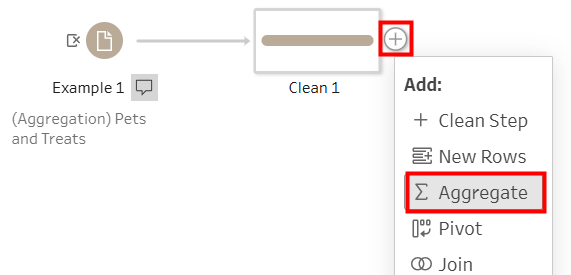
To aggregate, we need to add a new step and click the third option on the dropdown:
Following that, you'll see a window pop up with two panes: Grouped Fields and Aggregated Fields. This is where you would drag in the appropriate fields, as explained earlier:
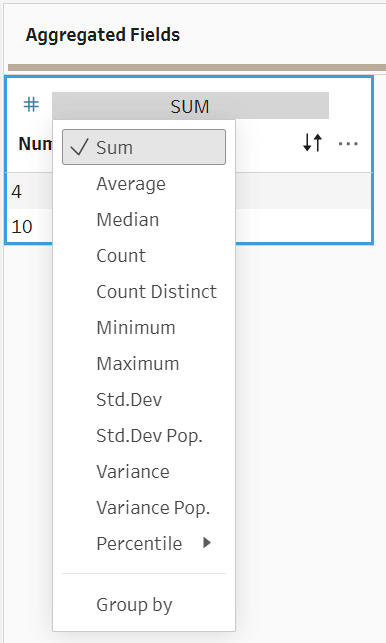
If you want to change the aggregate function, simply click on the default SUM to open the dropdown of all the functions available. This list will look different depending on the datatype of your current field.
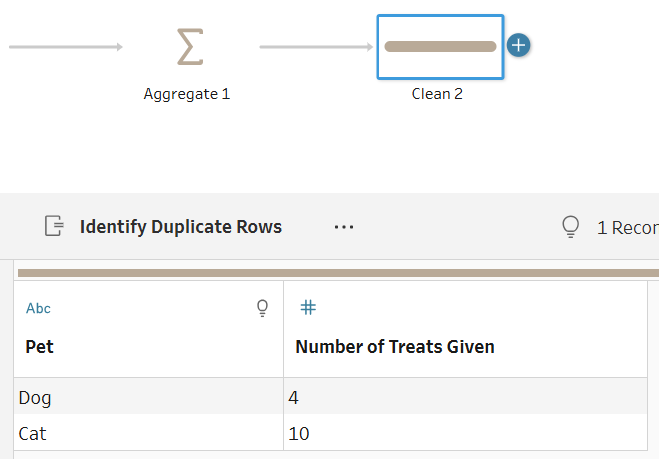
Now if you add a new Clean step afterwards, you should be able to see your aggregated table.
Pivots
Pivoting is the process of reshaping your data. In Tableau Prep, you can do this from either columns to rows or rows to columns.
We mainly pivot to make data ingestible by business intelligence tools like Tableau, which generally read data vertically (in columns). This means that each field should represent one concept, in terms of both data type and meaning.
What does this mean, exactly? Let's look at an example:
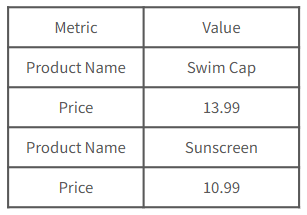
If we put this table into Tableau, we would not be able to plot or aggregate the price of each product because each field is representing multiple concepts. This is the most apparent with Value, since the data types are logically different (string vs float) and have different meanings. As it is now, if we plotted Value in Tableau, each row would be treated as a separate category.
This is where pivoting comes in! To make this data ingestible by Tableau, we need to restructure our data so that each field represents a singular concept:
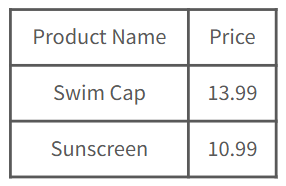
Now we'll be able to plot and aggregate our fields. Given this example, another way to think about this is: right now, can I aggregate my data in the way I want? If the answer is no, consider pivoting.
In the real world, pivoting has many such use cases, and one common one is for financial data, which is often split into columns based on time periods:
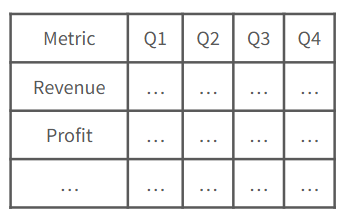
If I wanted to find the average revenue across all quarters, I would want to flip the rows and columns so that revenue gets its own column, which Tableau could then aggregate. Since we can't aggregate the data as it is now, we need to pivot!
Pivoting Columns to Rows
As mentioned earlier, there are two ways to pivot in Tableau Prep. The first is columns to rows, in which your dataset becomes longer. Here's a visual example to help guide your understanding:
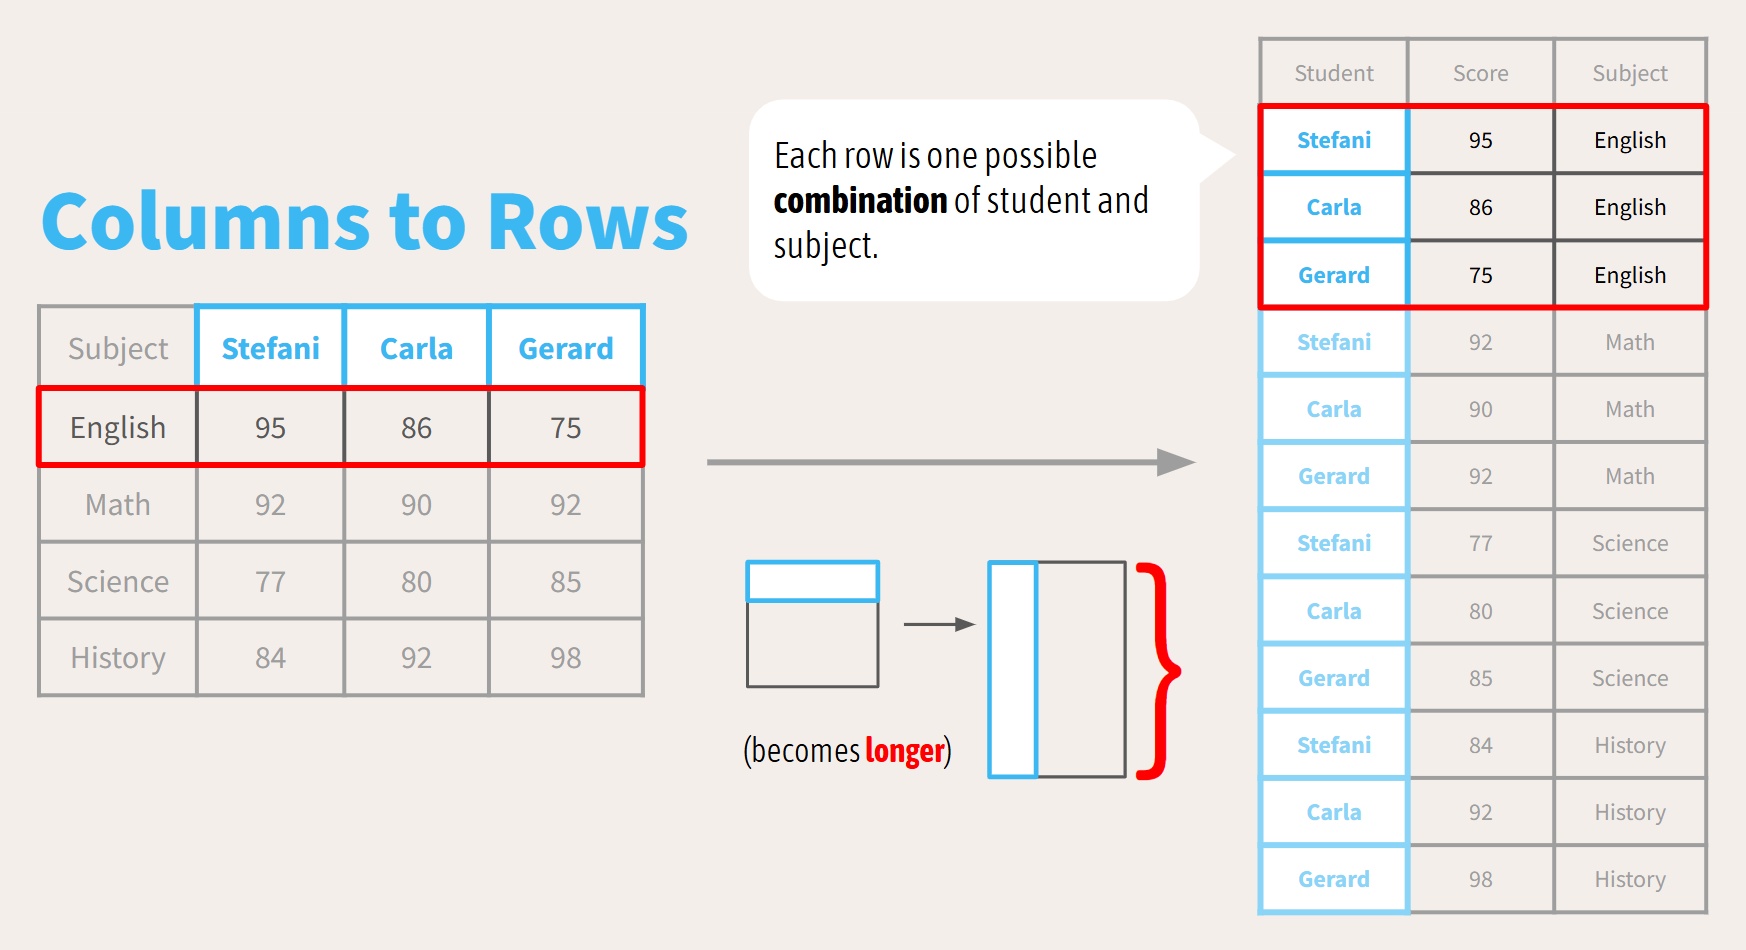
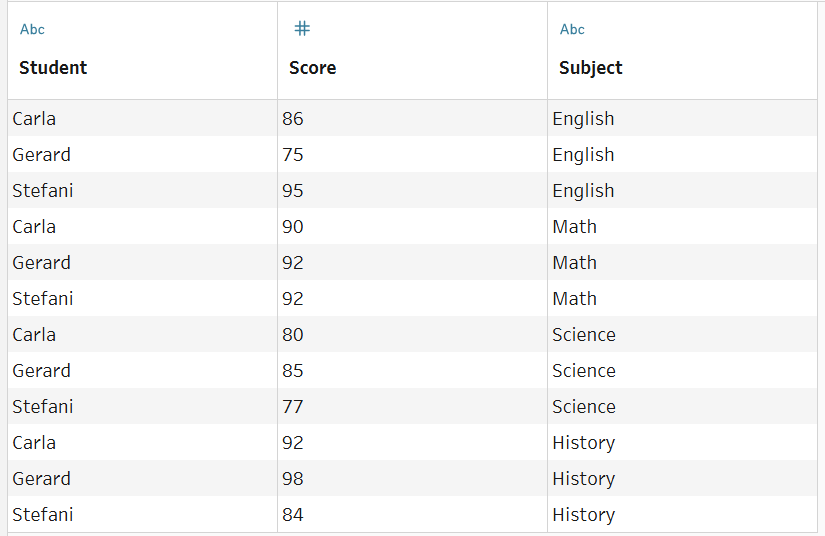
In this example, the columns to pivot are the student names (Stefani, Carla, and Gerard) in the left table. These are converted to rows in the right table, where each row is a combination of student and subject. The end result has singular columns for student, score, and subject.
Now let's put this into Tableau Prep!
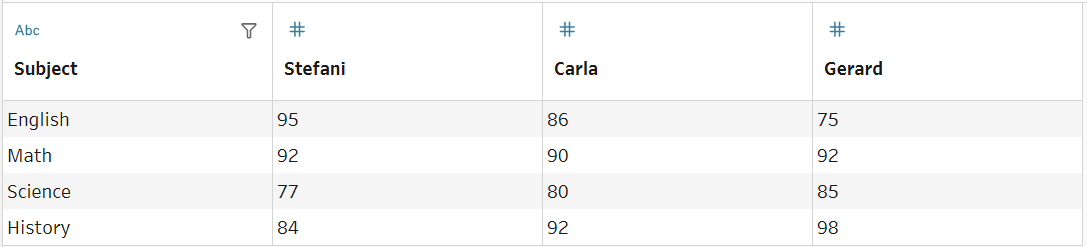
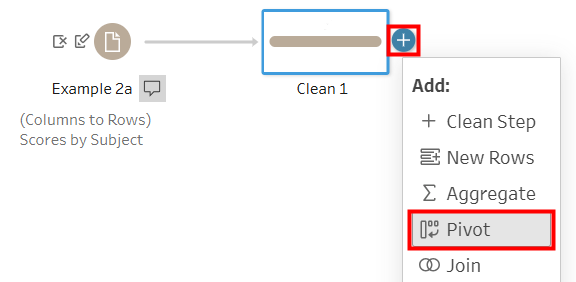
After importing your dataset, add a pivot step like so:
The following window should pop up:
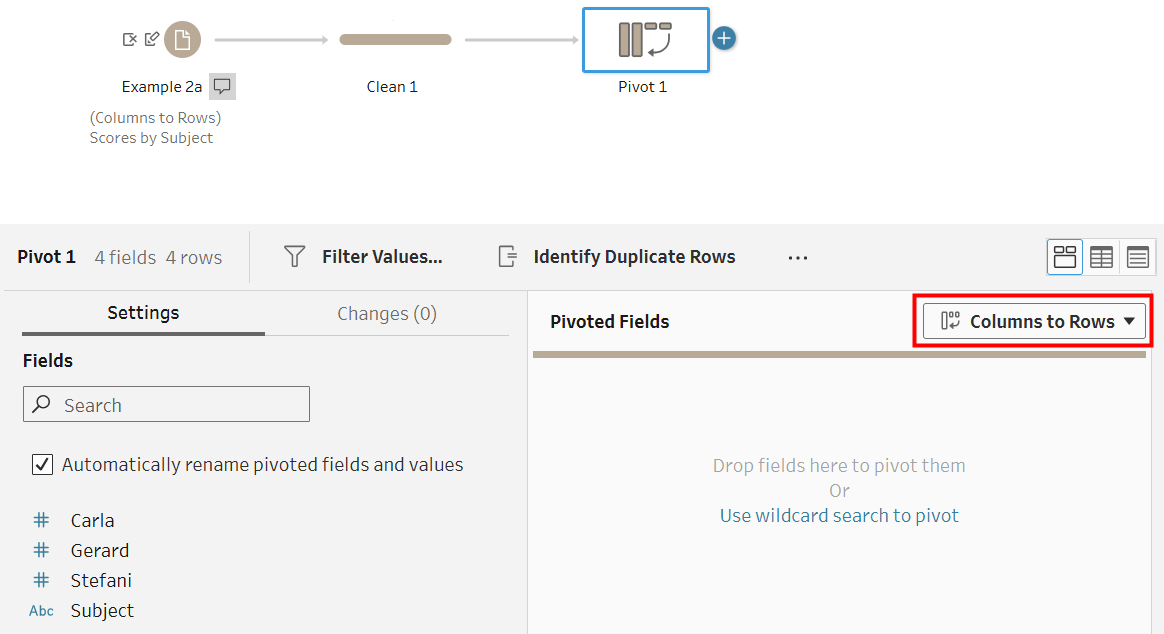
This is where you decide which fields you want to pivot. As you can see, the tool is set to columns to rows by default, and this case we do want that, so drag in the fields you want to turn into rows. You can hold Shift to drag in multiple fields at a time:
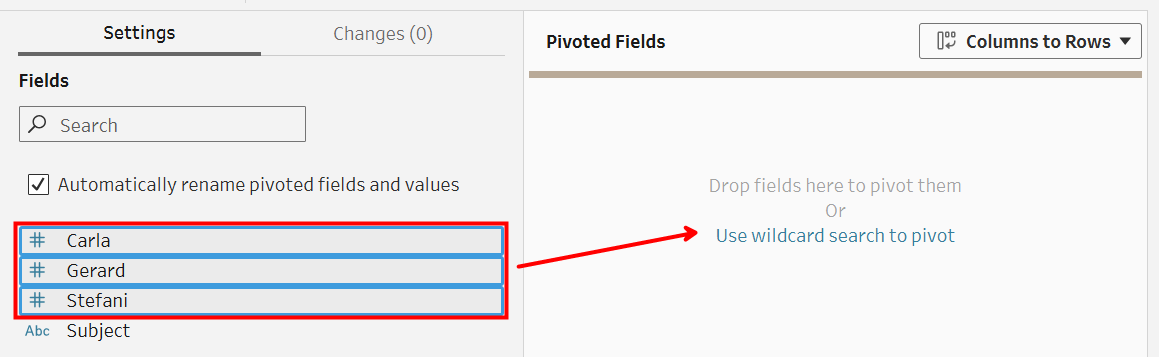
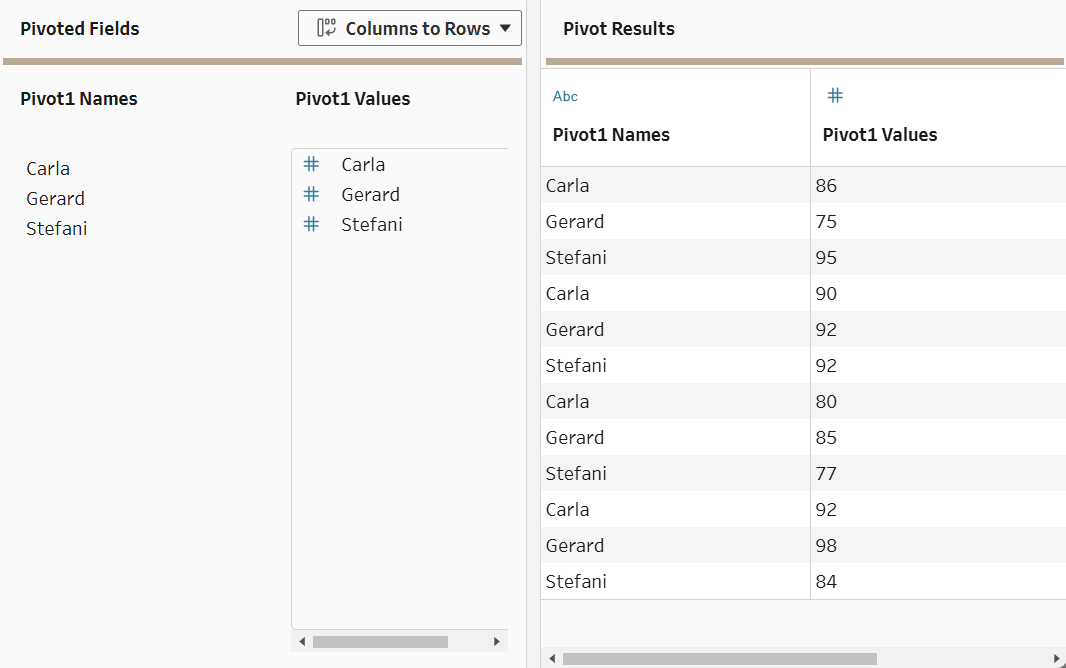
Now all we have to do is rename the columns. We can do that in the same step by double-clicking on the column names. This leaves us with the following table:
Pivoting Rows to Columns
The other way to pivot is from rows to columns, which makes the data shorter. Consider the following visual example:
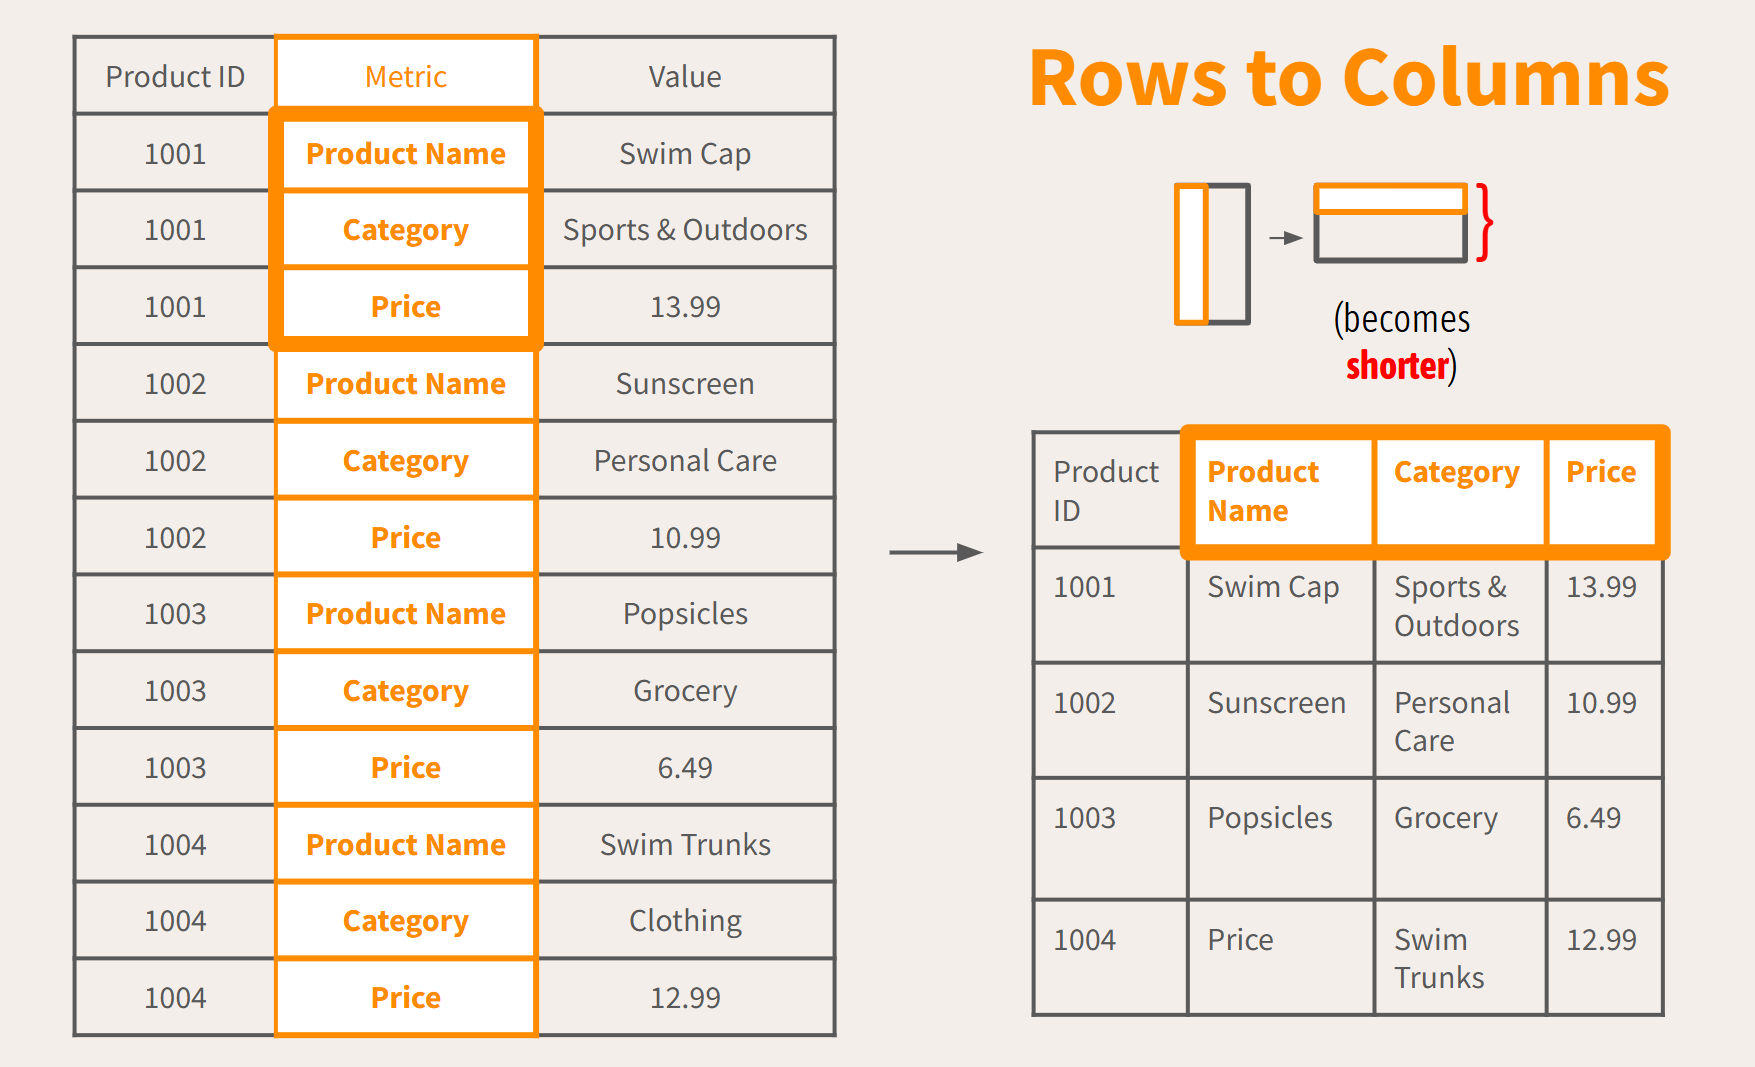
For this method, we first choose a field whose values we want to turn into column headers—in our case, that would be Metric. Then, we choose a second field whose values "answer" those column headers, which would be Value. Tableau Prep requires that this second field be aggregated.
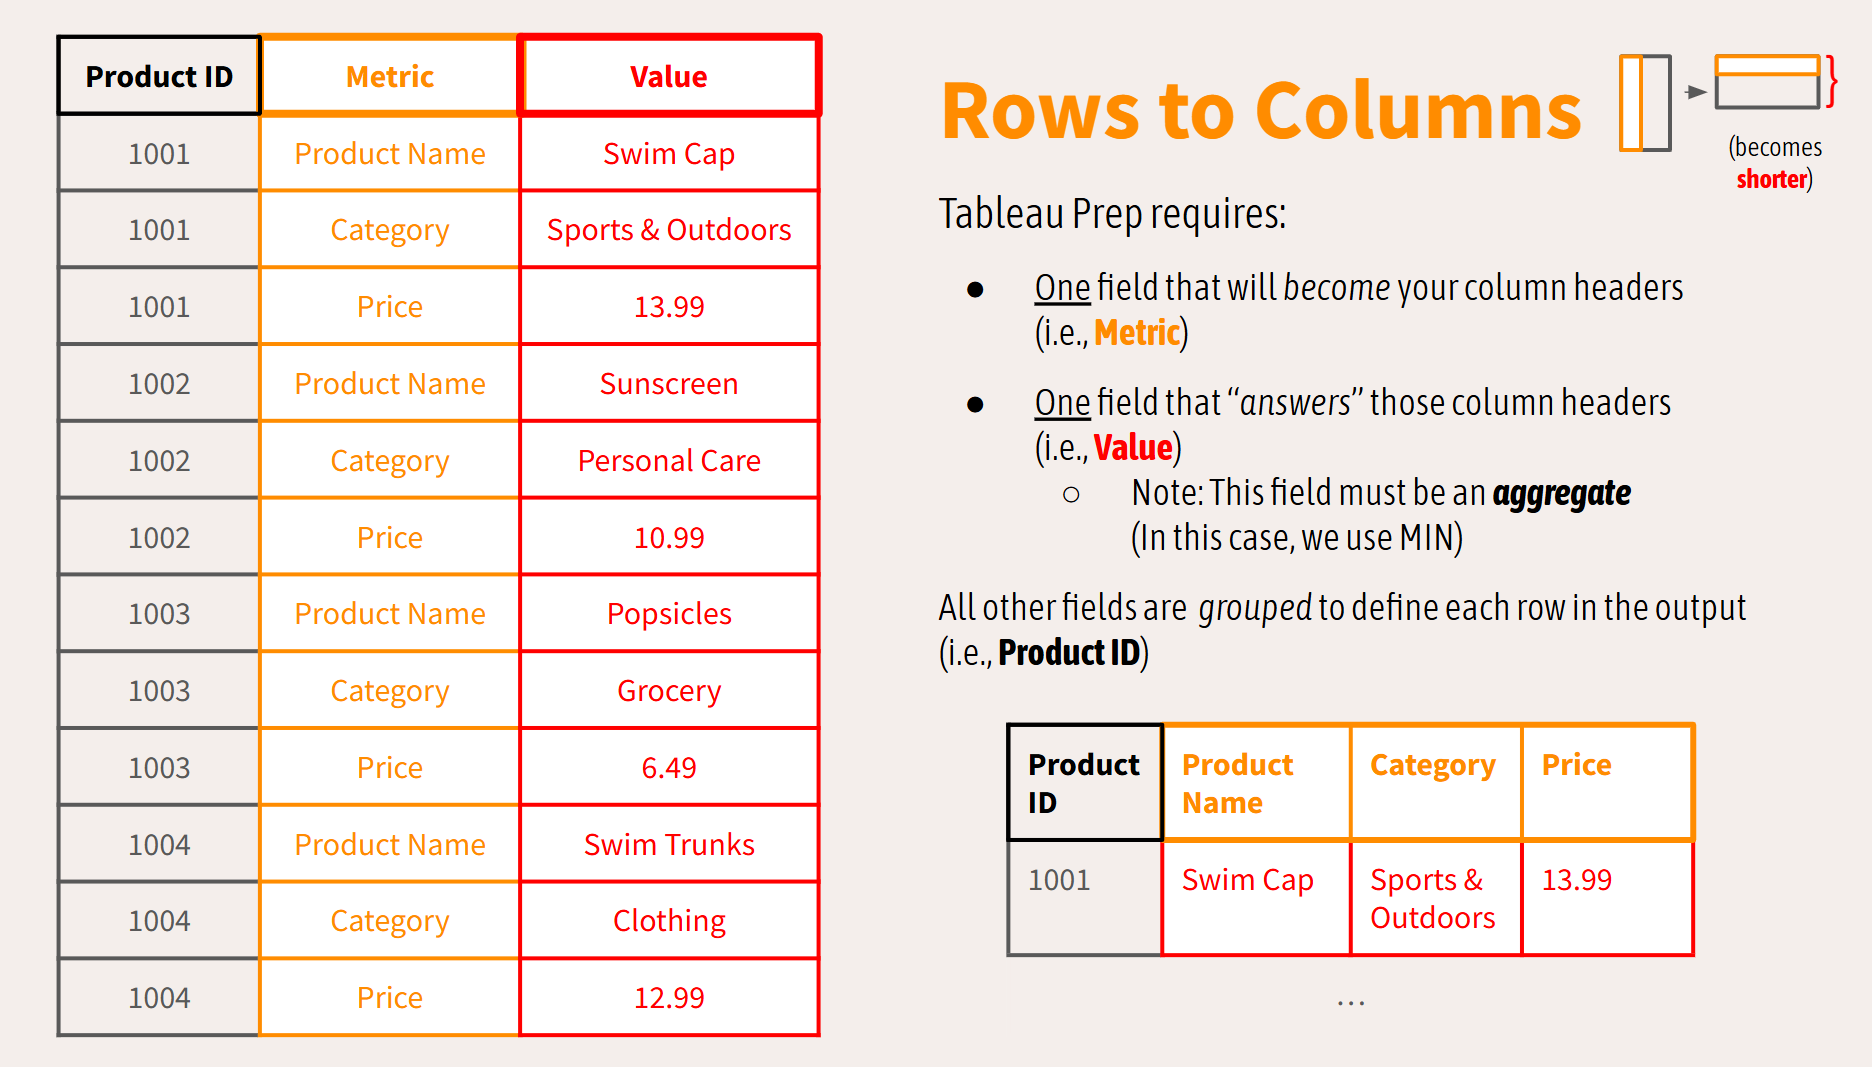
One caveat to note is that Tableau Prep silently groups all other fields to define each row in the output. In this case, each row represents a unique value in Product ID. If you have multiple leftover fields, be sure to double-check how they're being grouped.
Let's do this in Tableau Prep!
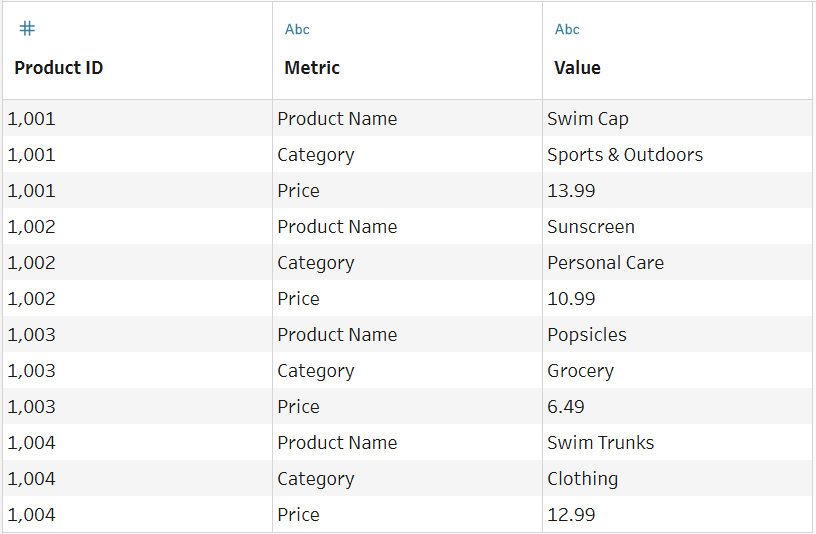
Once again, let's add a pivot step, but this time with rows to columns. You'll notice that our window changes. This is the way I like to think about it:
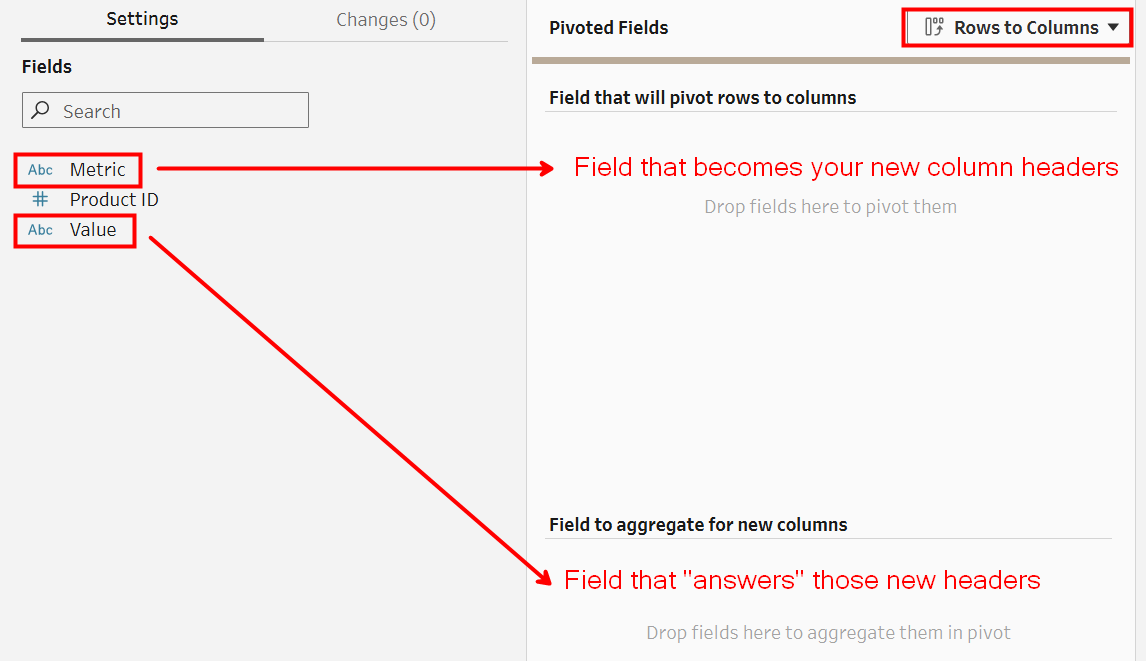
After dragging those fields in, your pane should look something like this:
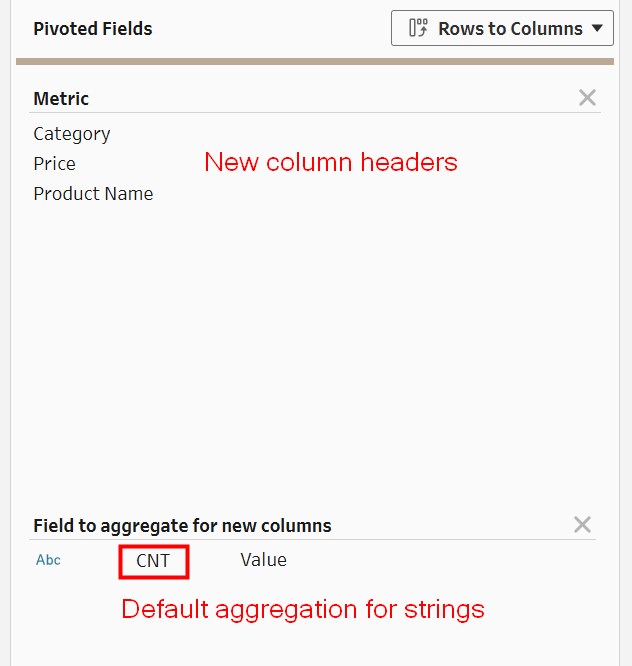
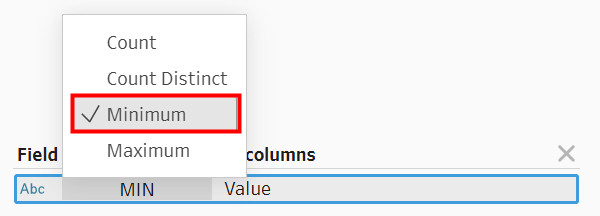
By default, Tableau Prep will apply COUNT when you try to aggregate a string, but this returns a number, i.e., how many combinations of that Metric and Value pair exist in the original table (which in our case, will always be 1). Since we want the actual strings themselves (e.g., 'Swim Cap', 'Sports & Outdoors', '13.99' ), we want to change this to MIN, since that grabs the first string for that Metric/Value pair alphabetically:
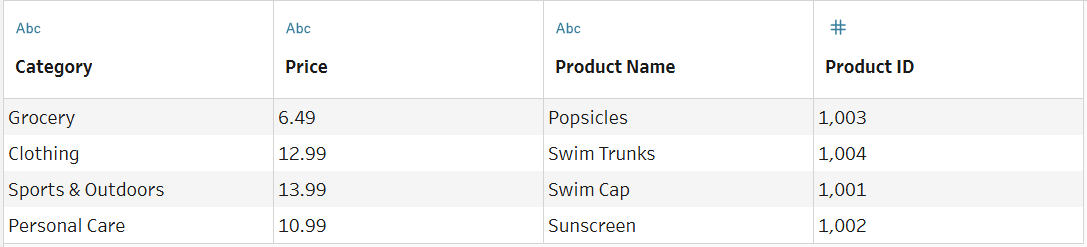
Now we have a table that's much easier to analyze:
Conclusion
To sum up, aggregation condenses data while pivoting changes its structure.
In Tableau Prep, aggregation requires:
- Fields to group by
- Result fields with an aggregate function applied
Meanwhile, there are two types of pivoting, and they each require different things.
Columns to rows requires:
- The fields that you want to turn into rows
... while rows to columns requires:
- A field that will become your new column headers
- A field that "answers" those new headers
Overall, both techniques make it easier for us to analyze our data and translate into powerful real-world use cases.