Today we need to solely use Power BI and scrap the basketball statistics from https://www.basketball-reference.com.
We need to extract the data from each year. This is definitely not a easy task to do, because we didn't found any wildcard functionality that available for us to just plug in the URL and do all the stuff. Personally, I firstly created a csv file with all the links within. Then I converted the table as a list and used it to create a parameter, which was used to get the data via web data source. One thing worth to mention is that up to this point there is only one table from one webpage (which is the link setting as default value of parameter). To get all the table from each webpage, I needed to 'create function' and let it loop through all the parameters to get all the table.
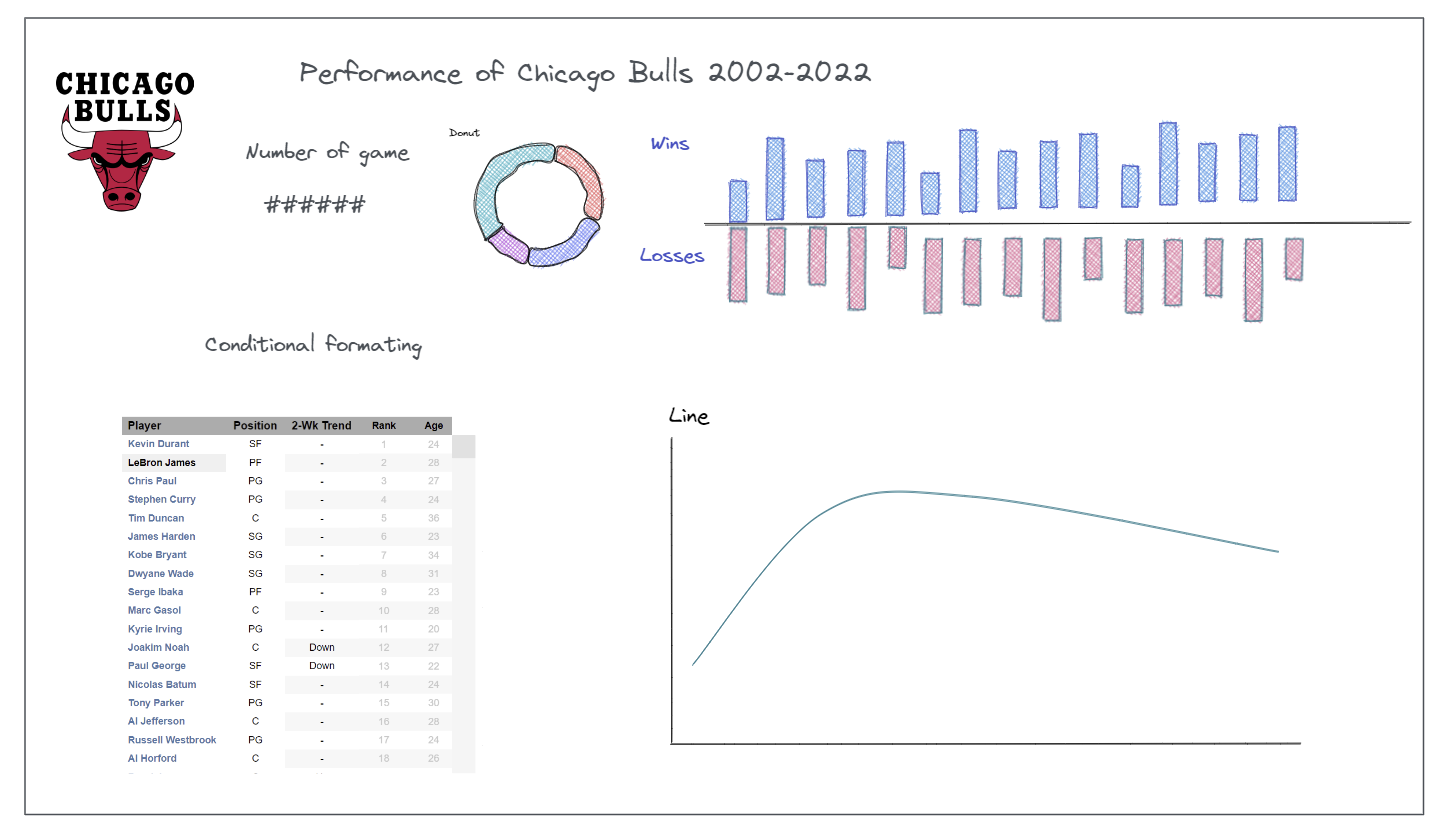
I am not a sportsperson, nor do I enjoy watching sports. I have no idea on what all those statistics mean. Therefore, I spent a long time to understand the data and took a relatively safe path just visualizing the overall point gaining of a team through the last 20 years, due to limitation of time. This is my original plan:

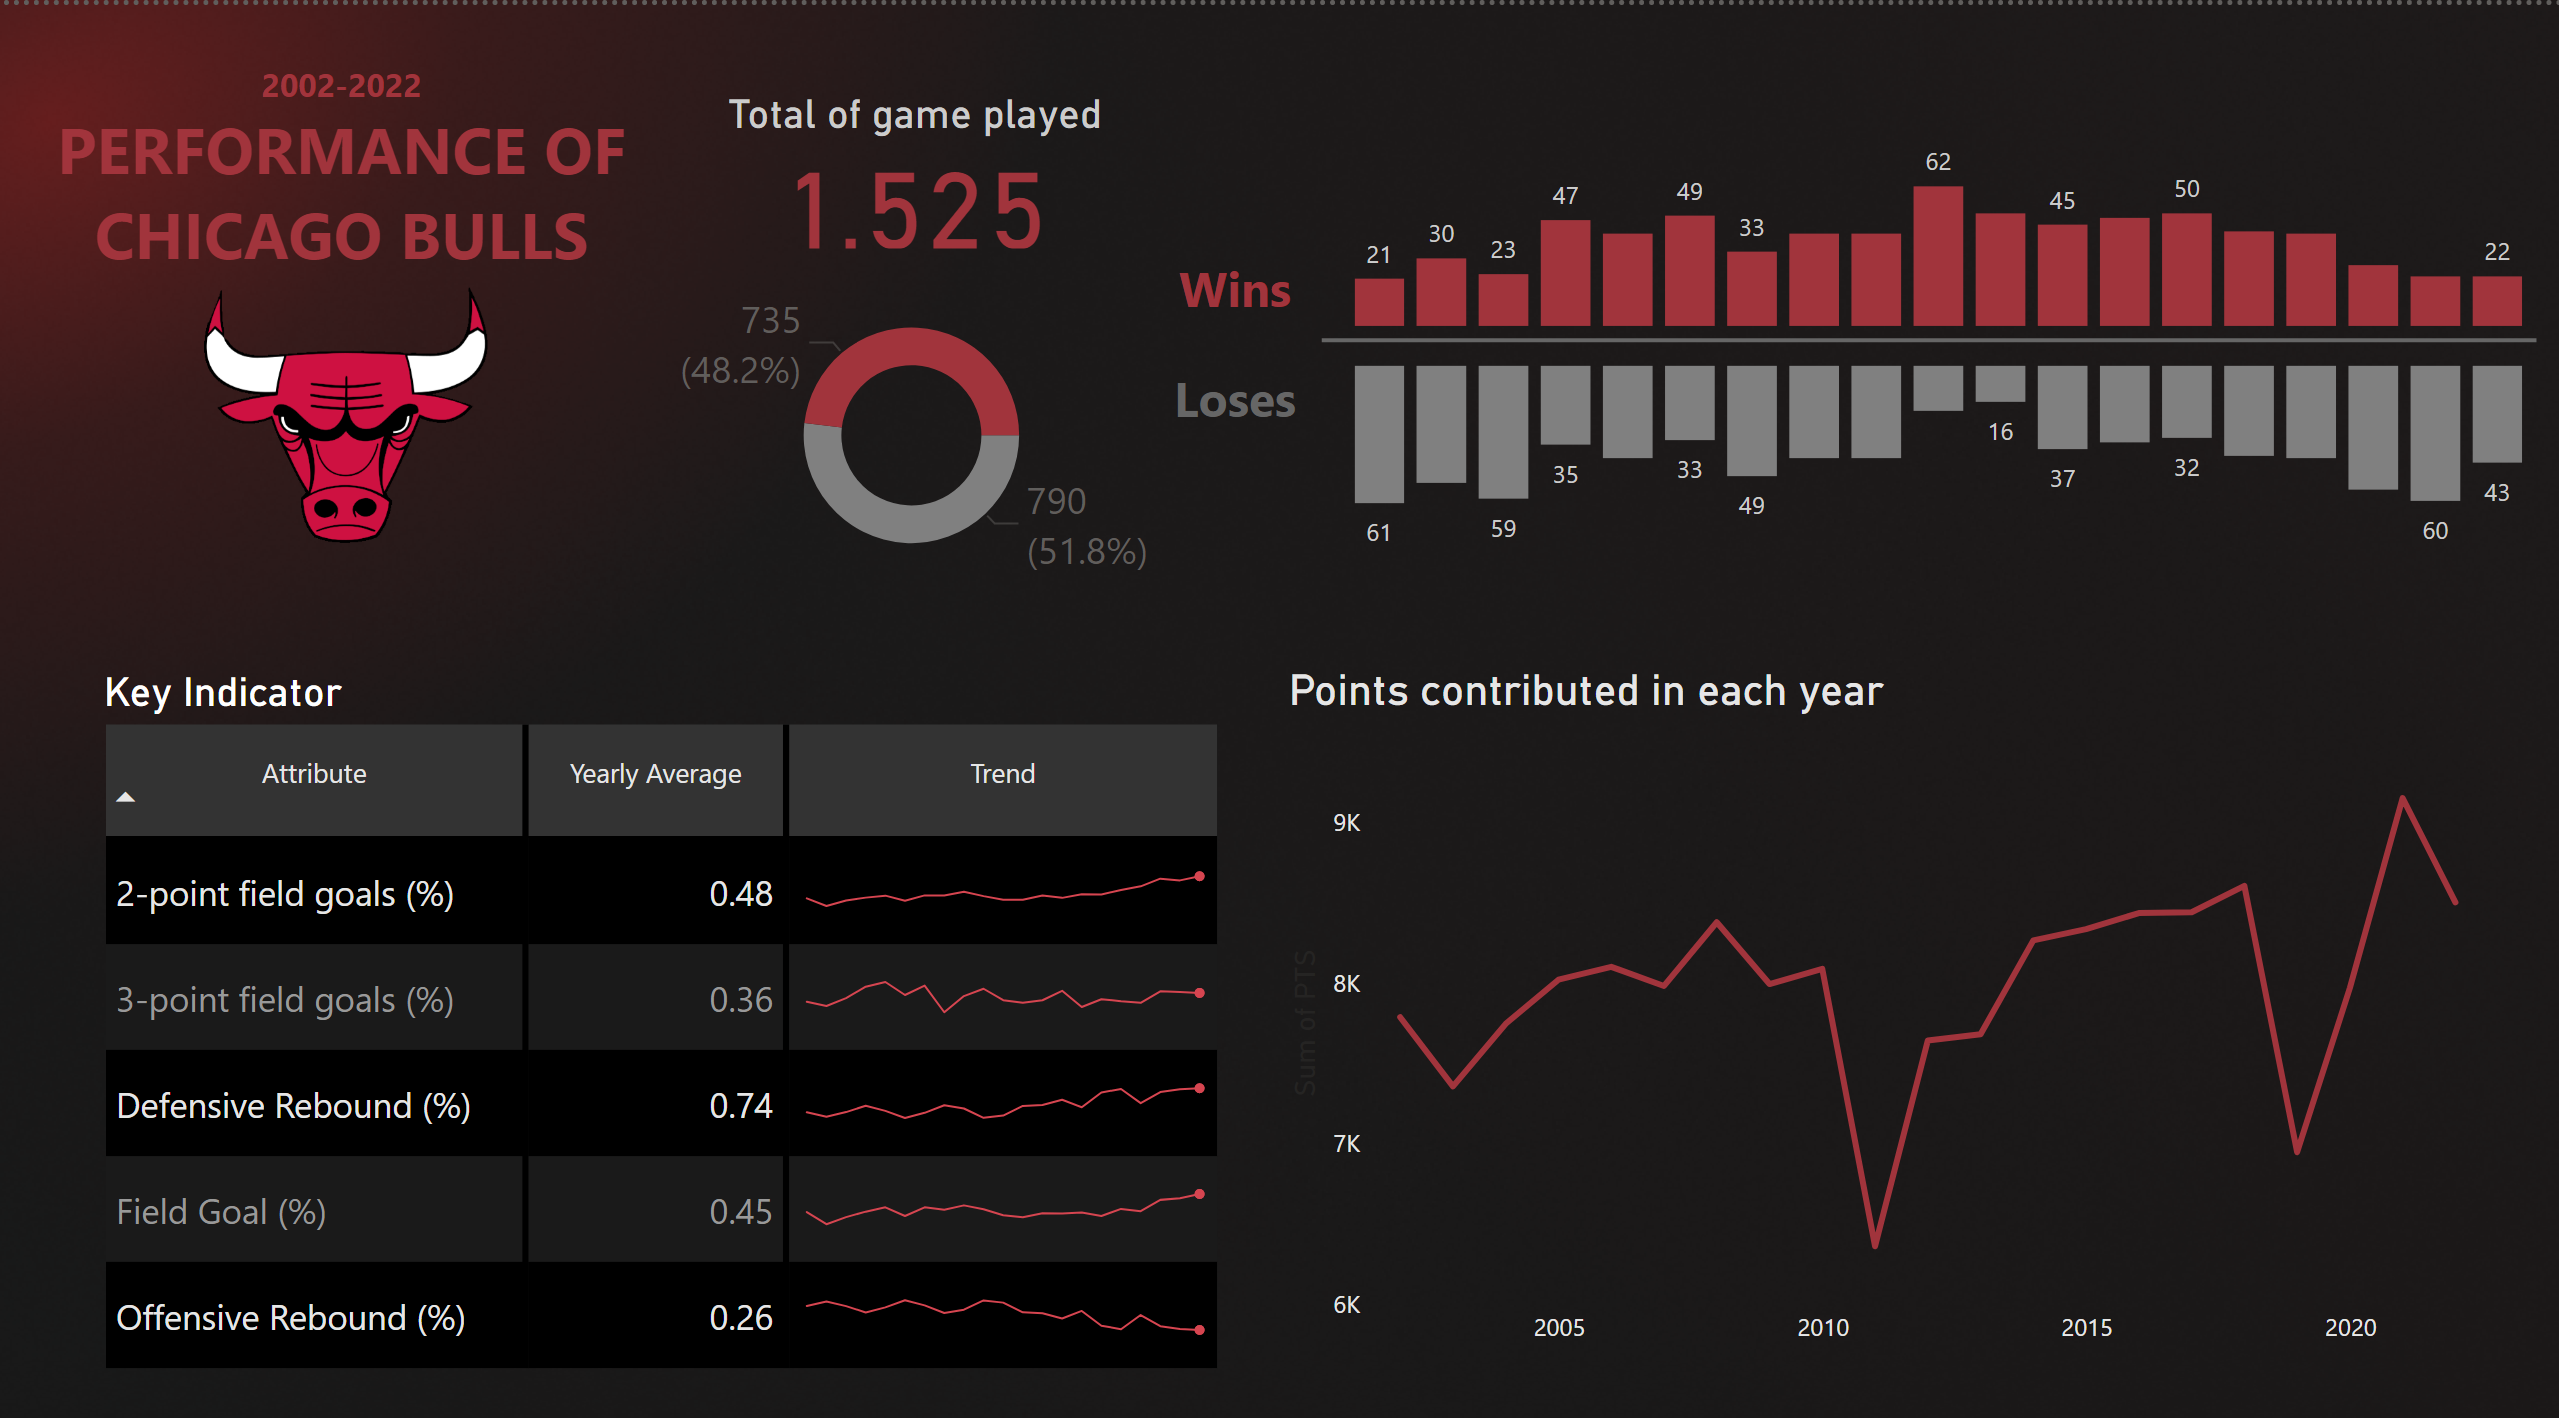
And this is my final dashboard.

I think overall it is fun to deal with somethings that I don't know. Today is a good day to train up my skills, mainly not the effective visualization, but the time management, working under stress and handle the uncertainty.
