This blog is about changing table orientation (or say rotating the table), which I just learn in doing the Alteryx weekly challenge. In excel, we can copy the range of the table and then right-click and select paste with 'transpose'.

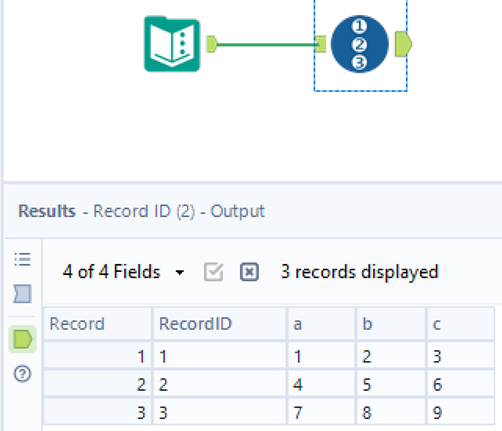
In Alteryx, there is no single tool to do this task. We need to rely on two pivot tools in Alteryx - Transpose and Crosstab. The transpose tool in Alteryx has a different meaning from the transpose in excel; it refers to bringing multiple columns into a single column with another column which is the header. But first, we need to add a row identifier (will explain the usage below).

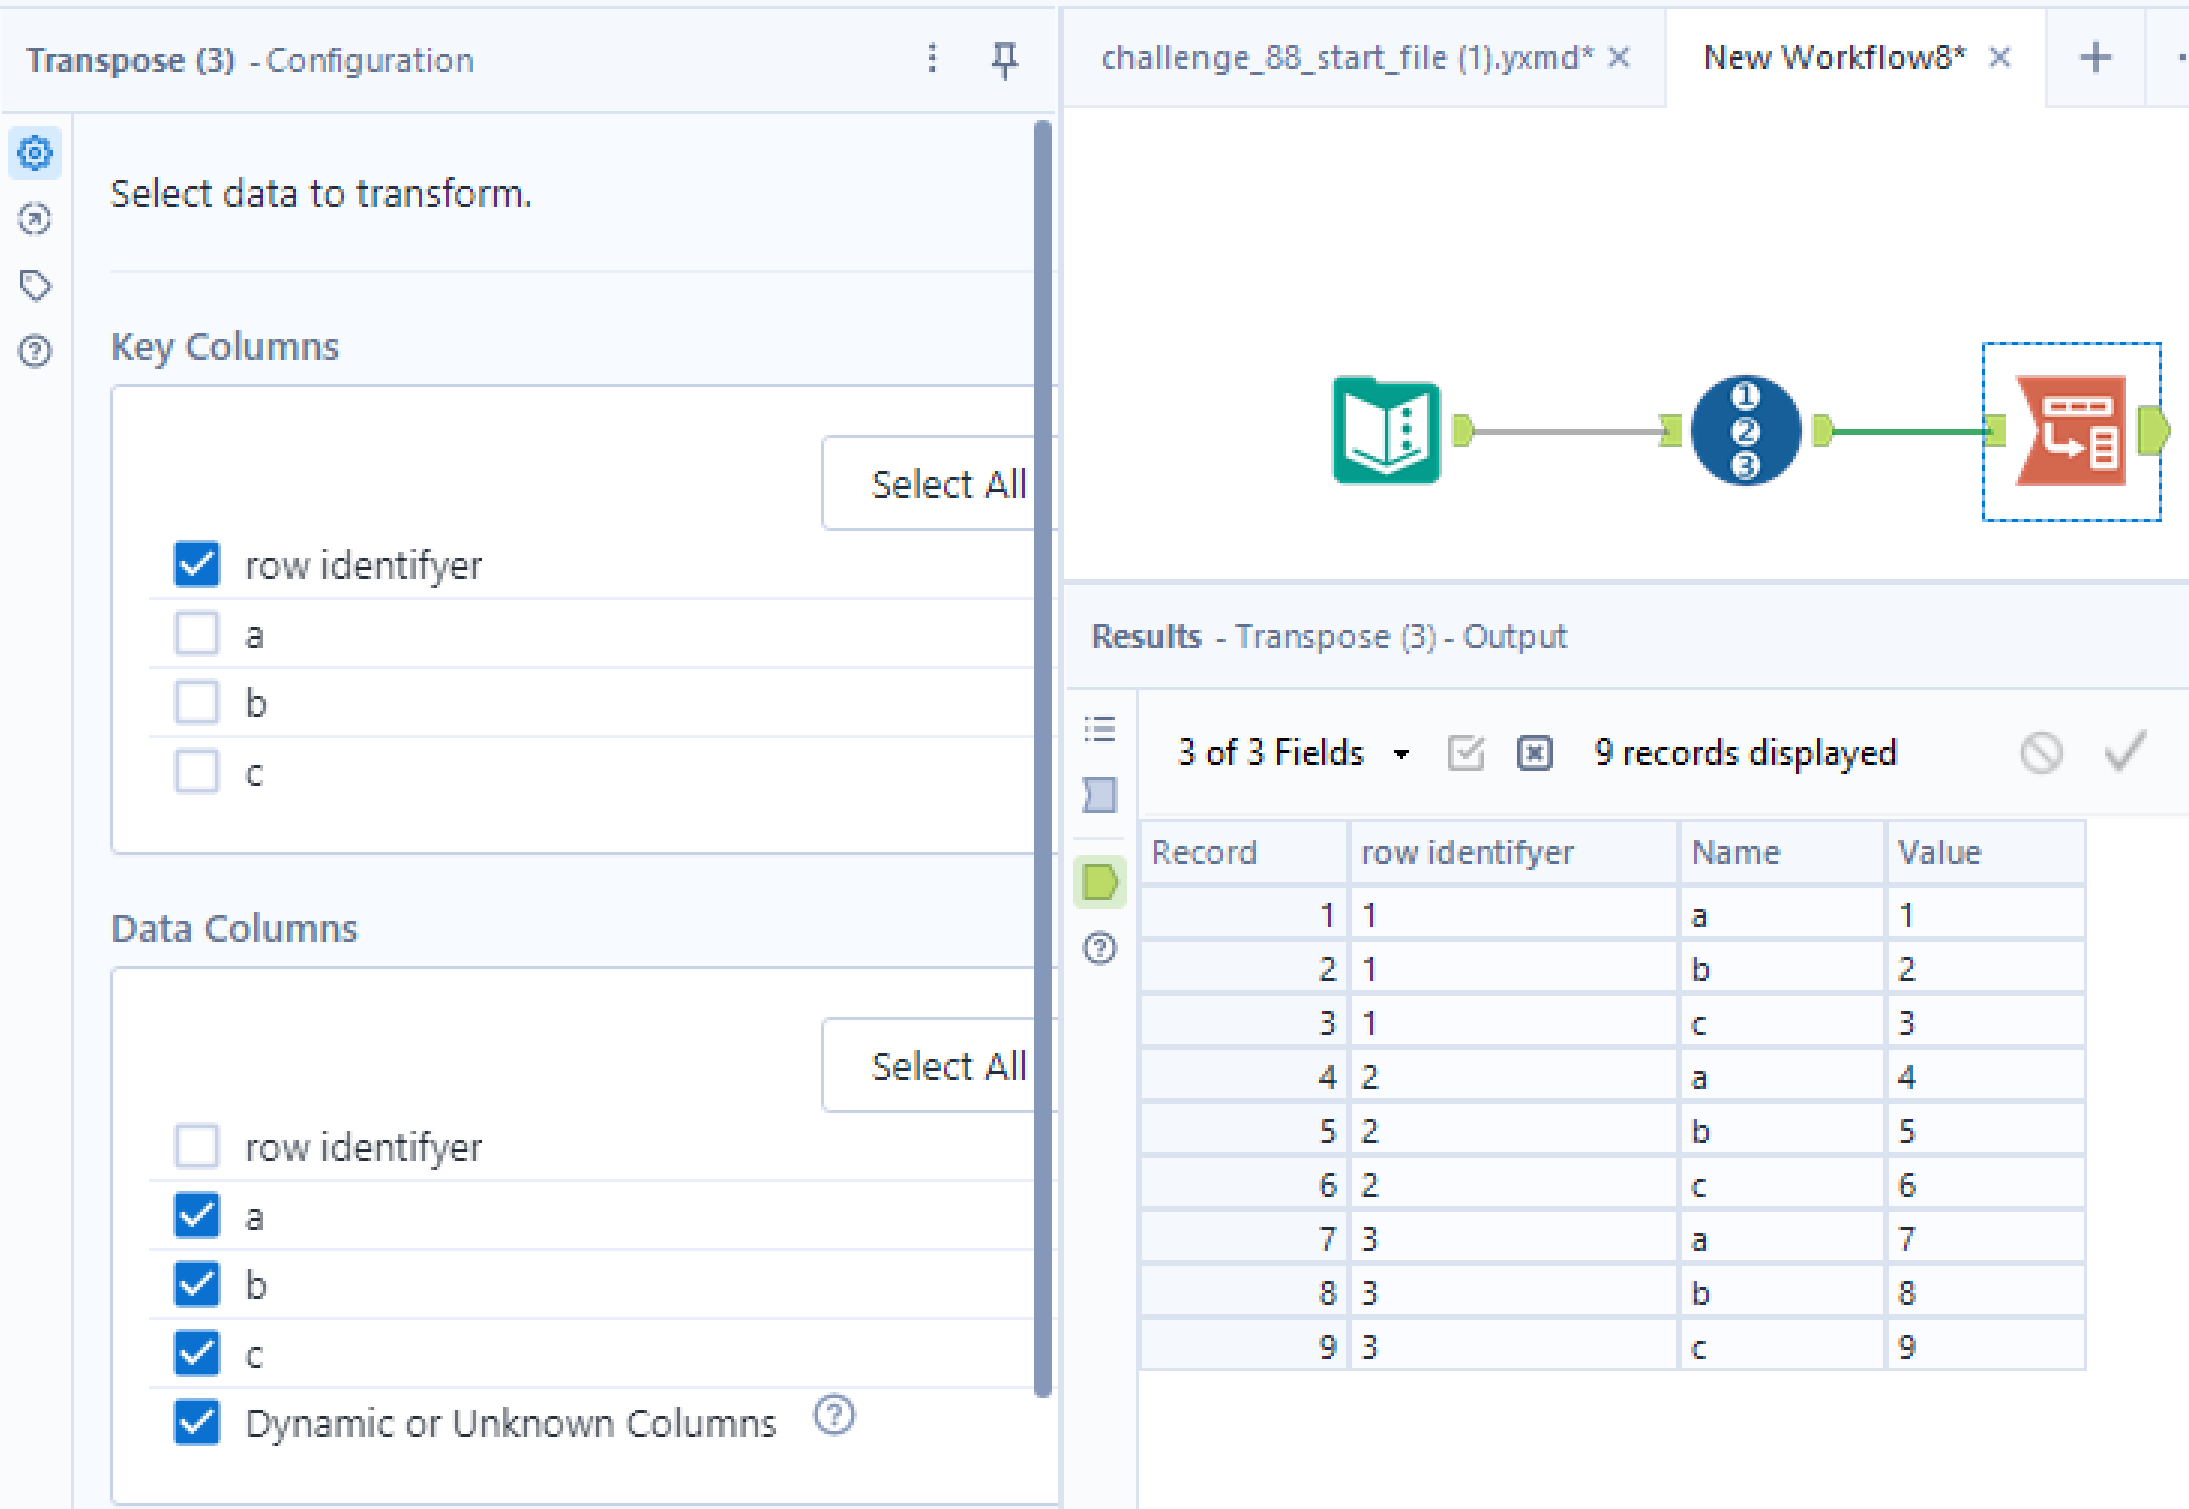
Next, we apply the transpose tool. Set 'row identifier' as the 'key columns' and other columns as 'data columns' of which the orientation needs to be changed. So you can see that the new column 'value' contains all the values in the original table' and 'name' contains the header corresponding to the value.

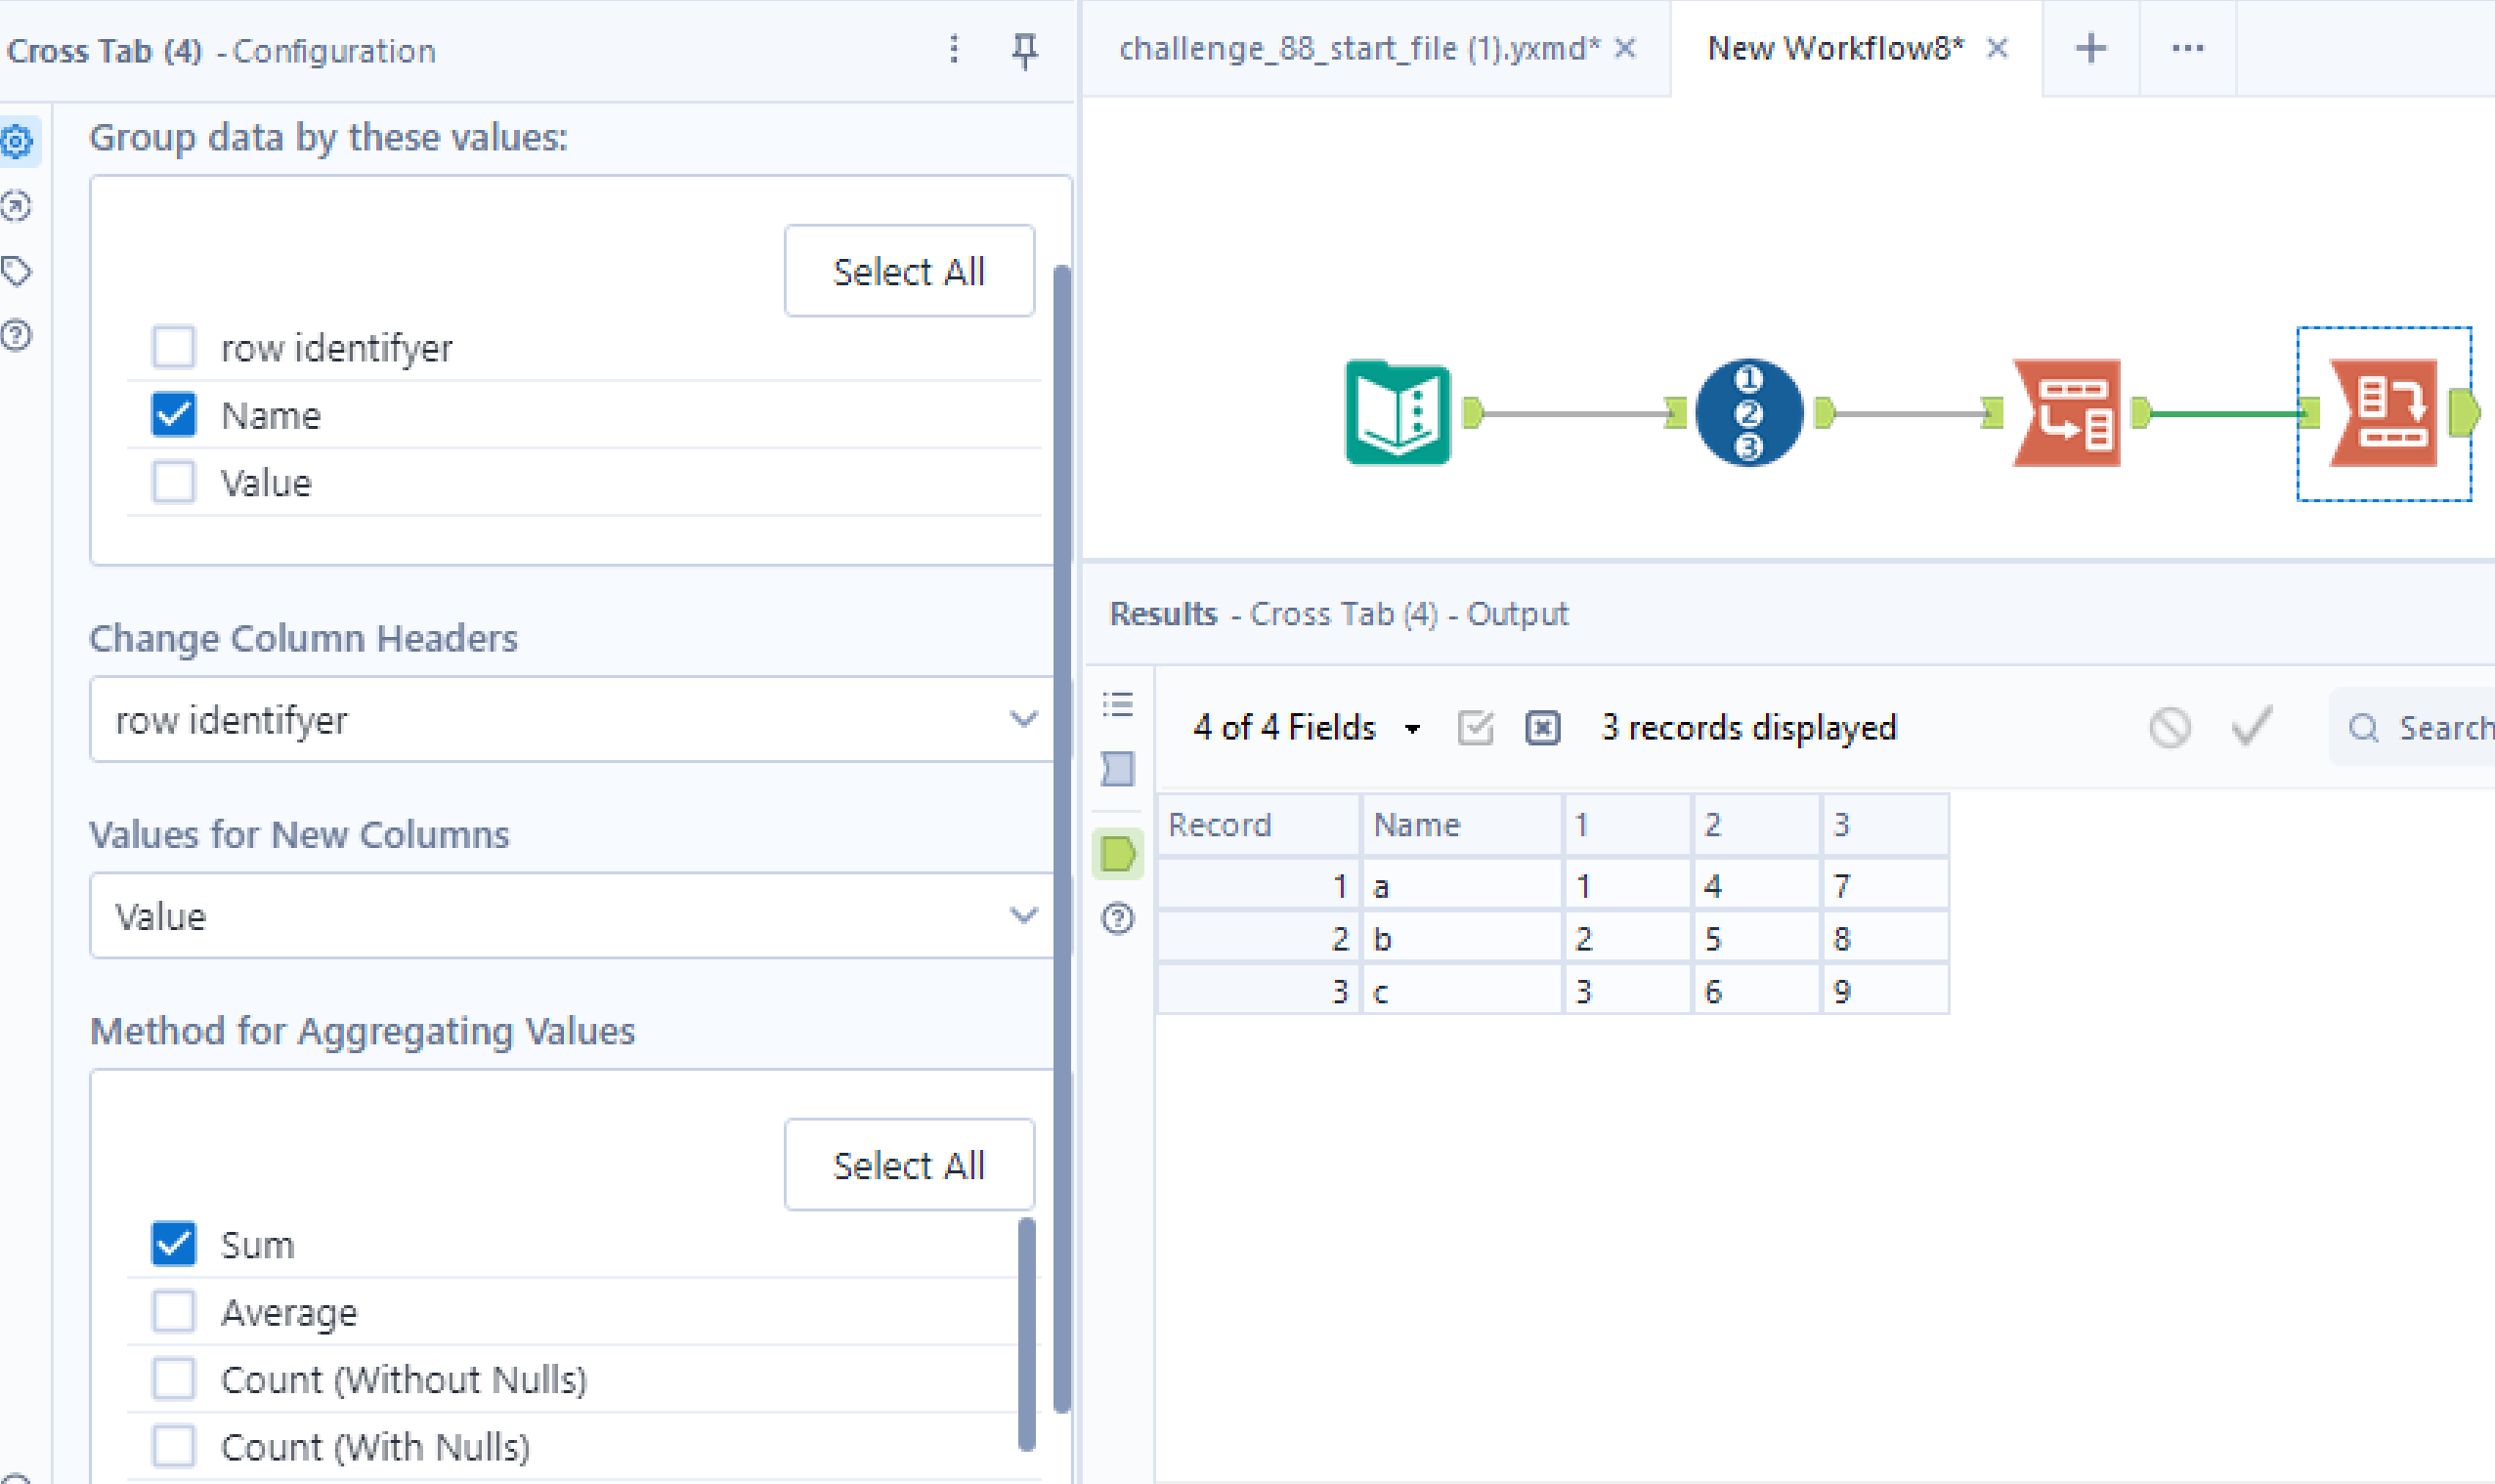
The next is using the crosstab tool, which brings the single columns into multiple columns, of which their headers are the string corresponding to the values. That's why we need to add a 'row identifier' beforehand. Because we want to change the 'row identifier' into new headers!
Apply the crosstab tool. Set the 'Group data by these values' as 'name' (old headers become new rows identifiers); set 'change column headers' as 'row identifier' (old rows identifiers become new headers); 'values for new columns' is just the value you want to reshape; and 'method for aggregating values' doesn't matter because we didn't collapse multiple rows, we simply reshape the data. Just choosing 'sum' is good to go. Run the workflow and you will see the difference.

In this blog, I talked about how to change the table orientation in Alteryx. I tried to clearly explain what and why we use crosstab and transpose along with their proper configuration. If you understand the principle, you can do it in less than 30s!
