What are Table calculations?
Table calculations are essentially secondary aggregations applied exclusively to the data returned in the view. They can be identified with the symbol (Δ). Whilst both table calculations and calculated field allow for a manipulation of data, the difference between table calculations and calculated fields are down to how and where they occur.
To understand where they occur, you have to first look at Tableau’s query process.
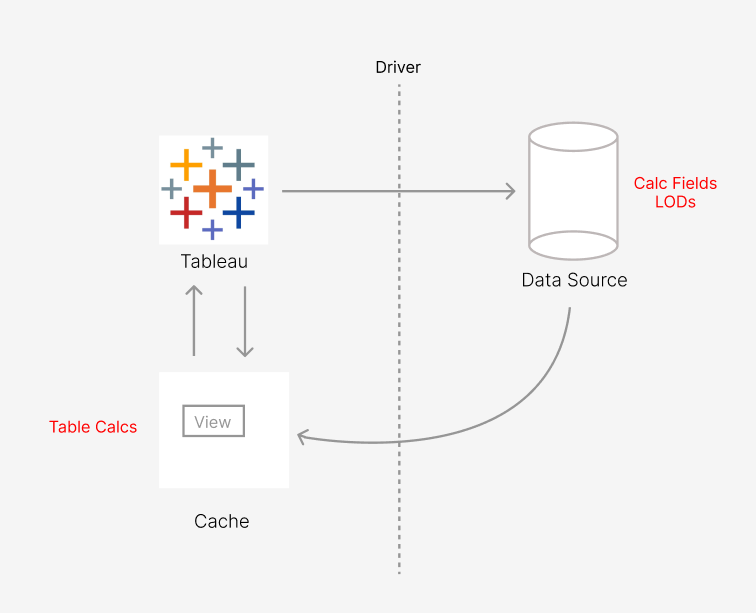
Calculated fields compute at the row or primary aggregate level within your data source itself. Therefore, Tableau itself does not have to compute them.
Table calculations however happen locally using what’s known as the cache. This is a summarised subset of your data that the data source has sent to Tableau and is stored locally. This also means that the processing of table calculations relies on the performance of the user’s machine. Therefore, you must consider your computer’s RAM and CPU when considering whether to use a table calculation or an alternative.
Types of Table Calculations
Quick table Calculations
- When selecting your continuous variable, you can click to apply a quick table calculation. These include:
Difference From, % Difference From, Percent From, Percent of Total, Rank, Percentile, Running Total, Moving Calculation
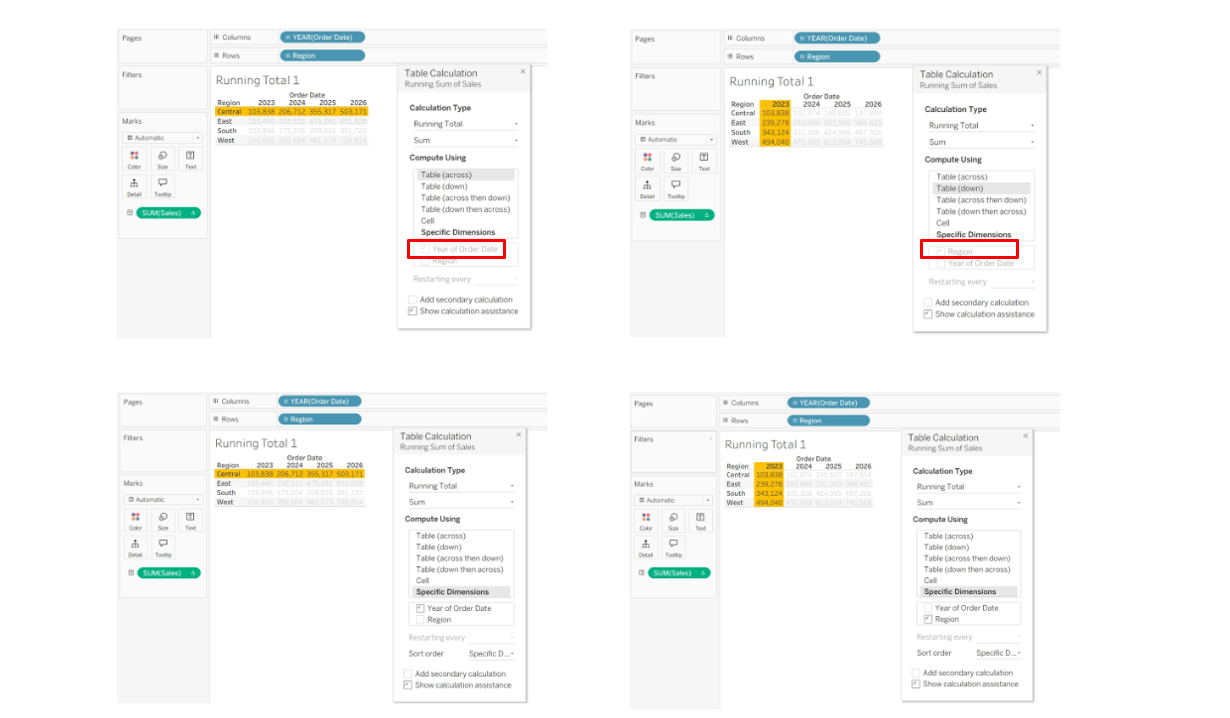
Running Total
- This calculation continuously add the current value to the sum of the preceding values.
- In the example below, you can see that running totals can be computed in different ways. In the Table (across), the running total moves horizontally across the columns - so we see a running total of sales in each region across the years.
- In Table (down), the running total moves vertically across the rows, so we see a running total of sales in each year across the regions.
- The areas highlighted in red demonstrate that both of these calculations can also be done with the specific dimensions option. If you compare the selected checkboxes, you will see that the two setups are identical.
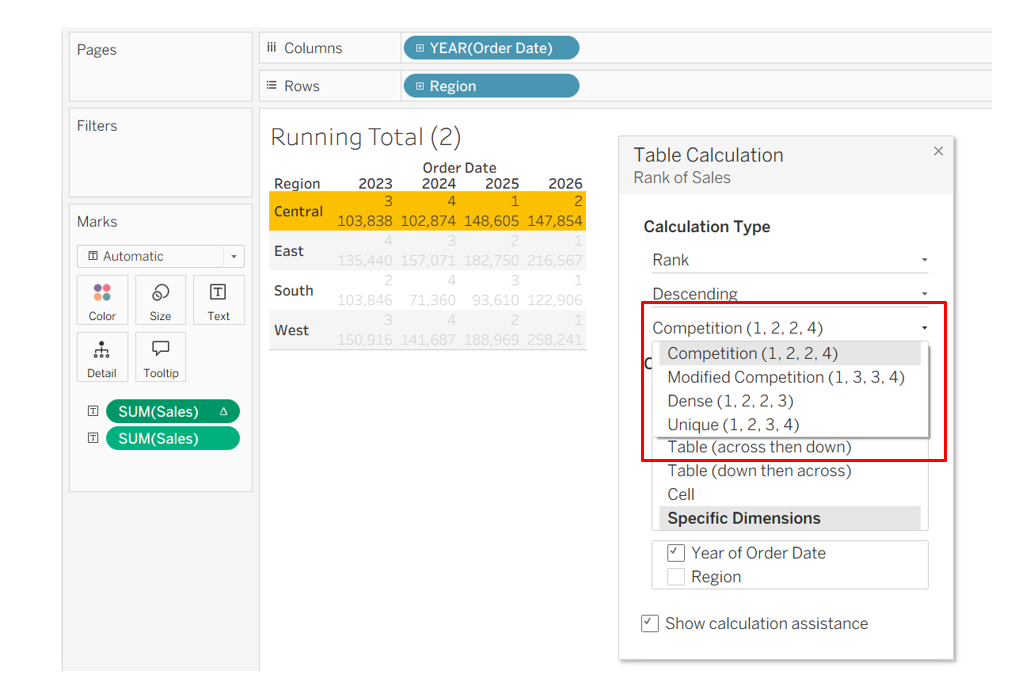
Rank
- This calculation assigns a numeric position to your data points based on their values, usually ordered from highest to lowest e.g. (1,2,3...)
- In the example below, we are ranking years against each other for each separate region. (In the Central region, 2025 was the year with the highest sales, then 2026 etc.) Additionally, the red box shows that you are able to choose how that rank is configured.
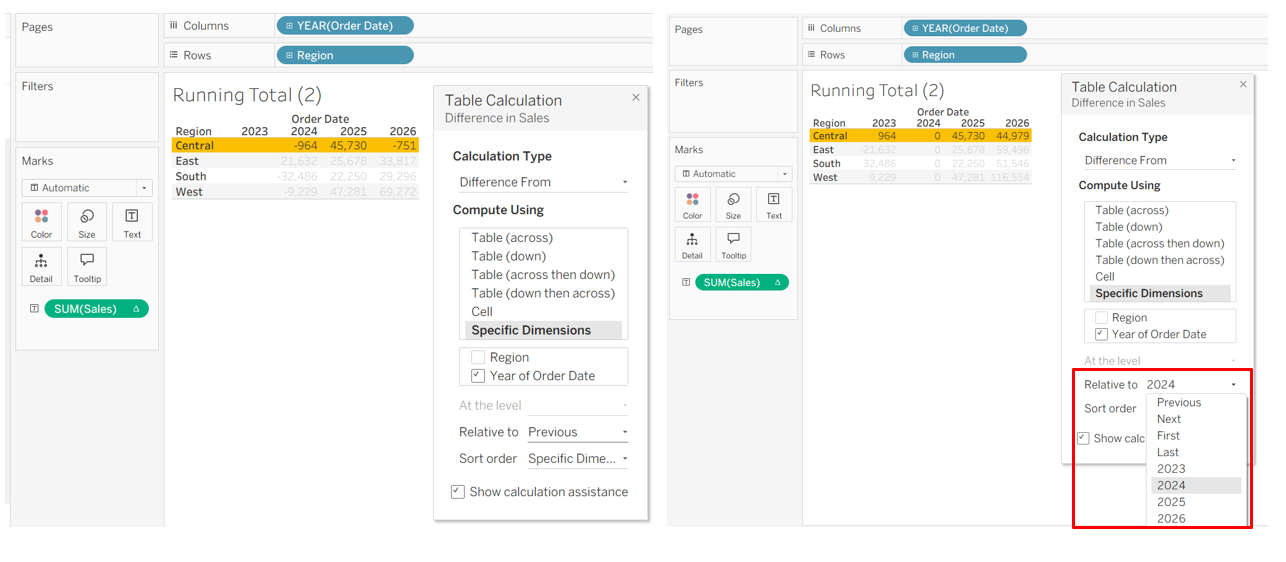
Difference from/ % difference from
- This calculations subtracts the value of the previous period from the current value to show the change
- With % difference from, it will show the % change.
- In the example below, we can see how the sum of sales has changed from the previous year. For 2023, the column is blank because we don't have data from 2022 to compare to. In the red square, you'll notice that you can change the period in which it is calculating the difference from.
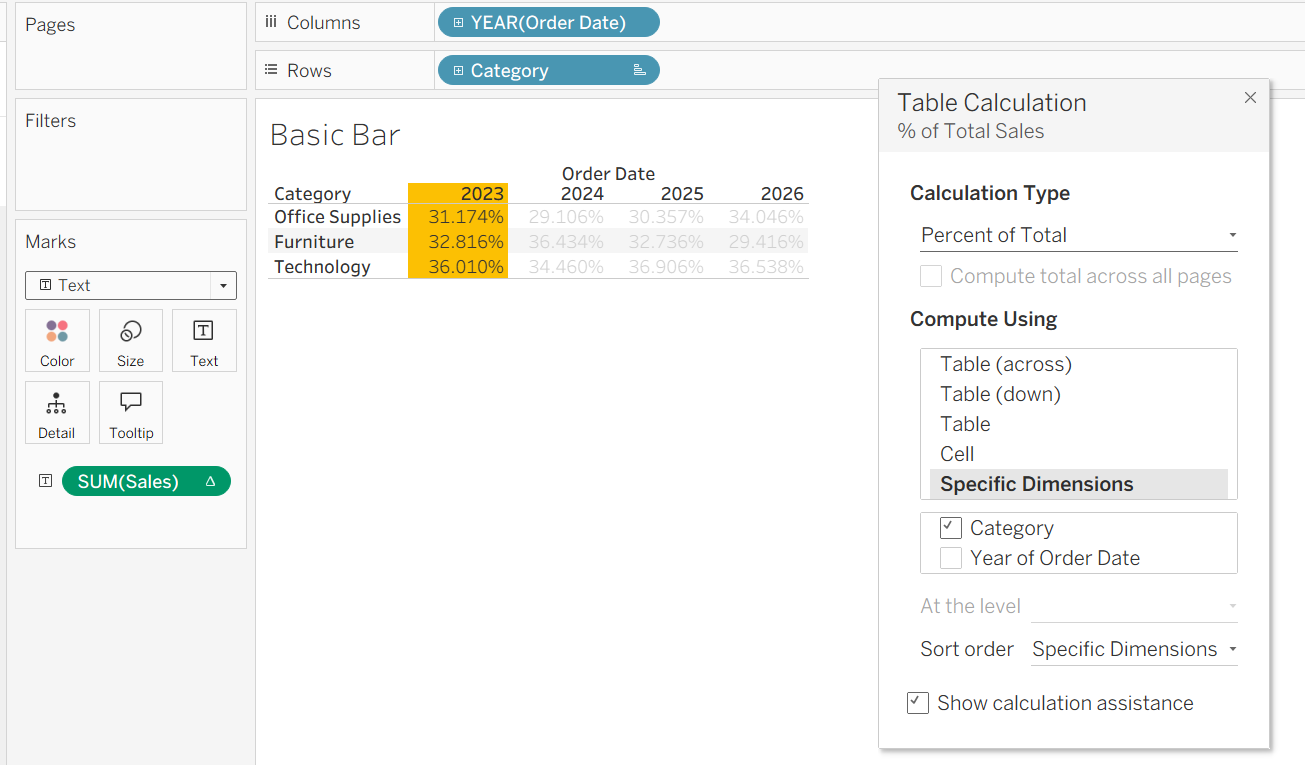
% Of Total
- This calculates what proportion a specific data point contributes to a defined total. In the example below, this defined total is across categories - the values highlighted show what % of sales that each category contributes for 2023.