Brief
Our 'simple' goal today was to build an Alteryx App that builds an HTML trend analysis report based on the user input.
We were able to pick between the Historical Weather API or the Wikimedia API.
We had to design an Alteryx App that allows for user inputs:
- A location (if using the Weather API)
- A Wikipedia page (if using the Wikipedia API)
- A time range (start and end date)
- Optional inputs that allows the user to change the prompts / output formats to the desired standard.
The Alteryx App will need to pull in the data for that timeframe, create an LLM prompt using the Al Prompt tool and request a trend report in HTML format so it can be rendered directly in our browsers upon completion.
Plan
Connecting to Historical Weather API
First I had to read through the documentation to find out what fields were needed in my text input.
Required fields:
- base url - https://archive-api.open-meteo.com/v1/archive?
- latitude, longitude format = "&latitude=51"
Everything else was optional and was dependent on what you want to bring back
Fields I chose to bring:
temperature_2m_max, temperature_2m_mean, temperature_2m_min, precipitation_sum, precipitation_hours, apparent_temperature_max, apparent_temperature_mean, apparent_temperature_min, weather_code, sunshine_duration, wind_speed_10m_max and then also start and end date as that was noted in the brief.
this in the url would be:
&start_date=##Start##&end_date=##End##&daily=weather_code,temperature_2m_max,temperature_2m_min,temperature_2m_mean,apparent_temperature_max,precipitation_sum,precipitation_hours,sunshine_duration,wind_speed_10m_max&tiemzone=auto$
Building the flow first
I decided to just build the flow first before I put in any user inputs.

All this flow does is pull the data from the API, and then the prompt tool sends the data to Gemini along with an instruction to write a weather trend analysis as a self contained HTML document. A formula tool was used to set the output file path and then the response was converted to a blob and written to the disk as a html file that opened directly into the browser. The output format can be found further down in the prompt section.
User Input Location
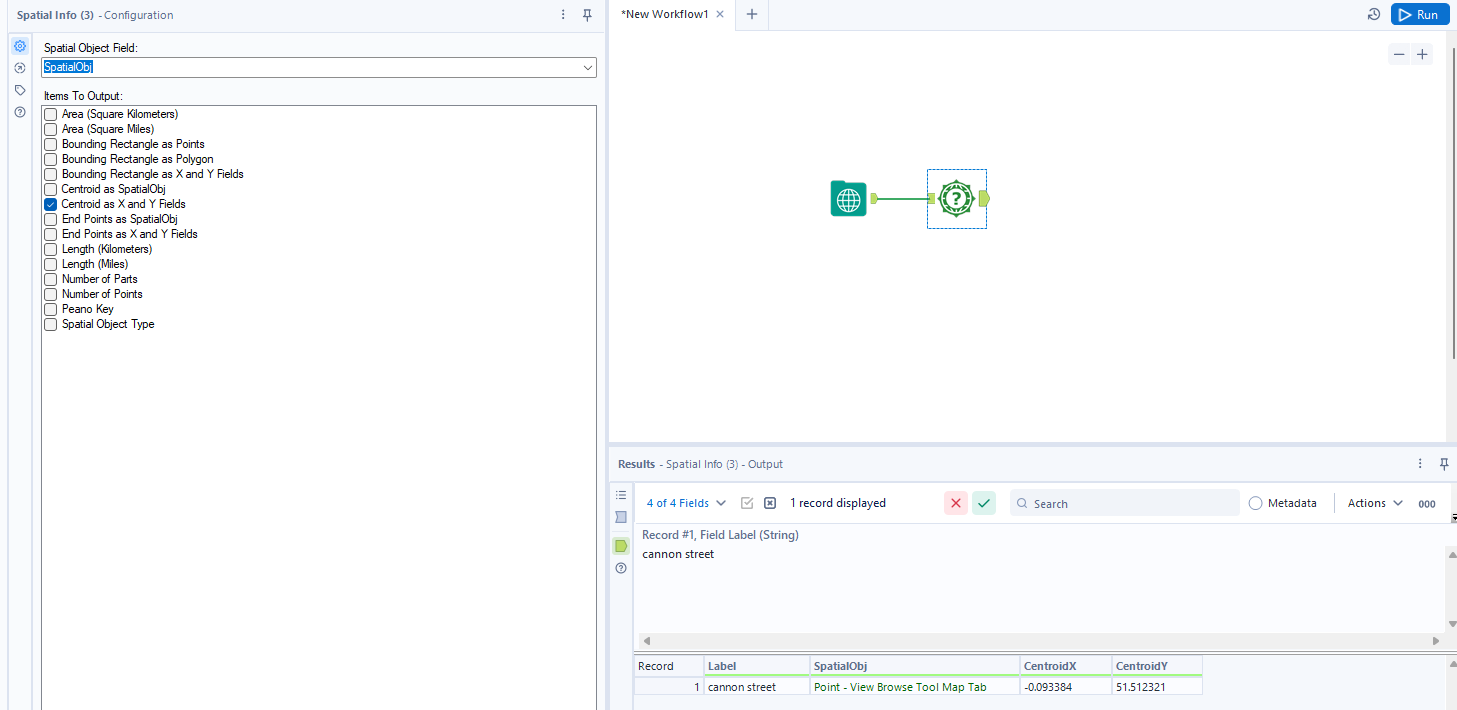
One of the requirements was getting location as a user input field. This is possible by using the Map Input Tool which allows a user to select a point on a map. Then by connecting it to a Spatial Info Tool, we can extract the latitude and longitude of that point.
Designing the Prompt
At first I inputted a very generic prompt:
You are a climate data analyst producing a weather trend report for a general audience. Analyse the daily weather data provided and write a complete, self-contained HTML report.
Work only from the data given. Do not estimate, infer, or invent any figure that is not present in the data.
Daily weather observations, as JSON:
Return a complete HTML document beginning with <!DOCTYPE html>. No
markdown, no code fences
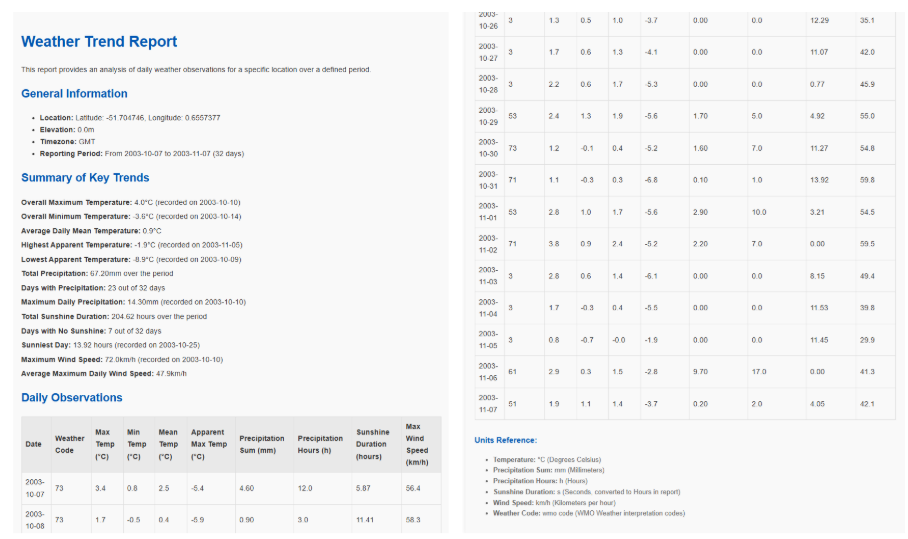
As you can expect it outputted a very generic report:
Formatting the Prompt
To keep it easy to read and process, I split my prompt into different sections
- #Role
- #Rules: What they have to adhere to
- #Data: [DownloadData]
- #WMO Code Translation
- #Output Format
- #Data Array
- #Page Structure
- #Header
- #KPI Cards
- #Tabs
- #Closing
- #Style: What applies to every style
- #Requested Style: [Style]
The Data and Requested Style were pointed to my [DownloadData] and [Style] columns so it would pull the data from the requested dates and location as well as requested Style.
I also decided to make sure that I added some other features such as:
- Tabbed Sections
- Survival rating - Score each day on a made-up index from the actual wind, temperature and precipitation, then show a calendar heatmap coloured by score.
- Laundry Index - Should you have done your laundry based on the weather conditions
Challenges
- Over-engineering - the more complex my prompt was, the more times it just would not render
- Consistency with outputs - even with the same prompt the output would be different every time I ran it.
- Not asking Gemini what the best structure it needed was. I only did this later on where I fed Gemini the prompt I had and asked it to make it more readable for Gemini. This in theory should have made it more optimal however I found that the prompt it gave back was missing some instructions - e.g. what tabs I wanted and style guides.
- I ended up reverting back to my original prompt.
Prompt Outputs
Clean and Professional
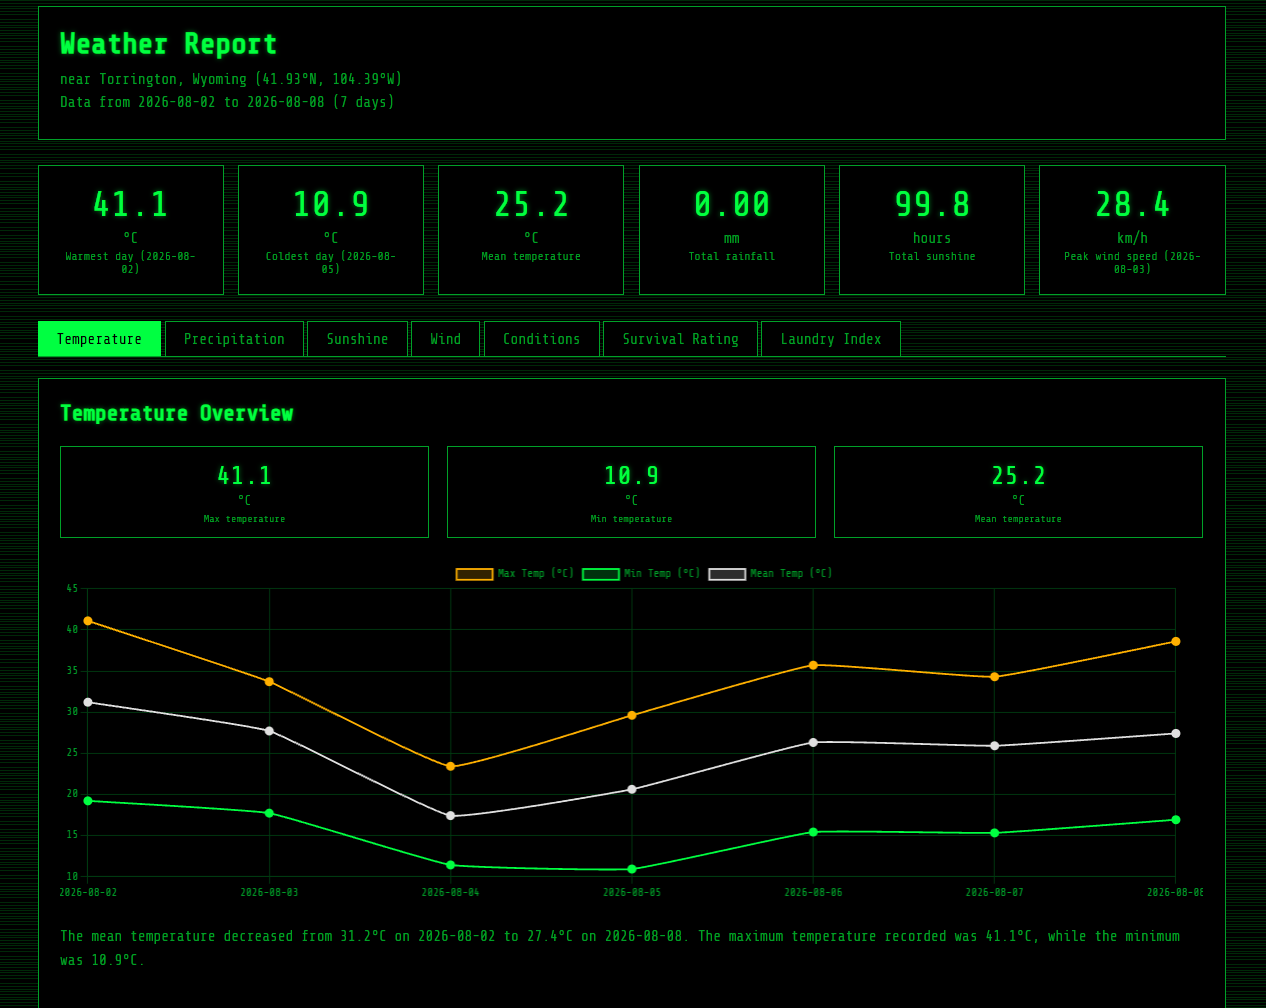
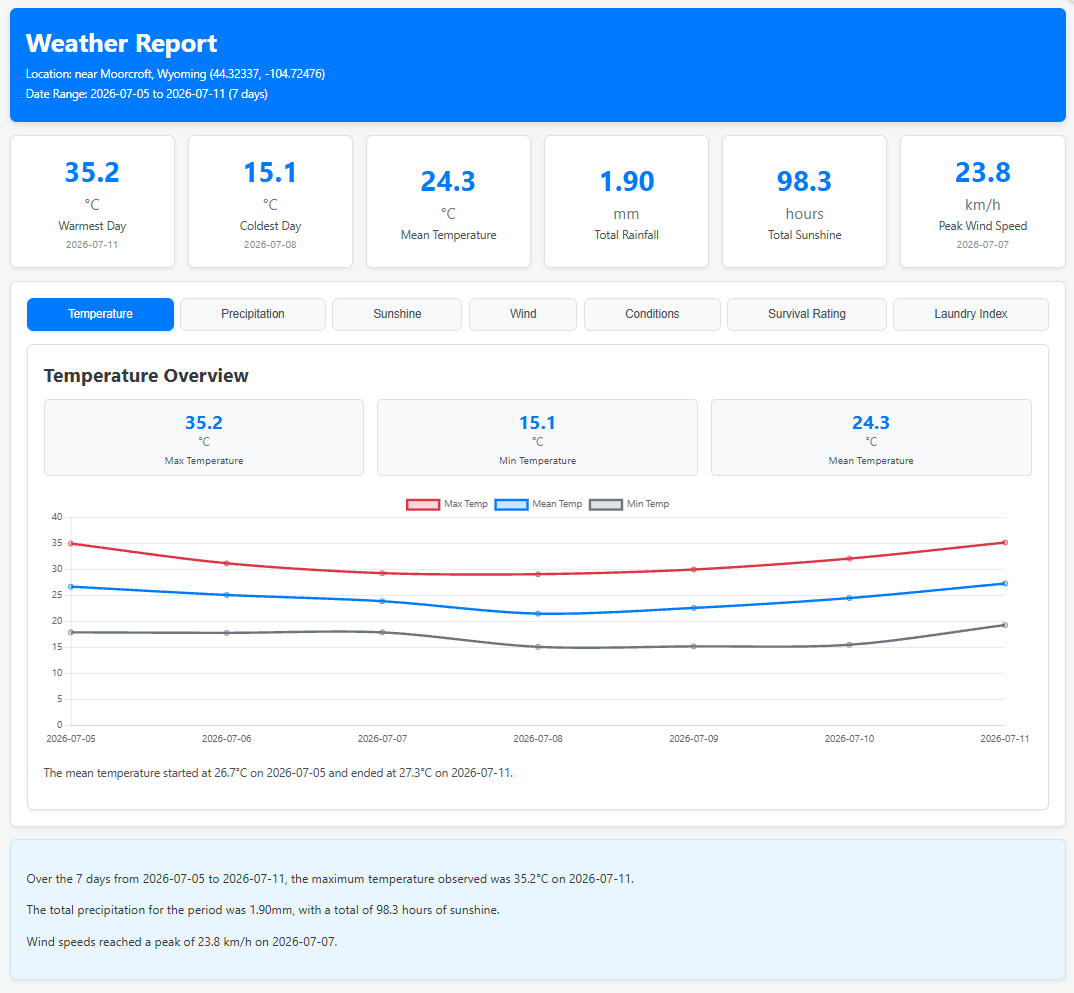
Weather Report
Location: near Moorcroft, Wyoming (44.32337, -104.72476)
Date Range: 2026-07-05 to 2026-07-11 (7 days)
Temperature Overview
The mean temperature started at 26.7°C on 2026-07-05 and ended at 27.3°C on 2026-07-11.
Precipitation Overview
Daily precipitation was 0.00mm on 2026-07-05 and 0.00mm on 2026-07-11.
Sunshine Overview
Sunshine duration was 14.8 hours on 2026-07-05 and 14.7 hours on 2026-07-11.
Wind Overview
Maximum wind speed was 21.5 km/h on 2026-07-05 and 22.7 km/h on 2026-07-11.
Weather Conditions Overview
The weather condition on 2026-07-05 was Partly cloudy, and on 2026-07-11 it was Clear sky.
Survival Rating
Average score: 96
Best day: 2026-07-05 (Score: 97)
Worst day: 2026-07-07 (Score: 92)
Score: 97
Temp: 35.0°C / 17.9°C
Rain: 0.00mm
Wind: 21.5 km/h
Score: 93
Temp: 31.2°C / 17.8°C
Rain: 0.10mm
Wind: 23.3 km/h
Score: 92
Temp: 29.3°C / 17.9°C
Rain: 0.50mm
Wind: 23.8 km/h
Score: 96
Temp: 29.1°C / 15.1°C
Rain: 1.10mm
Wind: 11.9 km/h
Score: 96
Temp: 30.0°C / 15.2°C
Rain: 0.20mm
Wind: 15.4 km/h
Score: 96
Temp: 32.1°C / 15.5°C
Rain: 0.00mm
Wind: 22.9 km/h
Score: 97
Temp: 35.2°C / 19.3°C
Rain: 0.00mm
Wind: 22.7 km/h
This is an invented comfort index, not a meteorological standard.
Laundry Index
Best drying day: 2026-07-05 (Score: 90)
Days with good or perfect drying conditions (score 60+): 5 days
Wind: 21.5 km/h
Rain: 0.00 mm
Max Temp: 35.0°C
Wind: 23.3 km/h
Rain: 0.10 mm
Max Temp: 31.2°C
Wind: 23.8 km/h
Rain: 0.50 mm
Max Temp: 29.3°C
Wind: 11.9 km/h
Rain: 1.10 mm
Max Temp: 29.1°C
Wind: 15.4 km/h
Rain: 0.20 mm
Max Temp: 30.0°C
Wind: 22.9 km/h
Rain: 0.00 mm
Max Temp: 32.1°C
Wind: 22.7 km/h
Rain: 0.00 mm
Max Temp: 35.2°C
This is an invented index, not a meteorological standard.
Over the 7 days from 2026-07-05 to 2026-07-11, the maximum temperature observed was 35.2°C on 2026-07-11.
The total precipitation for the period was 1.90mm, with a total of 98.3 hours of sunshine.
Wind speeds reached a peak of 23.8 km/h on 2026-07-07.
Pinks
Weather Conditions Overview
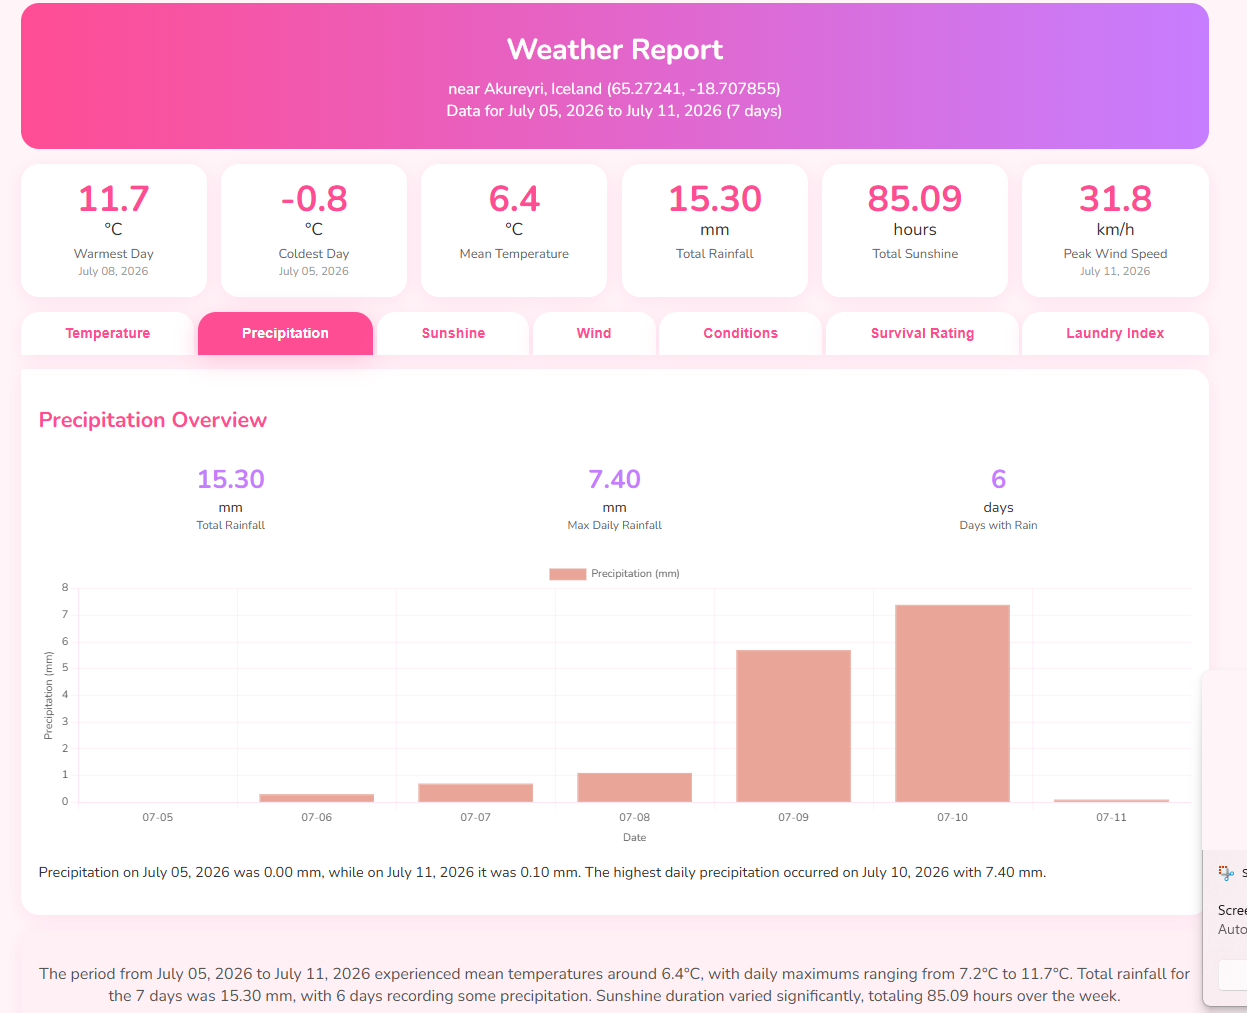
The period began on July 05, 2026 with overcast conditions, and ended on July 11, 2026 with drizzle. Drizzle was the most frequent condition, occurring on 5 days.
The period from July 05, 2026 to July 11, 2026 experienced mean temperatures around 6.4°C, with daily maximums ranging from 7.2°C to 11.7°C. Total rainfall for the 7 days was 15.30 mm, with 6 days recording some precipitation. Sunshine duration varied significantly, totaling 85.09 hours over the week.
Retro
Temperature Overview
The maximum daily temperature started at 29.4°C on 2026-08-02 and ended at 28.9°C on 2026-08-08. The minimum daily temperature started at 20.0°C on 2026-08-02 and ended at 15.8°C on 2026-08-08.
Precipitation Overview
Daily precipitation started at 0.30 mm on 2026-08-02 and ended at 3.60 mm on 2026-08-08. The highest daily precipitation was 14.30 mm on 2026-08-07, while 0.00 mm was recorded on 2026-08-04.
Sunshine Overview
Daily sunshine duration started at 12.90 hours on 2026-08-02 and ended at 12.75 hours on 2026-08-08. The maximum daily sunshine recorded was 12.96 hours on 2026-08-04.
Wind Speed Overview
The maximum wind speed started at 18.0 km/h on 2026-08-02 and ended at 15.3 km/h on 2026-08-08. The highest recorded wind speed was 18.7 km/h on 2026-08-06.
Weather Conditions Overview
The period began with Drizzle on 2026-08-02 and ended with Drizzle on 2026-08-08. The most frequent condition was Drizzle, occurring on 5 days, while Rain occurred on 1 day.
Survival Rating
Average score: 90.7
Best day: 95.9 on 2026-08-03
Worst day: 76.9 on 2026-08-07
This is an invented comfort index, not a meteorological standard.
Laundry Index
Best drying day: 100.0 on 2026-08-04
Days scoring 60 or above: 5 days
This is an invented index, not a meteorological standard.
The period from 2026-08-02 to 2026-08-08 experienced temperatures ranging from a minimum of 15.8°C to a maximum of 30.9°C, with a mean temperature of 23.2°C.
Total rainfall for the week was 20.30 mm, with the highest daily amount of 14.30 mm occurring on 2026-08-07.
Sunshine was consistent, totaling 89.16 hours across the seven days.