


Understanding the difference between dimensions and measures will increase efficiency and change the way you build your visualizations.
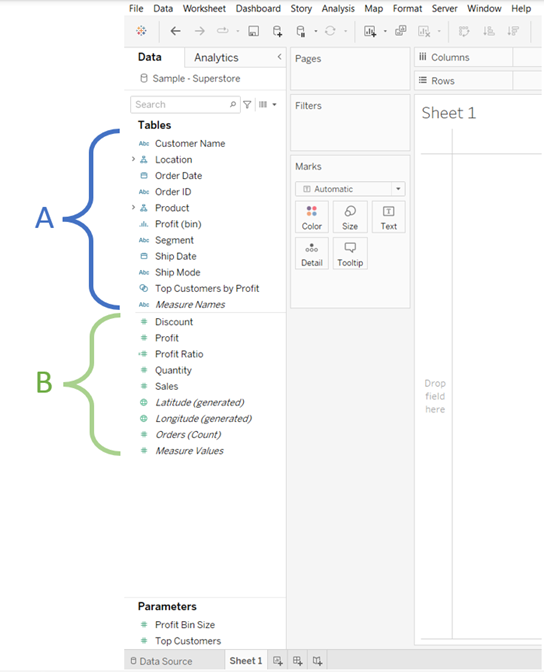
Tableau will automatically classify your data by assigning it to either a green measure or blue dimension. The dimension fields (A) are at the top of the side bar and the measure fields (B) are at the bottom.
Dimensions: are most often discrete data, meaning they can be categorized and returned as 'headers' because they are individual and independent of one another. These categories are usually string values, meaning they are words signifying a category type or name.
Measures: are most often continuous data, meaning they can be measured on a range or scale and are usually numerical values that can be aggregated.
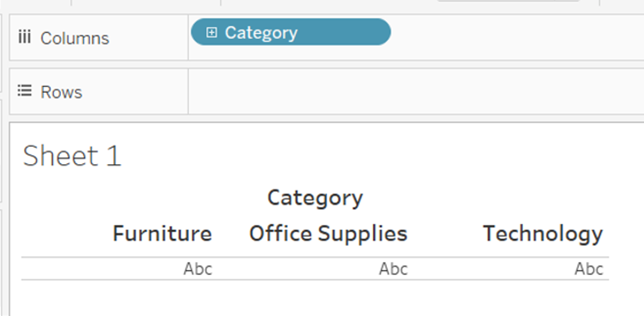
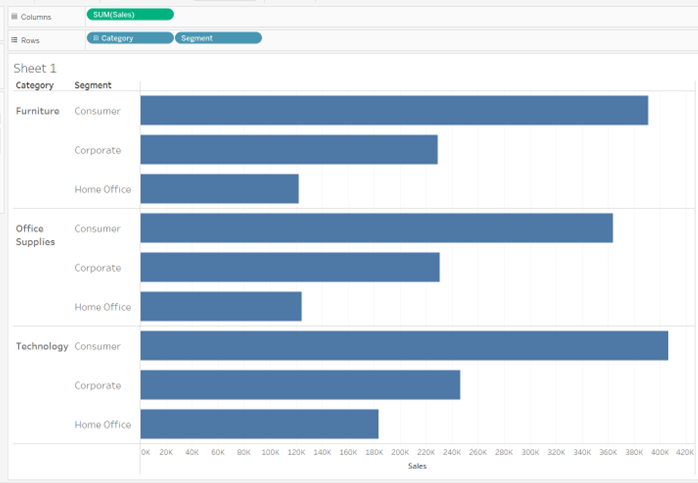
When you combine both the blue and the green pills into the columns and rows, it will use the blue pill as headers (or marks) and the green pill as the values assigned to each of the headers.
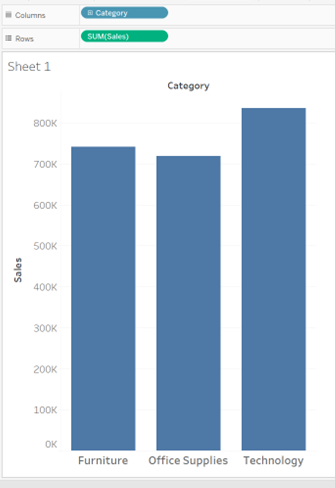
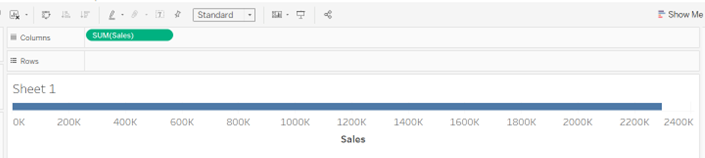
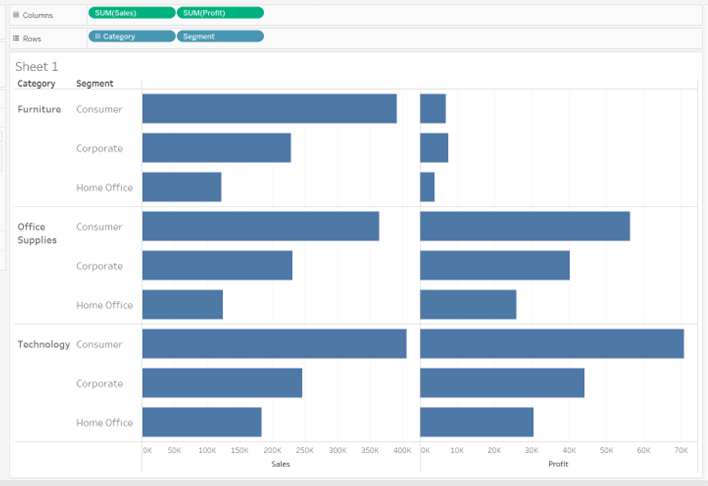
You can add multiple blue and green pills to the rows and columns. Adding more blue pills will include more headers that are filtered by the blue pill before it. Adding more green pills will include a whole other scale to measure the new value.
What can become slightly confusing is that the colours green and blue used to distinguish between measures and dimensions actually correspond to being either continuous or discrete, so not actually dimension or measures themselves. Thinking about this, there can be dimensions that are green and measures that are blue.
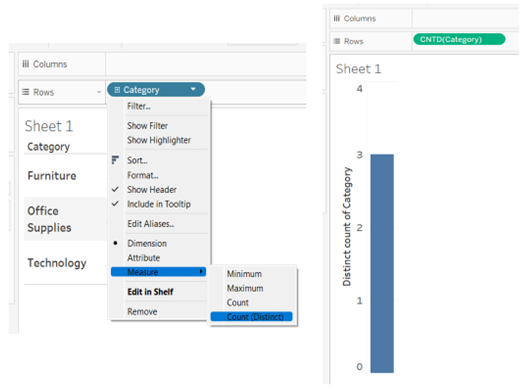
Think: what would happen when blue pills are converted to green pills (continuous data)?
Answer:
The 'headers' can be counted.
'Count' will return the number of times the headers are repeated within a dataset. Whereas 'count distinct' will return the number of headers without taking repeats into account.

Think: what would happen when green pills are converted to blue pills (discrete data)?
Answer:
The measure value number would become a single header.