


I find quite tricky using filters with blended data sources, so I have decided to write two blog posts on this subject.
The first one will be on how to use a map as filter for charts coming from a different datasource, while the second one will be on how to let a filter work on different charts creating a parameter.
HOW TO USE A MAP AS A FILTER IF YOU HAVE MULTIPLE DATA SOURCES?
Consider Sample Superstore and Superstore Sales.
STEP 1
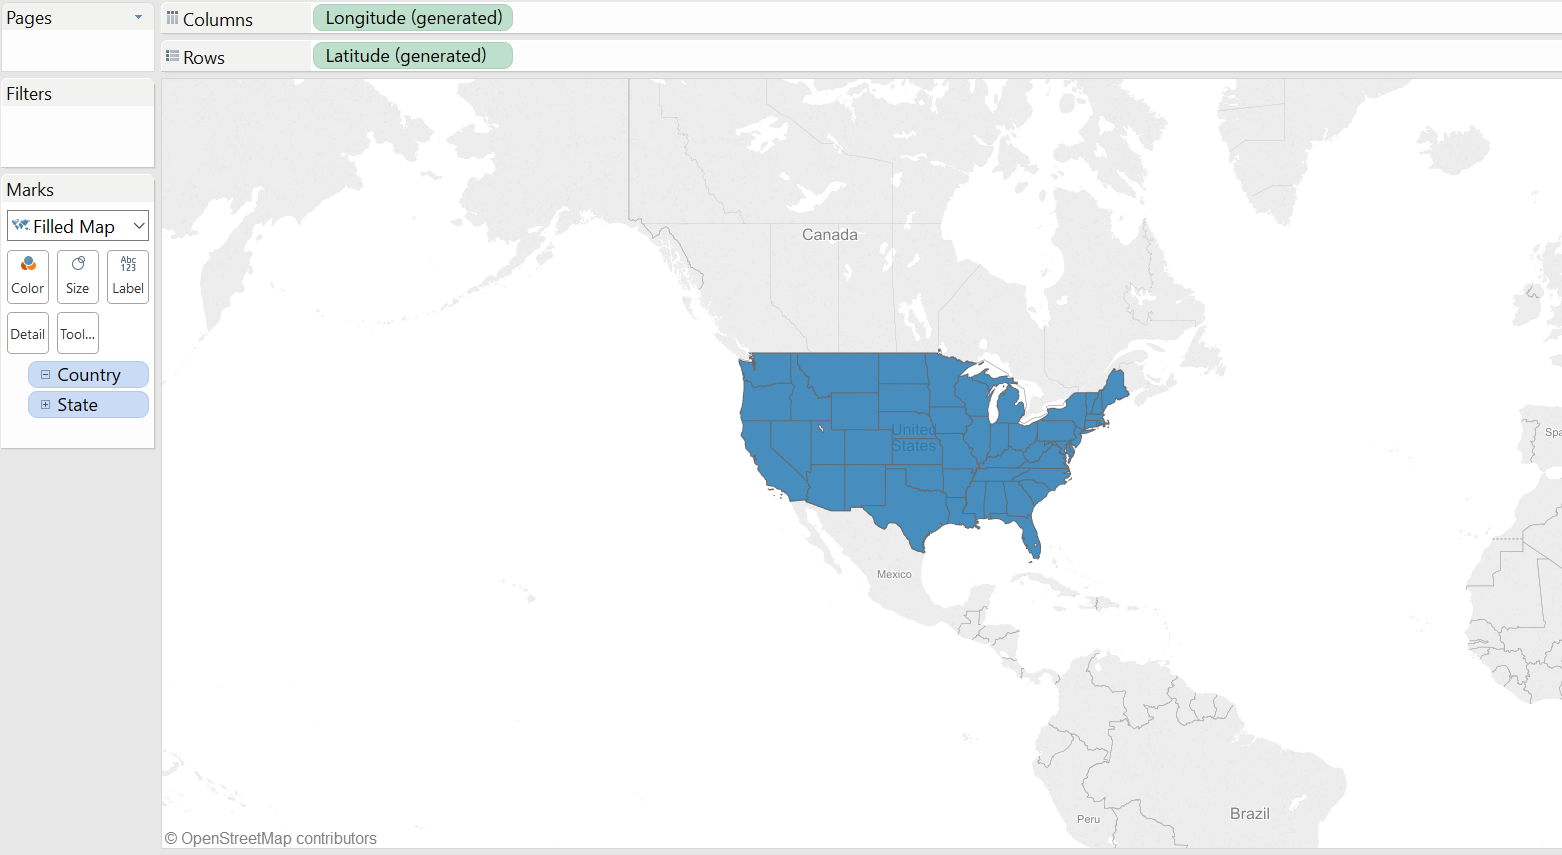
- Connect to Sample Superstore
- Put Latitude and Longitude in Rows and Columns and Country and States in Detail
STEP 2
- Connect to a second data source, Superstore Sales
- Blend them by State (Sample Superstore as primary datasource and Superstore Sales as secondary)
STEP 3
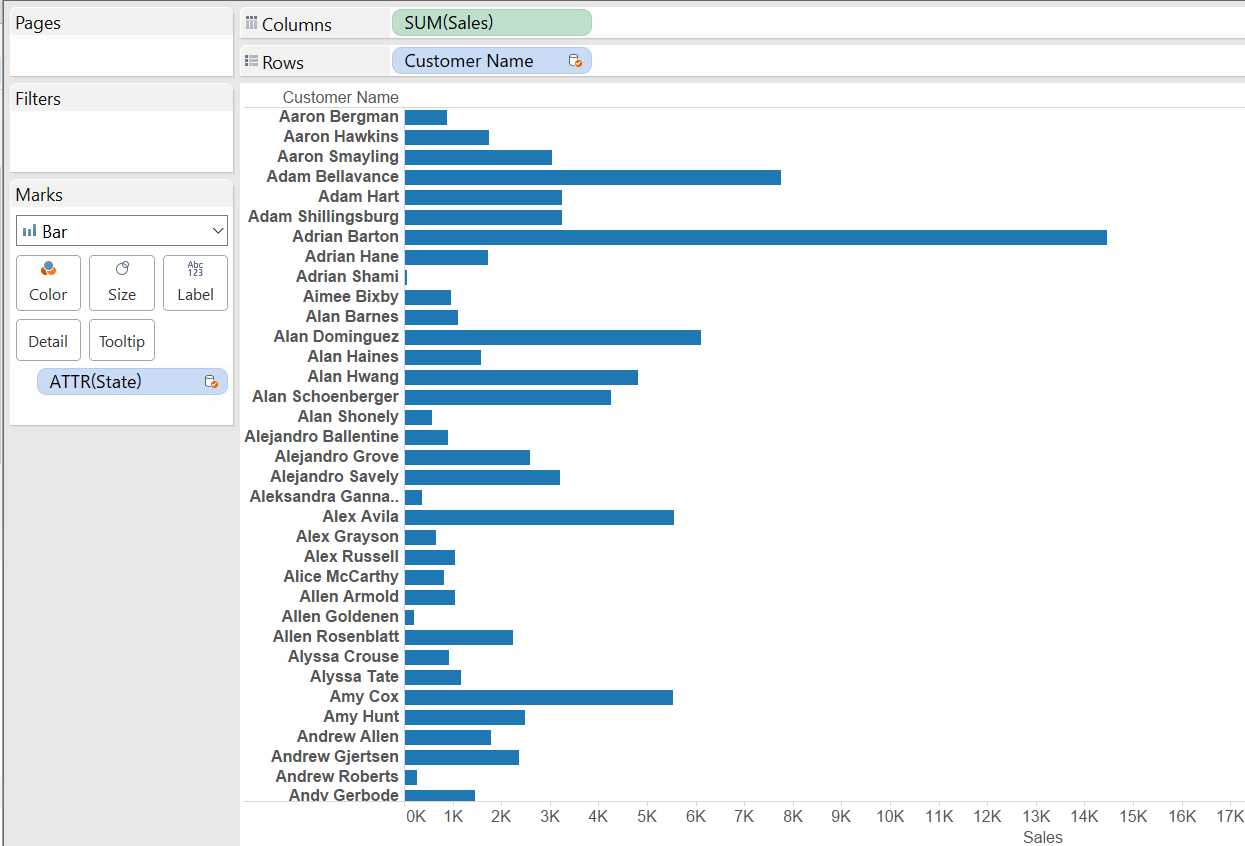
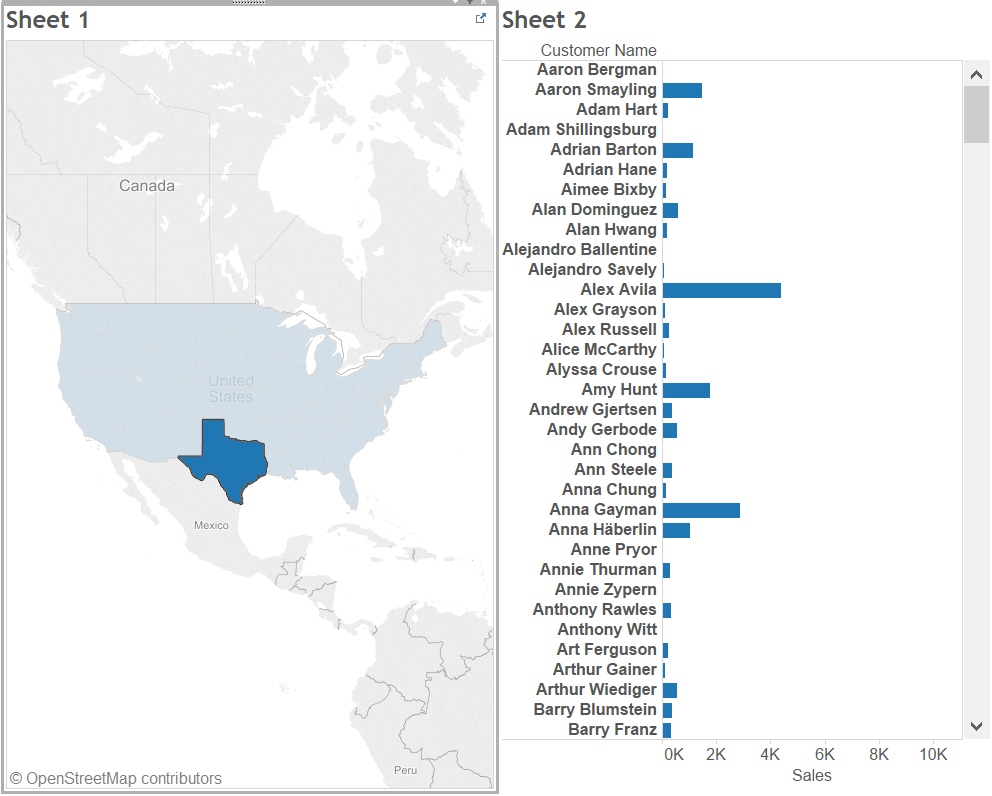
- Build a view using the second data source, for example dragging sum(sales) and customer name in the view building a bar chart
STEP 4
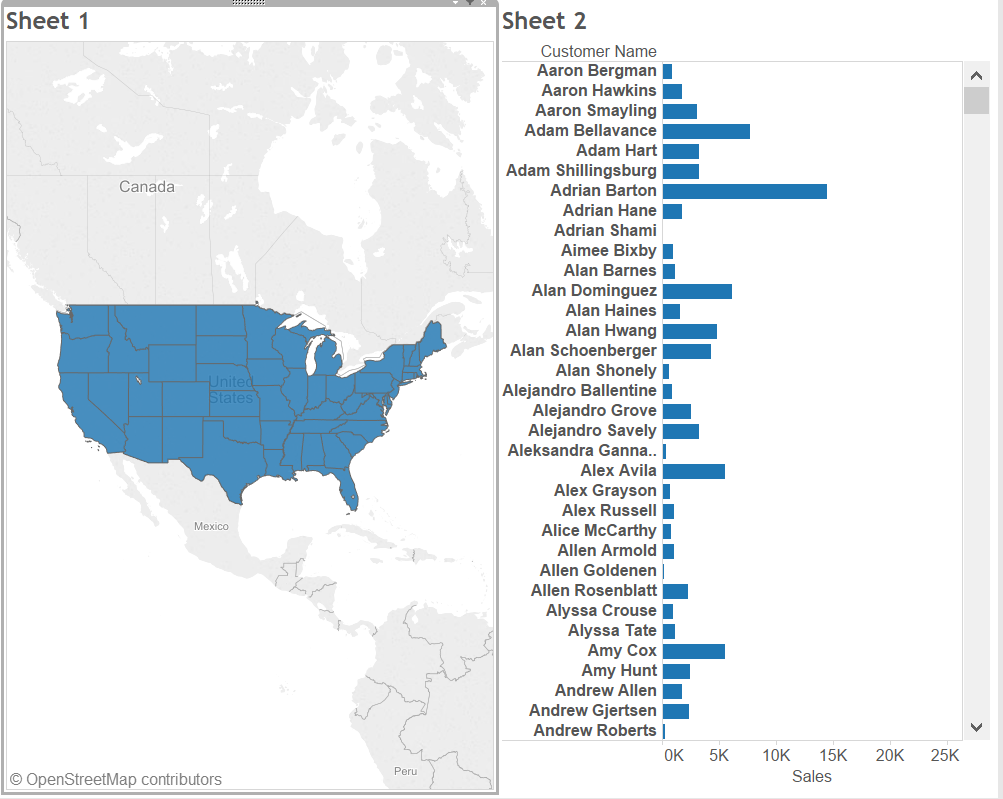
- Build a dashboard with the two worksheets in it
- Create an action filter in order to use the map as a filter for the bar chart (dashboard > actions > add action > filter) and set up the following settings:
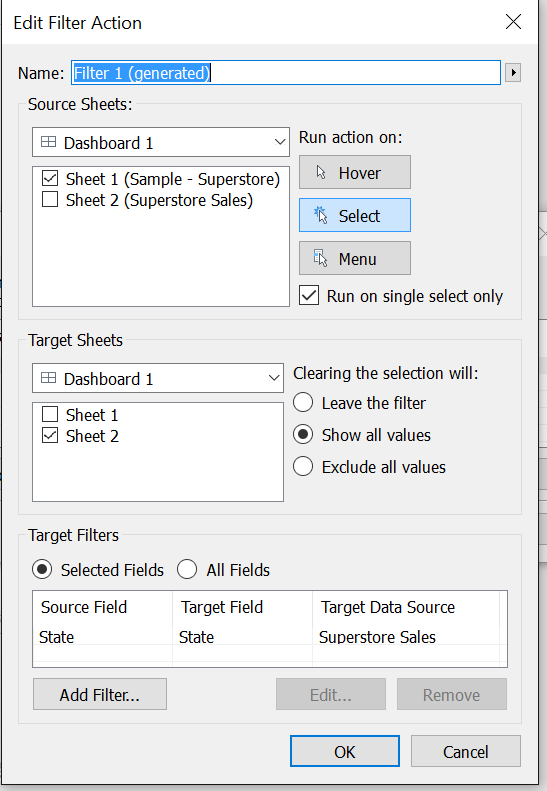
And now, you will be able to filter using your map!
I hope you found it useful.
A presto!