


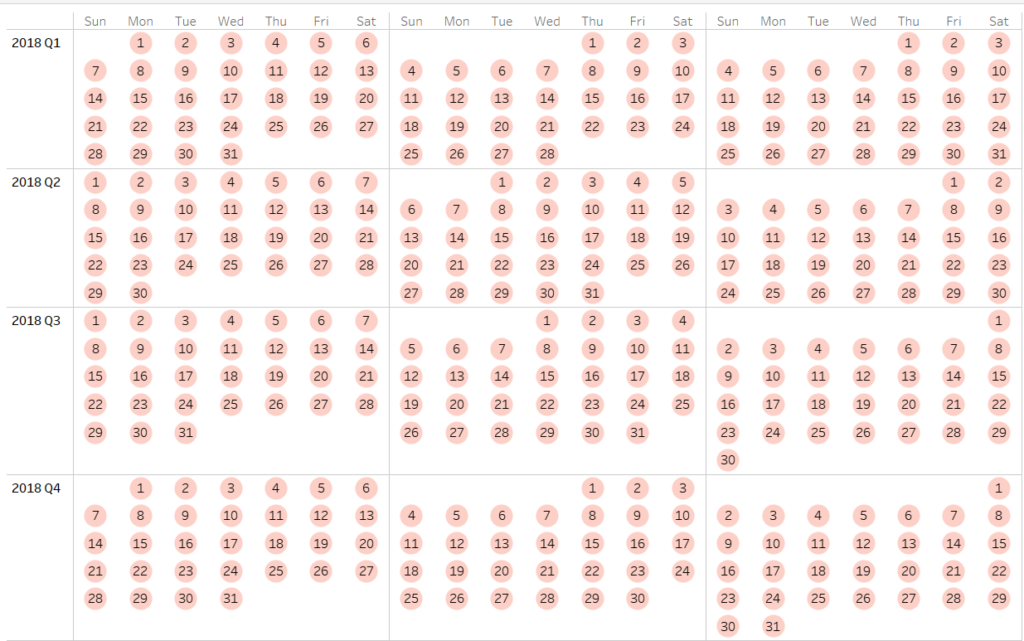
Thanks Andy for giving me the challenge to complete the #WorkoutWednesday week44. I’ll explain how to make annual calendars in Tableau using the Superstore Data.
Step 1: Decide what you want in Columns and Rows
Columns: Number of Months within a Quarter >> Weekday(Order Date)
Rows: Quarter(Order Date) >> Number of Weeks within a Month
Step 2: Create a calculated field for ‘Number of Months within a Quarter’
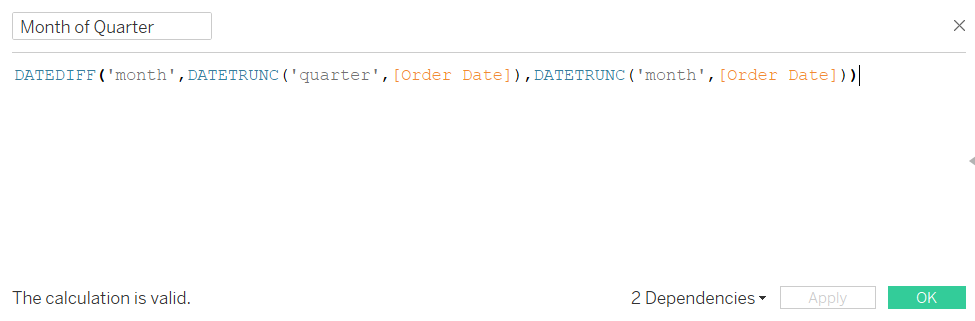
For example, for the date 01/01/2020, DateTrunc ‘quarter’ returns 01/01/2020; DateTrunc ‘month’ returns 01/01/2020; the difference between these two dates on a ‘month’ level is 0.
Apply the same logic for the rest of the months, the ‘Number of Months within a Quarter’ will put Jan, Apr, July, Oct in Column 0; Feb, May, Aug, Nov in Column 1; Mar, Jun, Sept, Dec in Column 2.
Step 3: Create a calculated field for ‘Number of Weeks within a Month’

For example, for the date 01/01/2020, DateTrunc ‘month’ returns 01/01/2020; DateTrunc ‘week’ returns 01/01/2020; the difference between these two dates on a ‘week’ level is 0.
Apply the same logic for the rest of the days, the ‘Number of Months within a Quarter’ will return row numbers 0,1,2,3,4 for the relevant dates within a month.
Step 3: Put your calculations on Columns and Rows
Columns: Number of Months within a Quarter >> Weekday(Order Date)
Rows: Quarter(Order Date) >> Number of Weeks within a Month
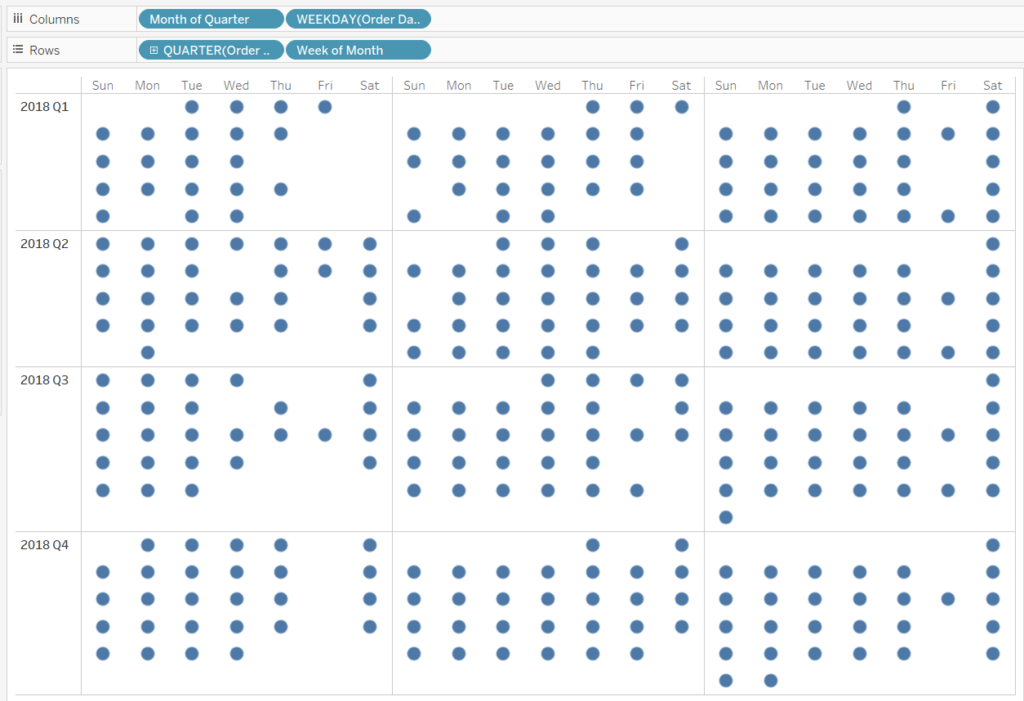
Why do we have missing dots in the view? That’s when there’s no sales data recorded on the day. We’ll improve our calendar in the next blog.