Today was Day 2 of Dashboard Week. Our challenge for today was to create a dashboard using IMDb Data, and to only use Tableau Prep for any data preparation.
You can read our full brief from Jenny here.
What are .tsv and .tsv.gz files?
The IMDb datasets were downloaded as tsv.gz zipped files.
This was my first time coming across tab-separated-value datasets (tsv and tsv.gz files), but after some quick googling, I learned that:
1. tsv files are compatible with Tableau Prep.2. tsv.gz files are zipped files - to extract the tsv files you can use a (free) software called 7-Zip .
And with that I managed to load the data successfuly into Tableau Prep!
Plan your Prep (& Dashboard!)
My next focus was to better understand the dataset and files, decide on what my desired output looks like and create an Exalidraw plan for my dashboard. So how did I go about this?
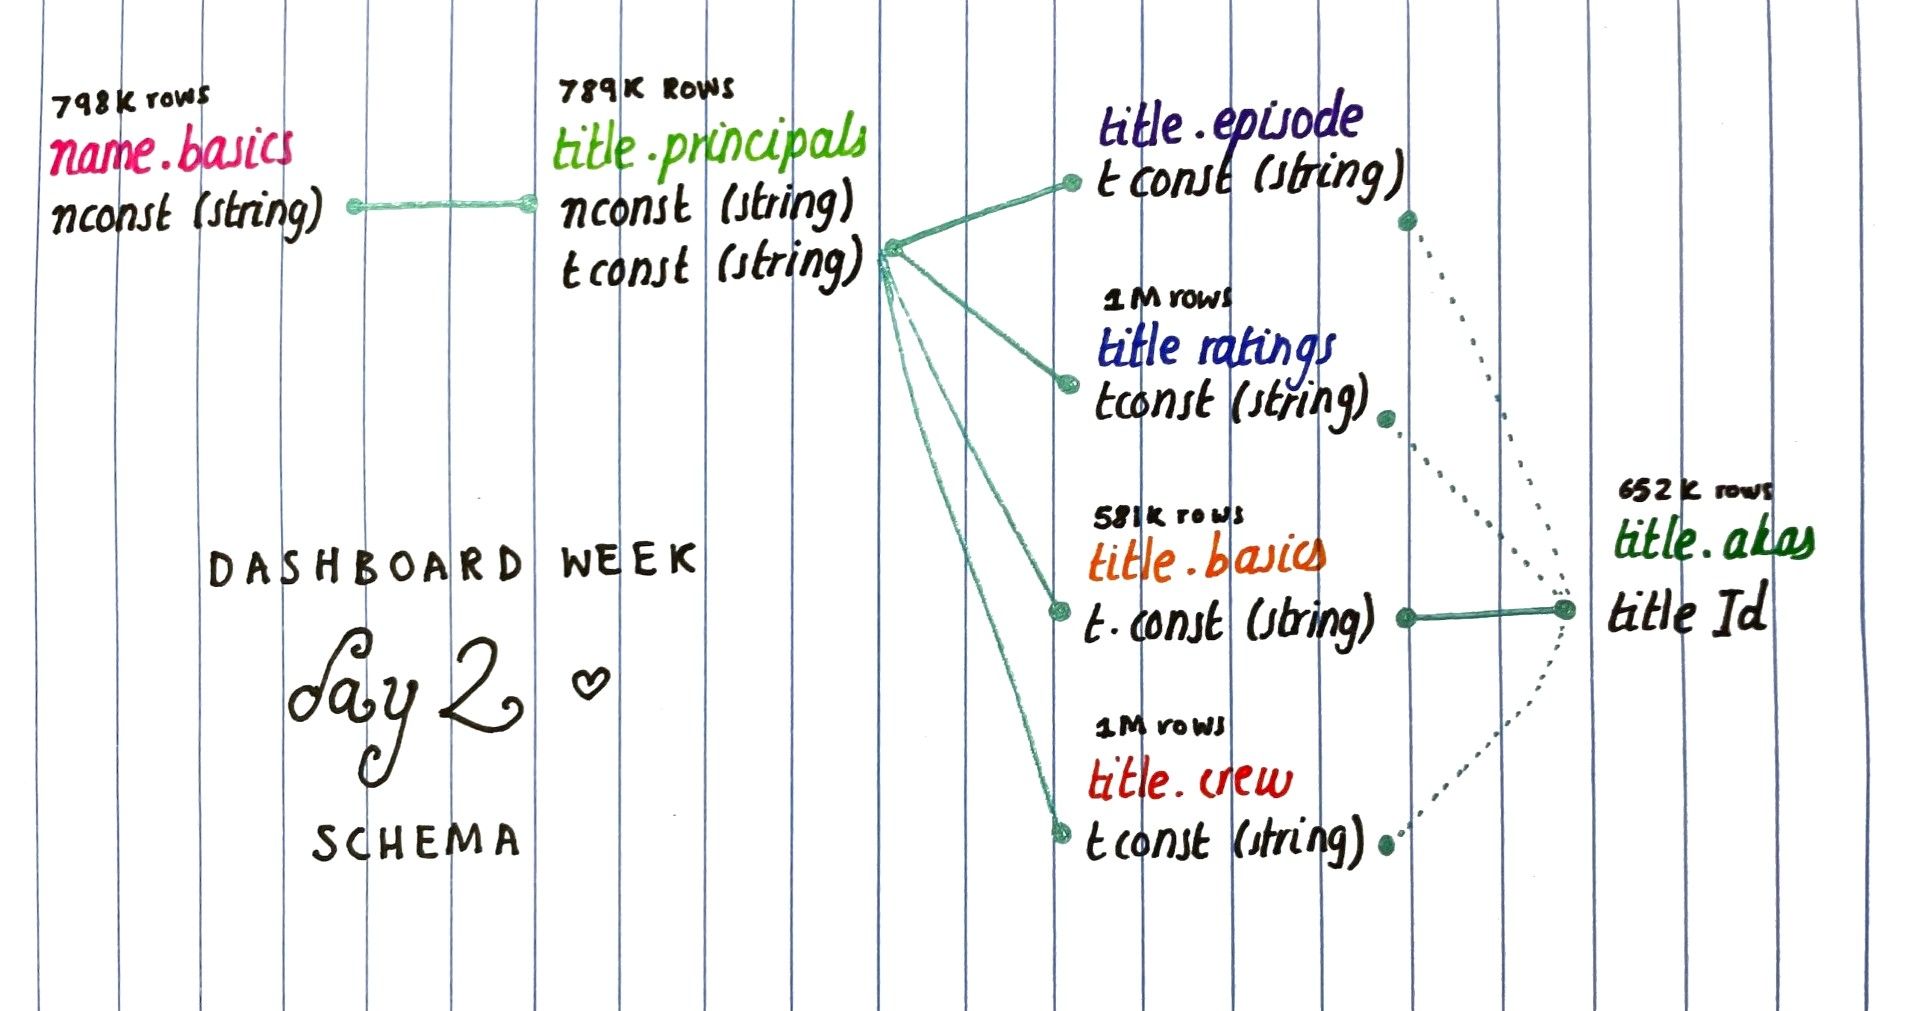
1. Start with a Schema.

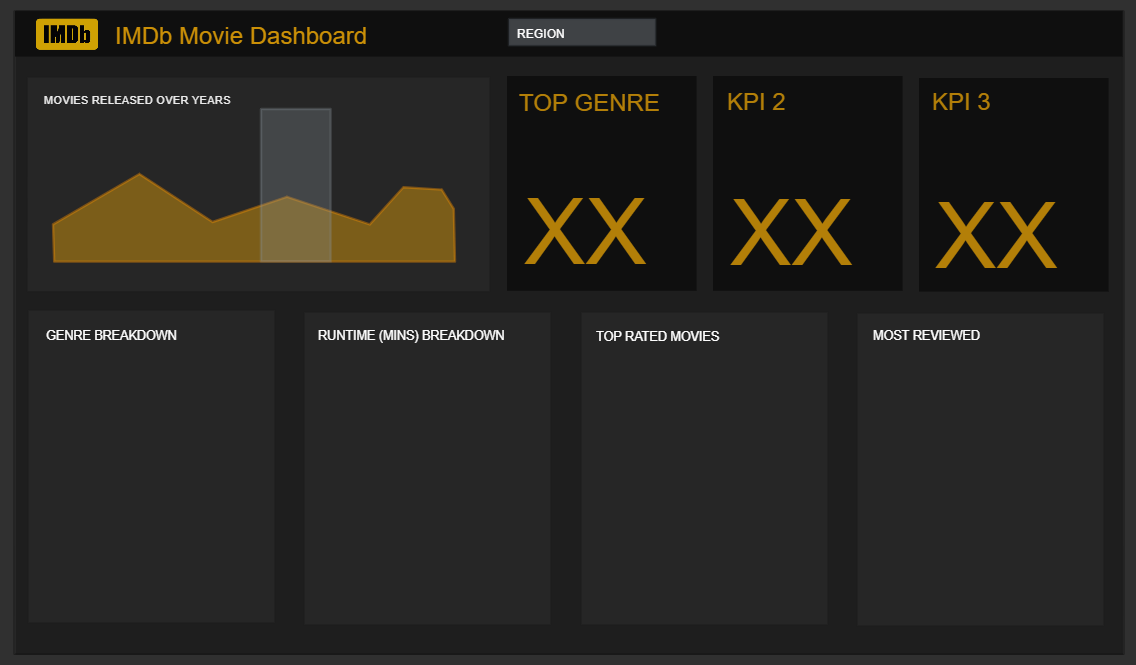
2. What is my Desired Output? / 3. Excalidraw plan
I combined the next two steps together. For me, when I have a clear idea of what I want my dashboard to show, I can start thinking about what data I would need to build that.
This was my intial plan for my dashboard - I was very much inspired by the IMDb website UI:

From my exalidraw plan, I knew that I only needed the title.basics, title.akas and title.ratings datasets, and important fields I needed within my final output were "Year of Movie Released", "Movie Titles" , "Genre", "Rating" and "No. of Reviews".
As my dashboard was focused on Movies, I also excluded all TV series information from my dataset in Tableau Prep.
Building the Dashboard
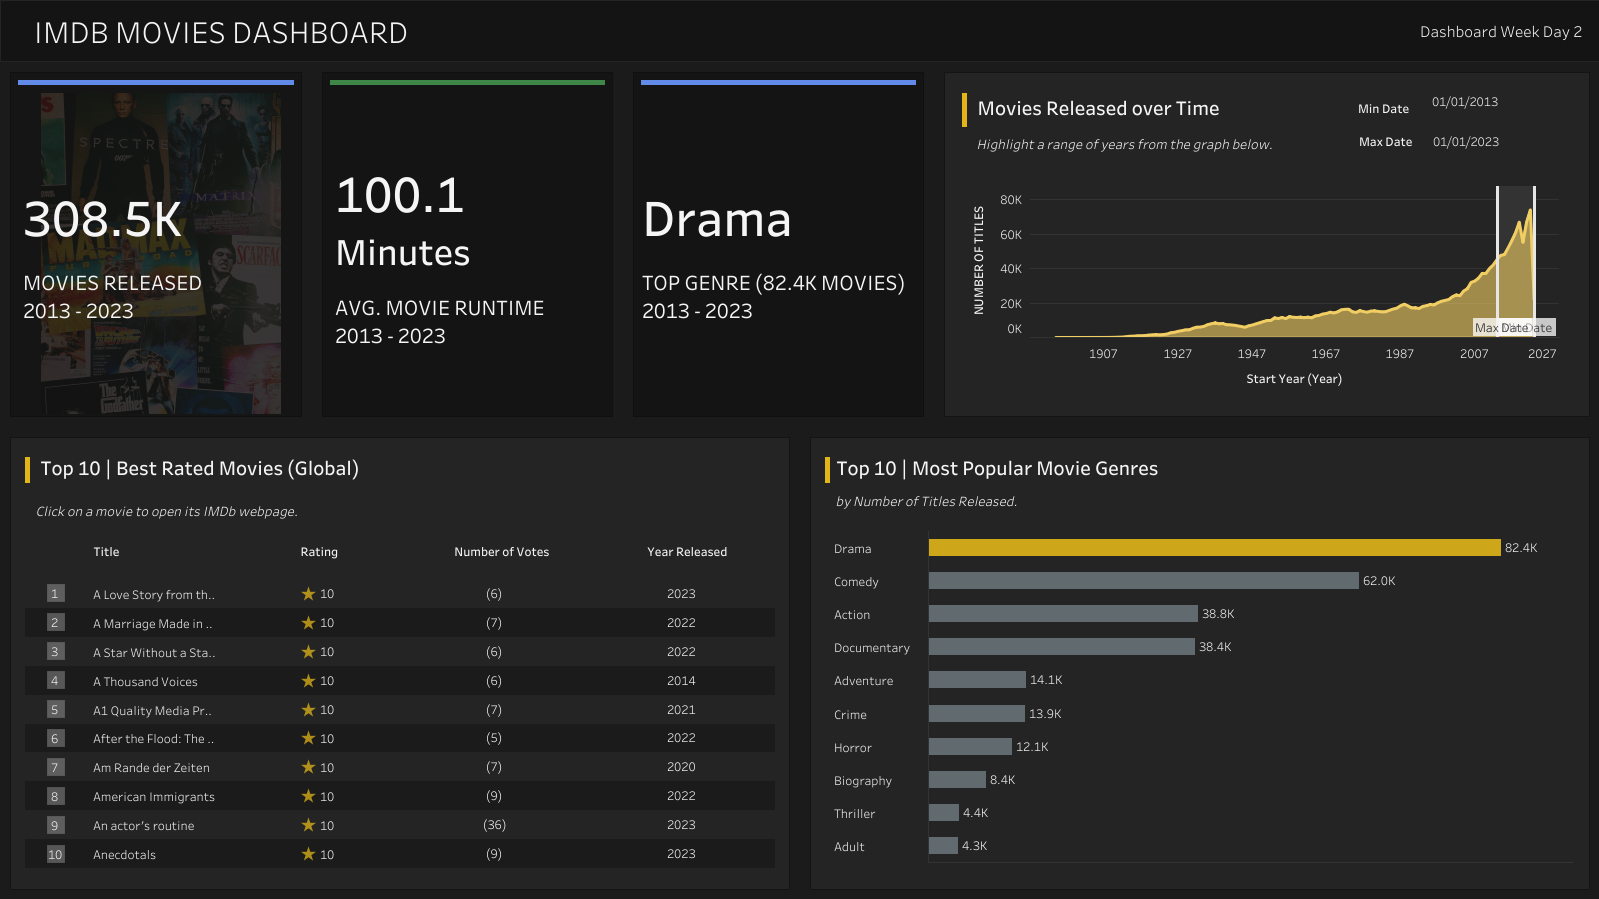
Once I had the data all sorted, I was ready to start building in Tableau Desktop. This was the fun part. As you can see, the design evolved slightly from the Exalidraw plan, but that's natural and part of the design process :)
IMDb Movies | Dashboard Week Day 2:

At the end of the day, I would say my dashboard was 85% complete - but I'm happy with it!
I wanted to add some background images behind the KPIs, so they would pop more. I only managed to do this for the first KPI so that's something I'll add on later.
Other things I'd like to adjust include:
- Fixing the table - instead of Top 10, do Top 50.
- Also I noticed if the ratings are all 10 - it orders them alphabetically. I think it would be more reliable to order them by "Number of Votes" in this case.
- Add Region Filter.
- Add some cool (royalty-free) images to the 2nd and 3rd KPIs.
Final Thoughts
I'm going to add a placeholder here for when I update my dashboard, so I can compare both versions :)
Updated Dashboard:
[Add pic here!]
And that's a wrap for Day 2 of Dashboard Week! I enjoyed today - wonder what Jenny has planned for tomorrow...
