


A quick blog post on a what Booleans are and how they're created in Tableau :)
What is a "Boolean"?
A boolean is any calculation that returns as True / False.
These are created when you include either a Comparison Operator or a Logical Operator within a calculation. You'll notice this little "T|F" symbol when a boolean is present in Tableau:


Comparison Operators
Examples of Comparison Operators in Tableau:
• Equal to (=)
• Not equal to (<>)
• Greater than (>)
• Greater than or equal to (>=)
• Less than (<)
• Less than or equal to (<=)

Logical Operators
Examples of Logical Operators in Tableau:
• AND
• OR
• NOT


Booleans and Colour
One cool way to use boolean calculations is to differentiate marks by colour.
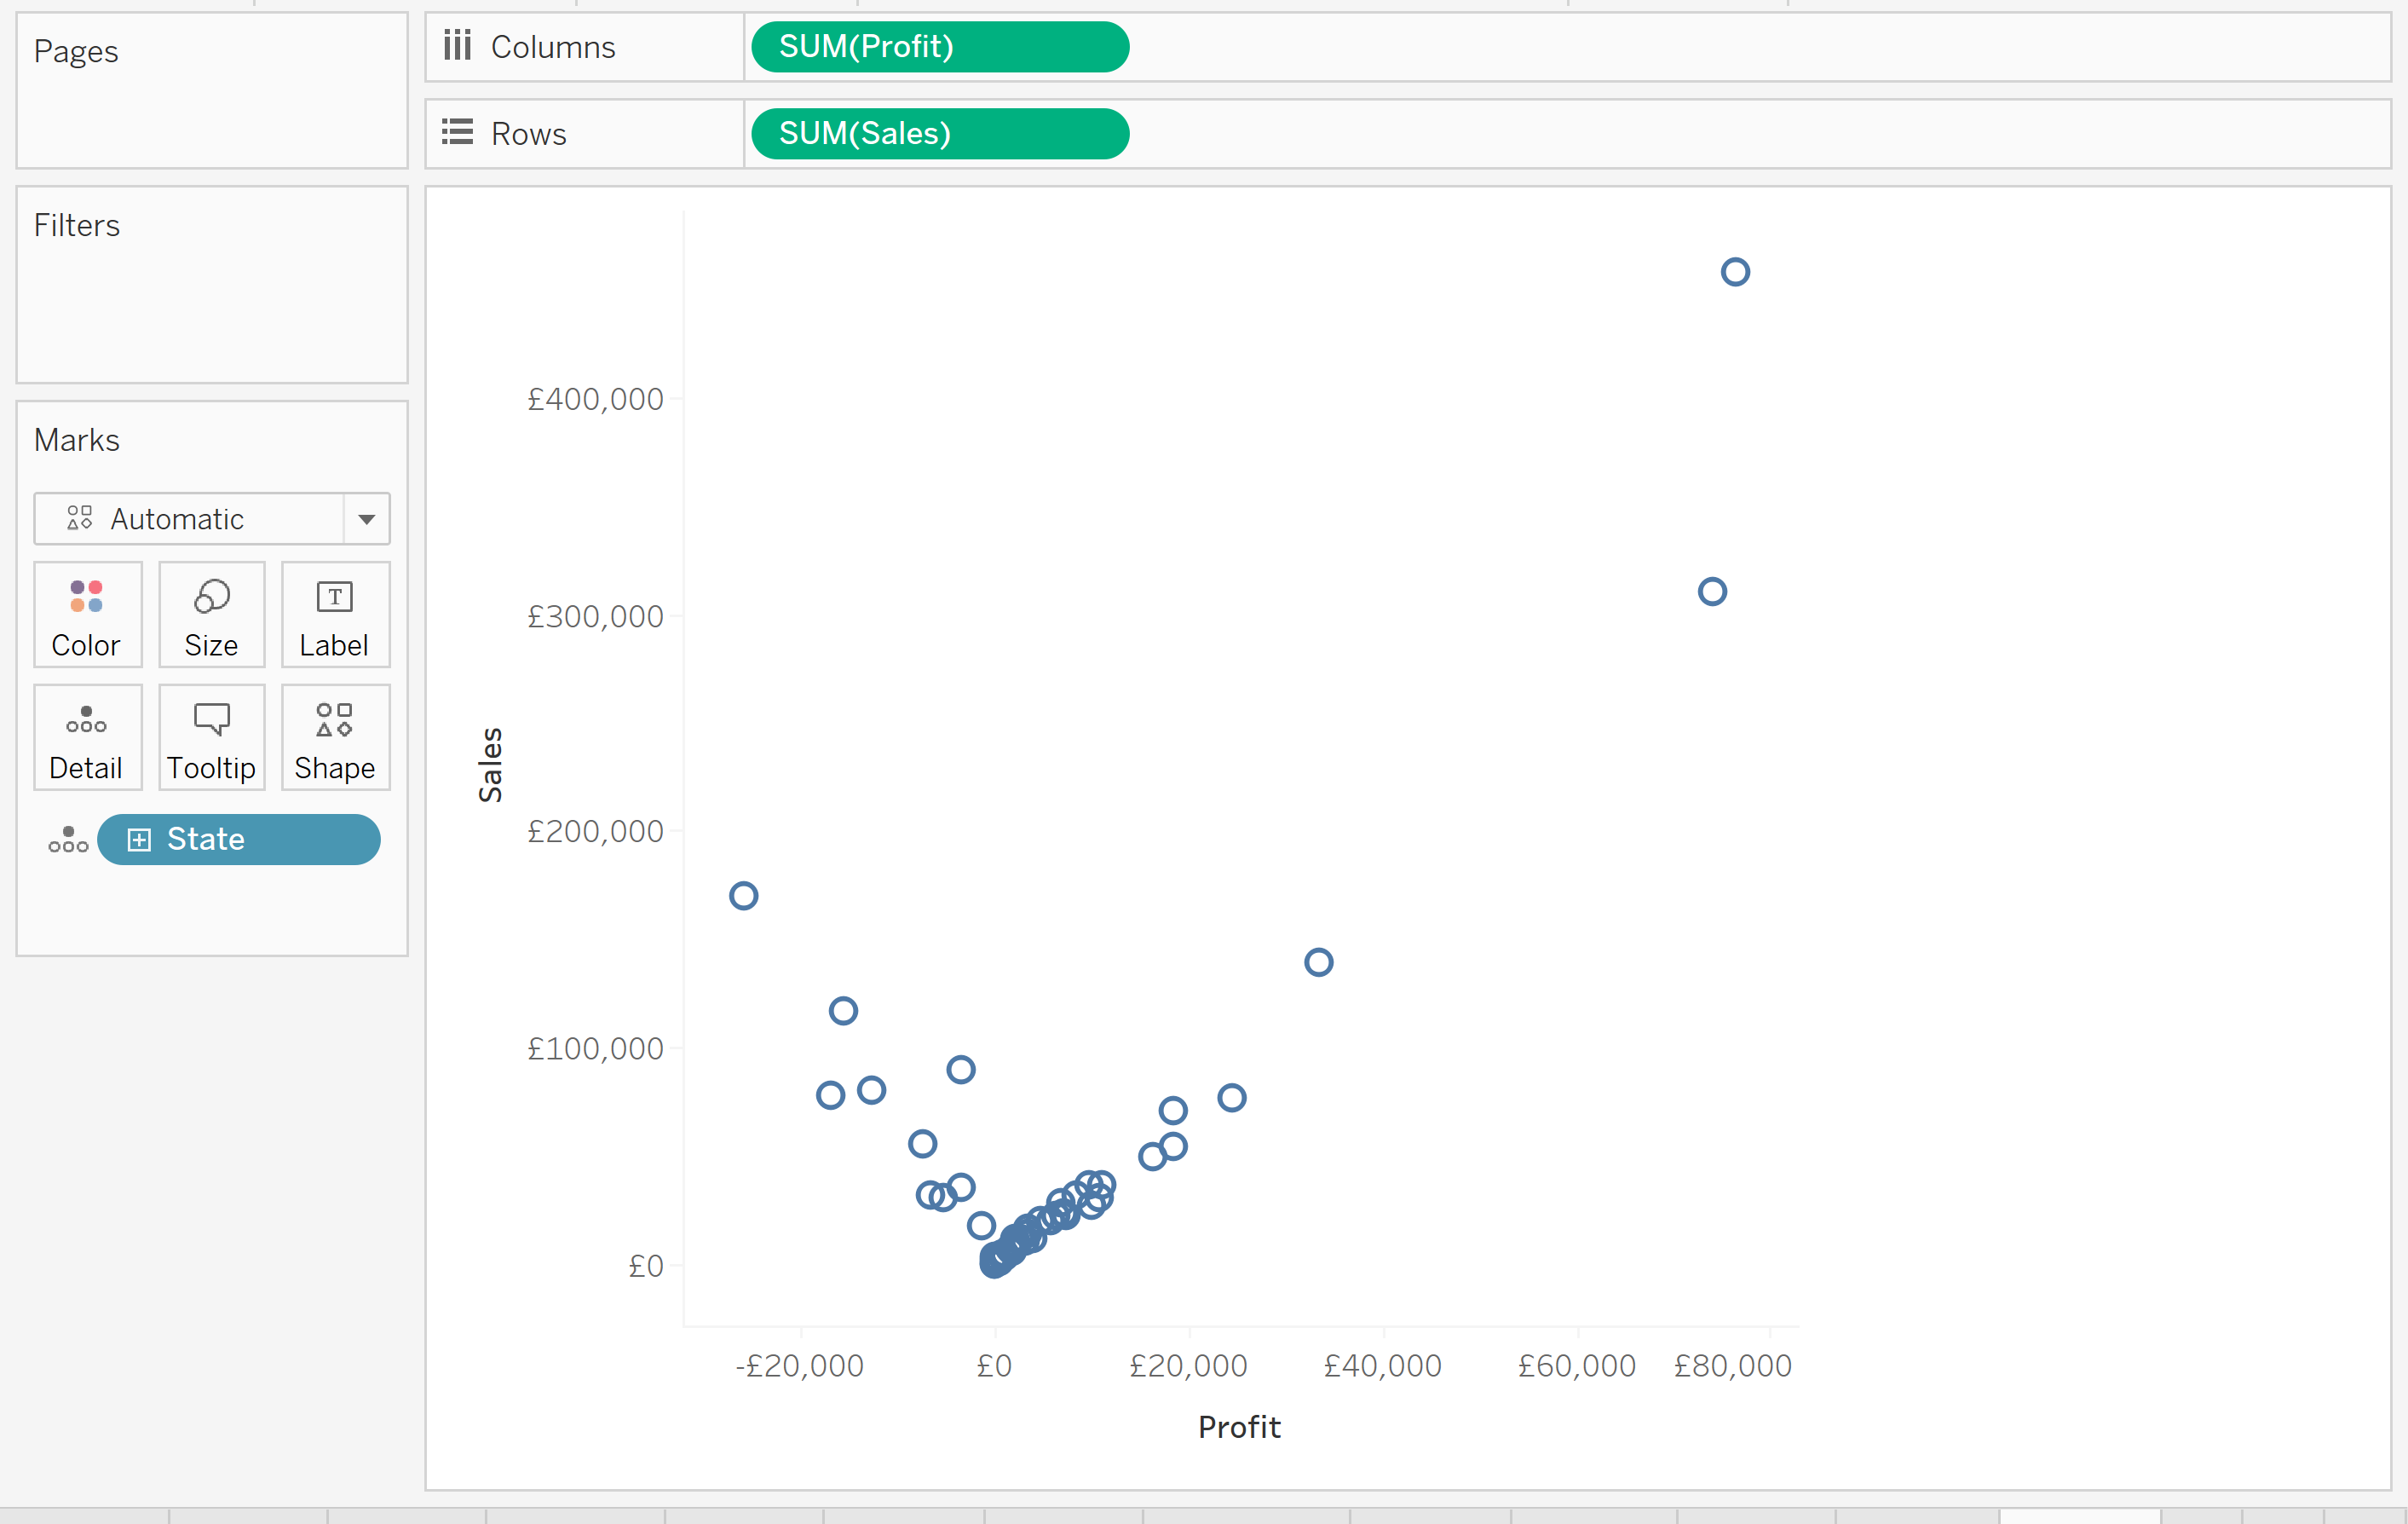
For example, let's say we've built a Sales vs. Profit scatterplot in Tableau, and added States to the details mark (using "Superstore" data):


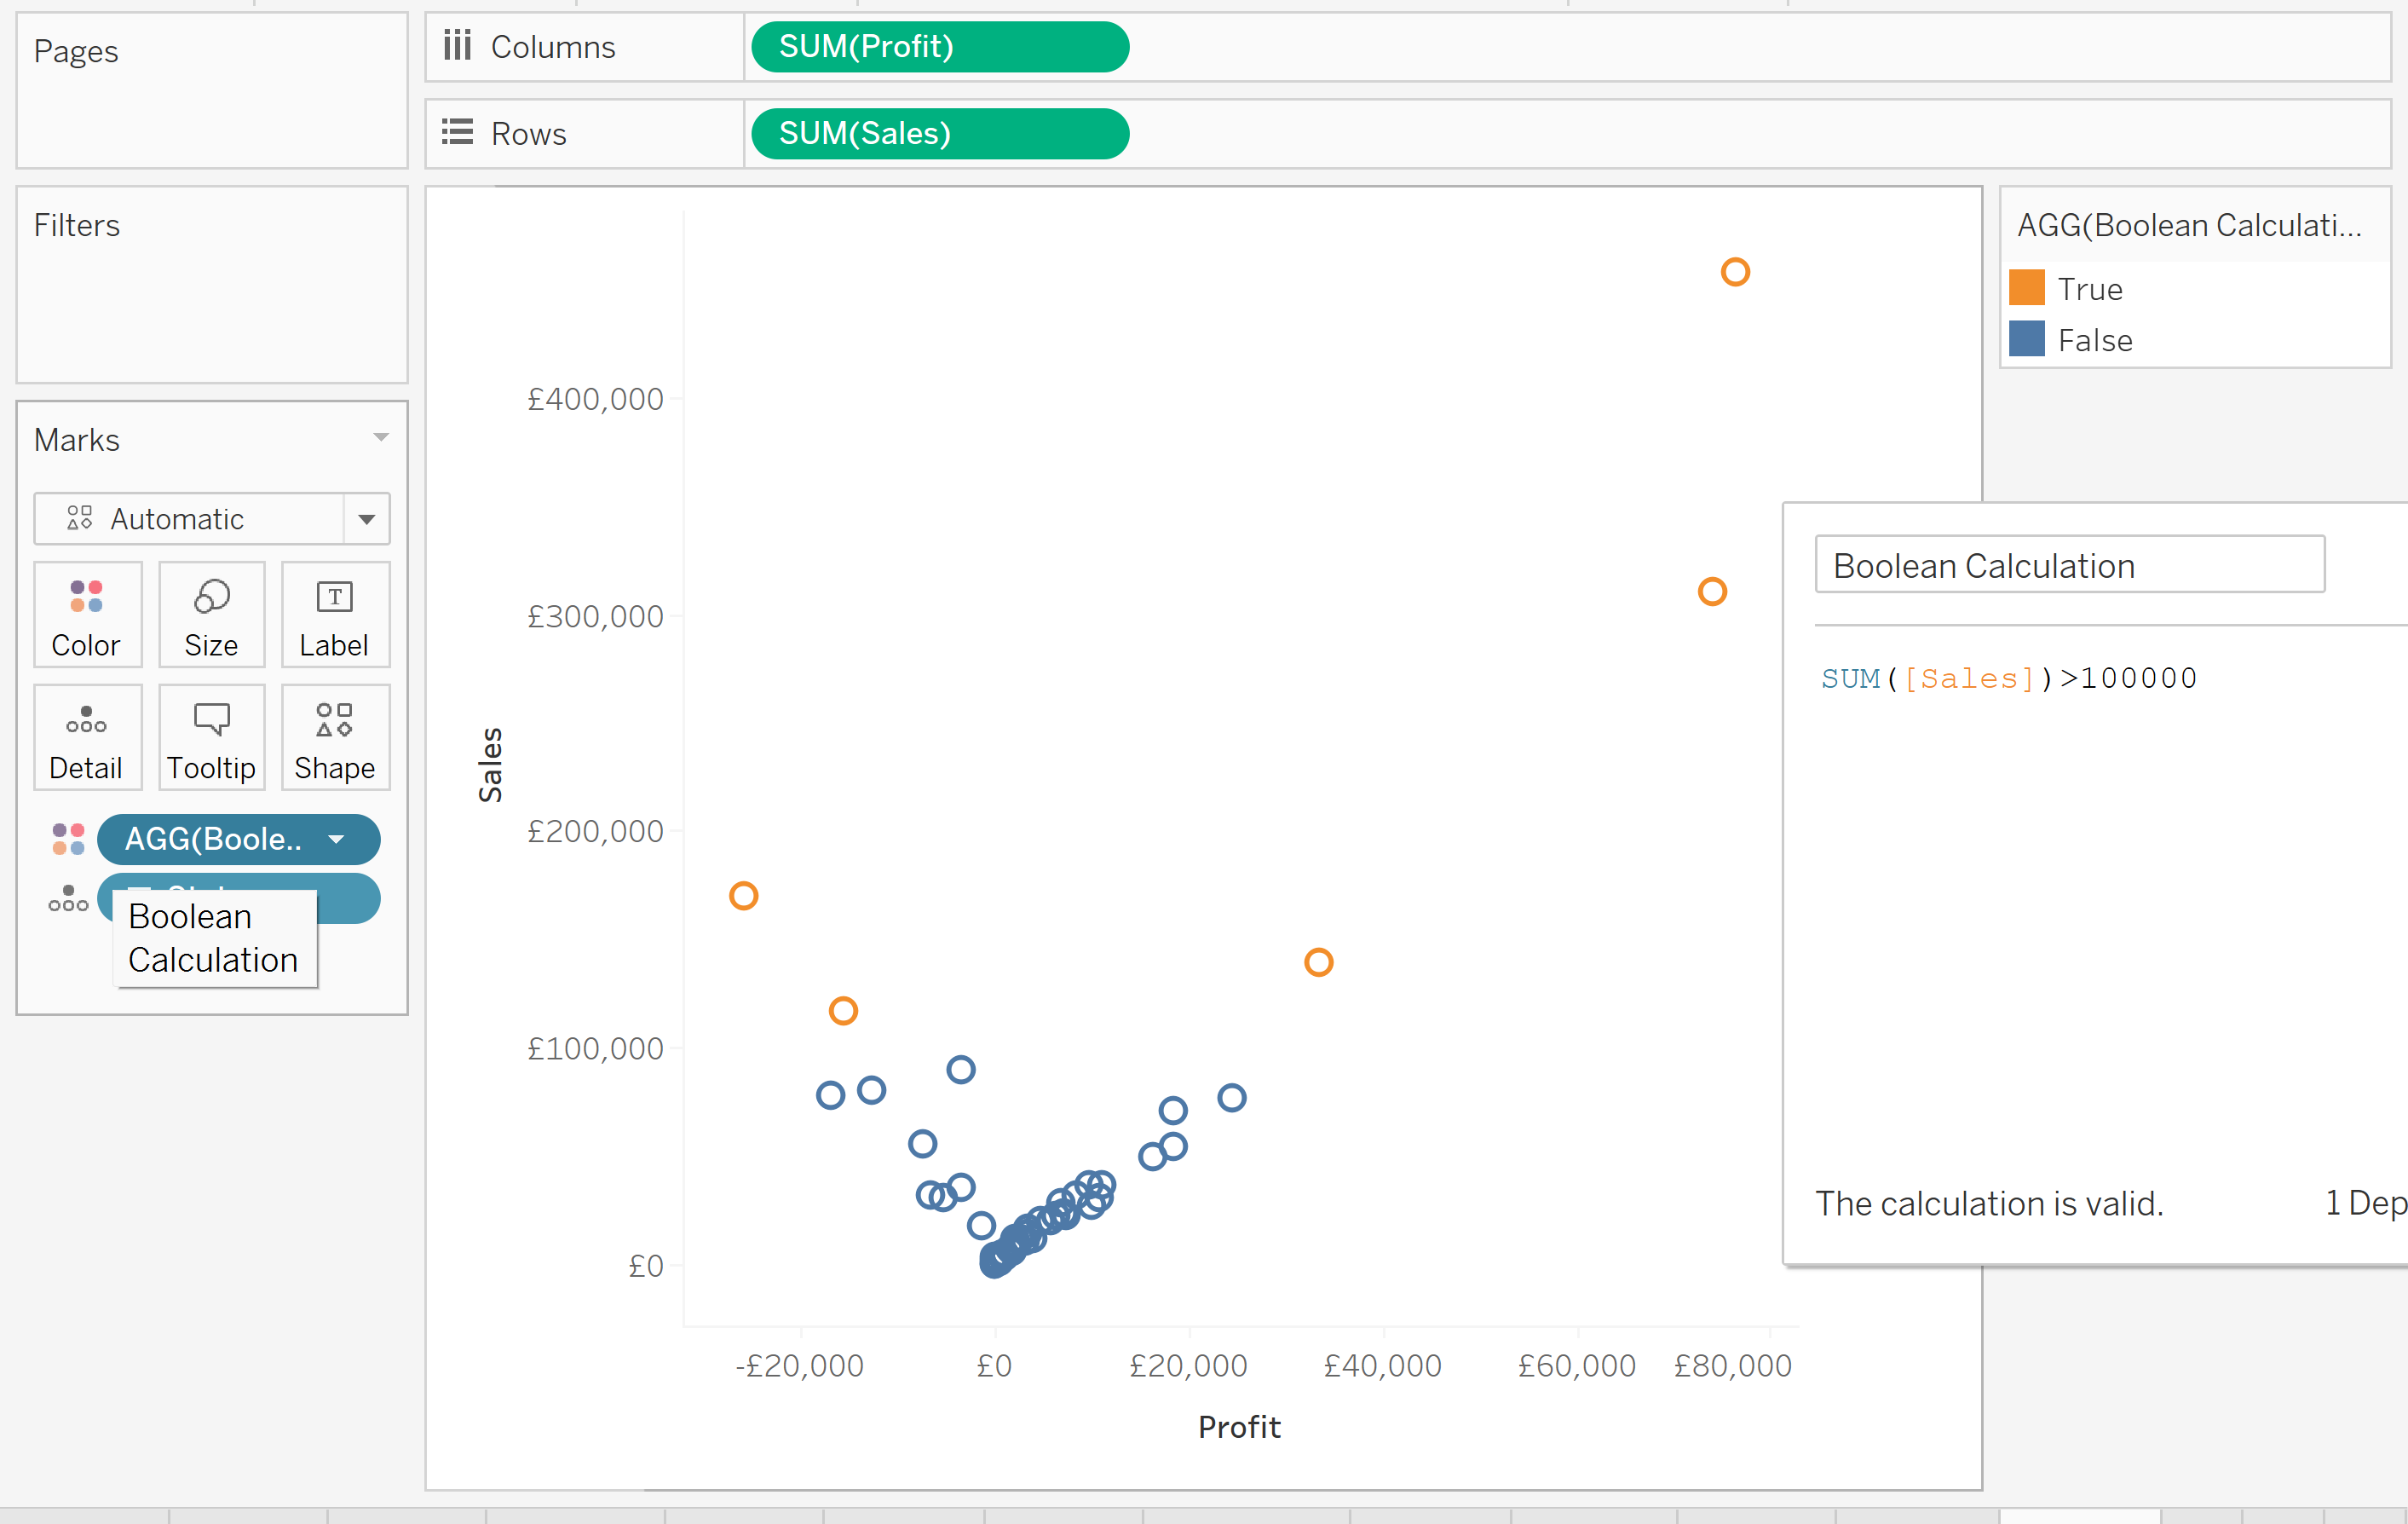
If we created the boolean calculation "SUM(Sales)>100000" and dragged it to Color, the States above £100,000 in Sales are computed as True, and can be assigned a particular colour. Likewise, States that are below this value will be computed as False.


And that's my short summary on booleans, hope this helps!