


What is Z score?
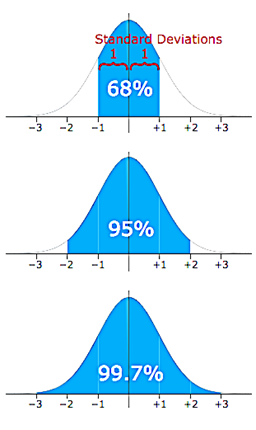
In simple terms, Z score is the number of standard deviations the data point is away from the mean. If a z-score is equal to 0, it is on the mean. A positive z-score indicates the raw score is higher than the mean average. For example, if a z-score is equal to +1, it is 1 standard deviation above the mean and vice versa.
What does it tell you?
The higher the Z-score, the further from the norm the data can be considered to be.
Why are Z scores so important?
It is useful to standardized the values (raw scores) of a normal distribution by converting them into z-scores because:
(a) it allows researchers to calculate the probability of a score occurring within a standard normal distribution;
(b) and enables us to compare two scores that are from different samples (which may have different means and standard deviations).
How do you calculate it?
The formula for calculating a z-score is is z = (x-μ)/σ, where x is the raw score, μ is the population mean, and σ is the population standard deviation.
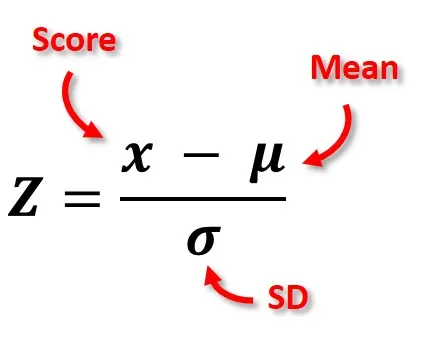
As the formula shows, the z-score is simply the raw score minus the population mean, divided by the population standard deviation.
Lets take an example:
Let’s use Z scores to analyze how a certain newborn’s weight compares to the mean weight of all babies.
For example, it’s well-documented that the weights of newborns are normally distributed with a mean of about 7.5 pounds and a standard deviation of 0.5 pounds.
If a certain newborn weights 7.7 pounds, we would calculate their z-score to be:
z = (x – μ) / σ
z = (7.7 – 7.5) / 0.5
z = 0.4
his means that this baby weighs 0.4 standard deviations above the mean.
How would you calculate this in Tableau?
Lets take another example - looking at Airbnb listings in London by Room Type and Boroughs.
For this example we will calculate the Z score for average price borough segregated by room type (Entire House/Apartment, Private Room, Shared Room).
Step 1: Drag Room Types to Column, AVG Price to Rows and Borough to Detail
Step 2: Change the Marks Card to Circle
Step 3: Create a calculated field for Z Score
Step 4:
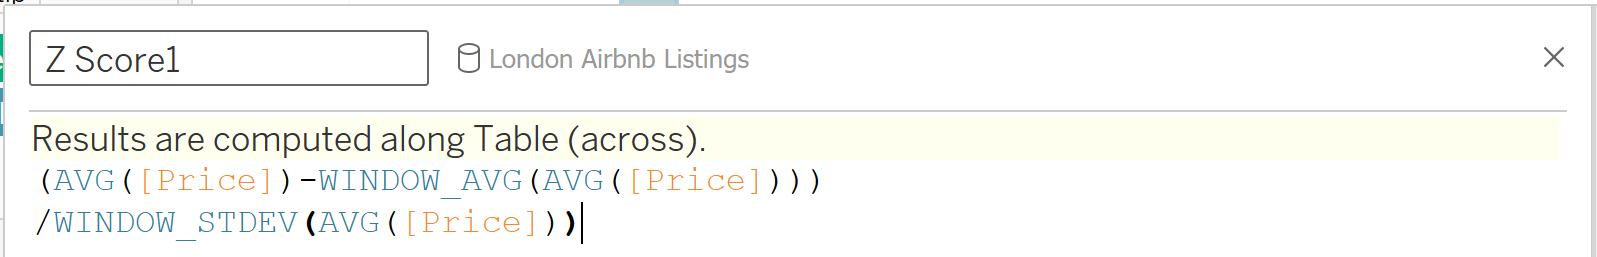
Step 4 (Explanation): The AVG(Price) here is the x value or the score minus the mean (which is calculated by the window average) all divided by the standard deviation of the score.
Step 5: Z score to colour
However, at the moment it currently calculating every room type for every borough. We want to calculate every borough for every room type. So it would repeat for room type, not borough.
Step 6: Go to Z score and edit table calculation and choose ‘Specific Dimensions’ - untick Room Type and Tick Borough.
Results:
- You can see two main outliers with a standard deviation of 3.3 and 4.3 which shows that it is outside 99.7% of our data