For my last and final day in training and dashboard week, we had a sleep analysis experiment to analyze which had around 450 subjects from a dataset from Kaggle.
As today we only have 3-4 hours to make an analysis dashboard, I needed to narrow my scope to be able to do a full analysis around 1 main aspect. I decided to analyse sleep schedules in gender - male and female. This dataset was fake and therefore the insights our cohort gained from this didn't have much logic behind it.
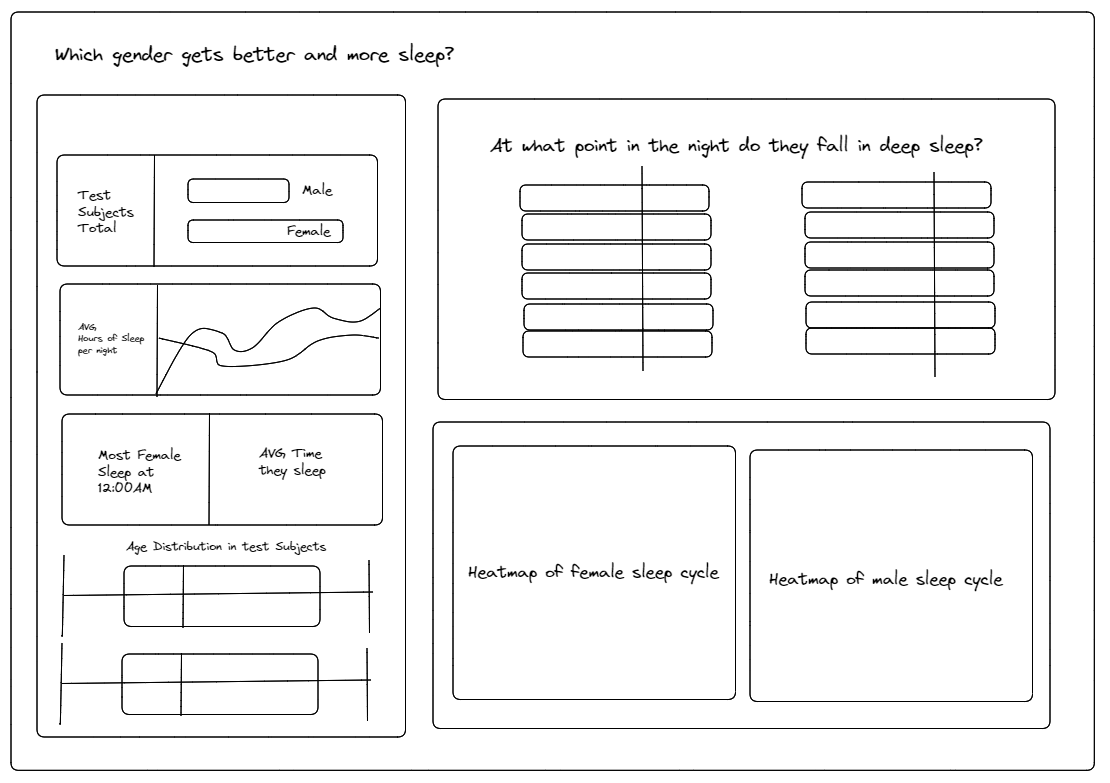
I started building my sketch for what my dashboard should look like where I wanted to show some of the experiment information. I started with KPIs about the experiment on the side as well information about the demographics of the experiment. Moreso wanted to look at how long it takes for different genders to fall into deep or REM sleep depending on bedtime. The heatmap will show the deep sleep cycles throughout the week to see if there was any correlation between weekday and deep sleep cycle.
My dashboard turned out like I had envisioned it however the bar chart couldve been visualized in a better way in order to make gender comparison a little easier. Moreso, the box and whisker plot was missing some context in terms of axis and the mode of time went to bed should've been a little clearer. I am happy with the way it turned out in the time allotted to us to make this and with more time I would've made the dashboard more interactive to be able to gain more insights.