I was actually quite excited to do a day in Power BI as I’ve been learning about it on Udemy and started getting the hang of it. However, the task was webscraping through Power BI which isn’t something I was taught or had learned.
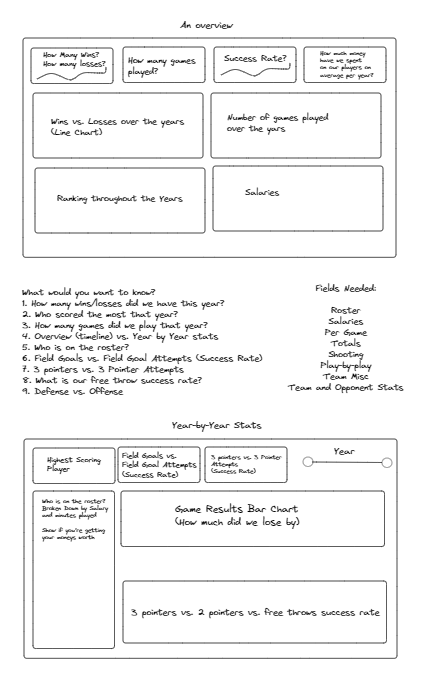
Bringing in tables from one URL was fine and straight forward, however, we had to bring in 5 years of data which was very computationally expensive for me. That was the trickiest part of today. It was a lot of waiting around and waiting for the data to query and to load. I was the only person that seemed to have this issue - any change I made it had to query and load all over again. This took me to at least 12:30 and I hadn’t started dashboarding. Luckily I had my scope and the angle in place and all I was doing was waiting for the data to load. Below is the idea and sketch I had in mind for this dashboard - one dashboard containing overview information about the Knicks and then a deep dive into the players over the 5 years.
Unfortunately, the data I brought in was too computationally expensive and time consuming that I had to get rid of 3 years worth of data to be able to make this more efficient. I was now comparing 2022 data and 2021 data of the New York Knicks.
I did a side by side comparison instead of across 2 dashboards to be able to truly be able to make comparisons quicker. All the charts and information I decided to put on the dashboard are insights I would like to see as a manager (hence the salary) and as a coach.
If I had more time, I would’ve love to be able to go further into player analysis as I was really intrigued with this dataset and its a shame it was a very heavy dataset.