The finale of this series is finally here! And yes there are a lot of changes from the Power Bi dashboard to this one in Tableau. I got offered feedback on the Power Bi one and I used that feedback to implement the changes you see in this Tableau dashboard.
One of the most notable changes is I included more years (2020–2025) in this dataset. I did in fact run into the problem of slowed performance, so I decided to sample the data at 10 million rows.
Now that that is out of the way, here is the thought process behind design choices, data anomalies, and technical intents that shaped the final visualisation.
KPIs
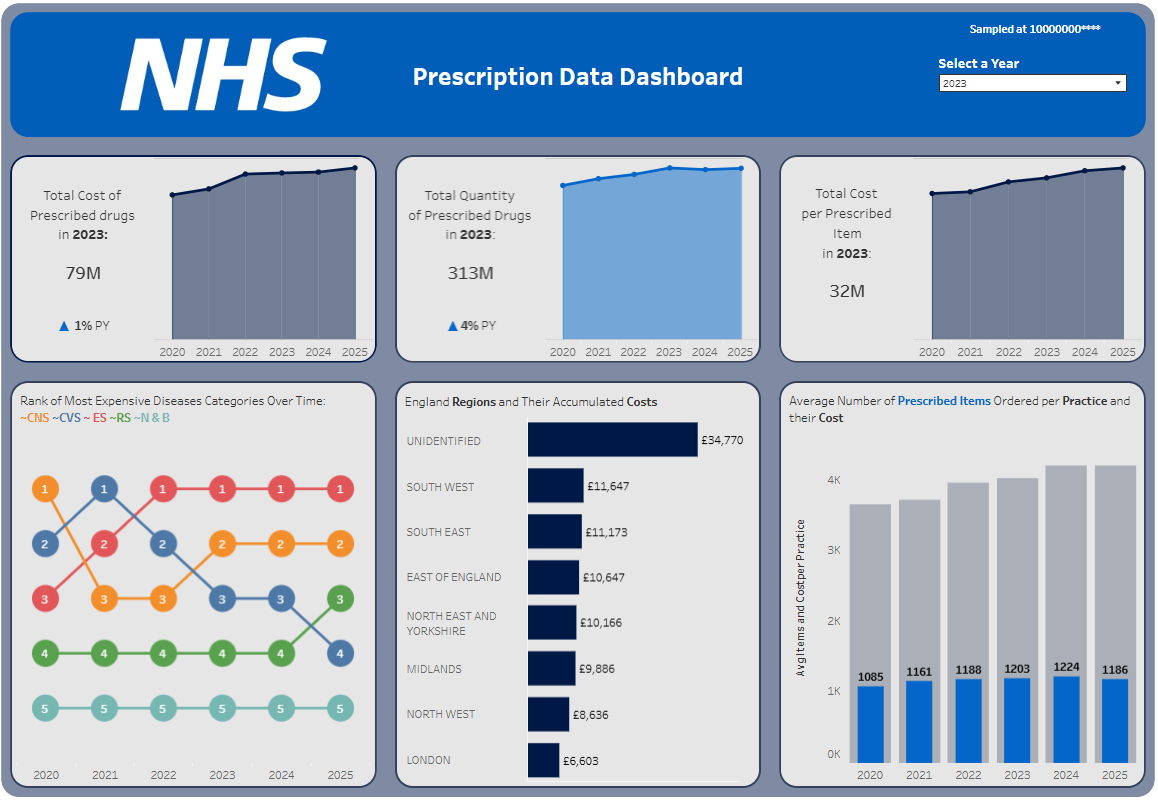
I kept 2 of the KPIs the same and for my final KPI, I decided it would be more useful to show the total cost per prescribed item and have a graph for average number of items ordered per practice.
I also paired these KPIs with context icons to show if there is an increase or decrease compared to previous year.
Lastly, each KPI card is paired with an area chart that will give the viewer historical context to the figures outlined.
Designing with Intent: Overlapping Bar Charts
One of the conscious visual choices I made on this dashboard can be seen in the bottom-right chart, titled "Average Number of Prescribed Items Ordered per Practice and their Cost."
Standard side-by-side bar charts can quickly clutter a dashboard, especially when trying to compare averages over a multi-year timeline. To solve this, I intentionally layered the charts:
- The Background (Grey Bars): Represent the total baseline scale of items/costs.
- The Foreground (Blue Bars & Labels): Intentionally labelled with the exact figures to immediately draw the viewer’s eye to the most critical operational metric on the page.
By limiting data labels to just the blue bars, the design guides the audience's attention straight to the core insight without overwhelming them with text.
Embracing the Reality of Source Data: The "Unidentified" Region
In the horizontal bar chart tracking England Regions and Their Accumulated Costs, you will notice that UNIDENTIFIED sits at the very top.
This is no fault of anyone, "Unidentified" is a literal, valid classification tracked at the source level. It could represent vital data points, such as cross-border dispensing, non-geographical cost centres or etc.
Spotting Macro Shifting Priorities with Bump Charts
The most exciting change in this dashboard is this Rank of Most Expensive Disease Categories Over Time bump chart.
I decided whilst the 100% stacked bar chart was a great visual to show the distribution of the different diseases, a bump chart is a more visual and attractive visualisation given the historical context added.
Key Takeaways for Your Next Dashboard
- Embrace the anomalies: If the raw data contains "Unidentified" buckets, use them as a talking point rather than hiding them.
- Use colour with purpose: Overlapping bars and selective labelling are powerful techniques to control where your audience looks first.
- Contextualise big numbers: A standalone "79M" means very little without an area chart to show where that number came from.
The final dashboard: