


So, you want to make a visualisation of the United States but you don't want to make a classic map? Let me introduce you to world of hex maps.
To start, we need to download a US shapefile or any shapefile of any country you want to visualise. They are pretty easy to find if you search up "your country + shape file". I found mine from this blog post by Joshua Milligan. https://vizpainter.com/hex-map-spatial-file/
Once it is downloaded, it will show up in your downloads as a folder. Keep it like this.
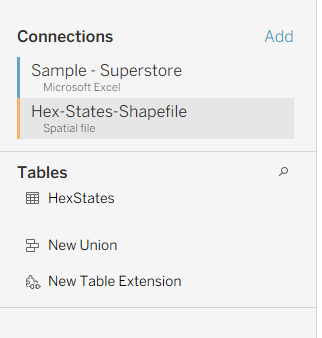
Open Tableau Desktop and connect to whatever file you are working with. For this example, I will be using Sample Superstore. Now you will also need to connect to this shapefile too. The easiest way to do this is to just click drag and drop the shapefile folder from your downloads and drop it straight into Tableau.
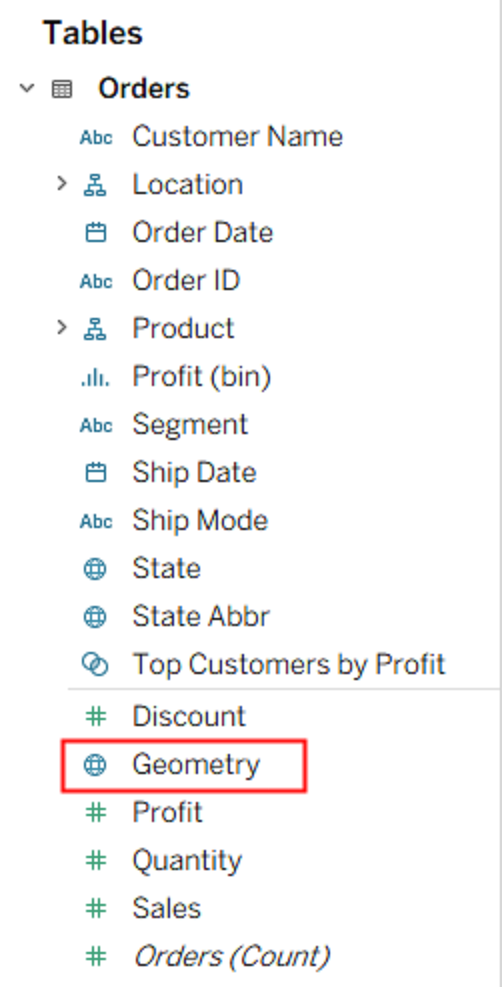
We will need a physical join to connect these 2 files. So first double click "Orders" from the data pane.
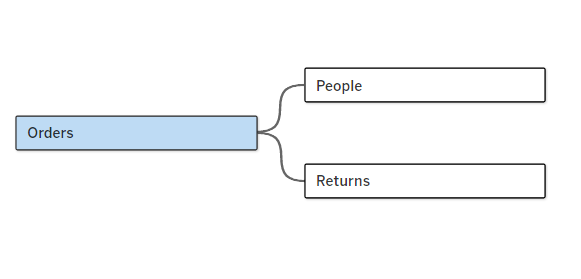
It should then look like this.

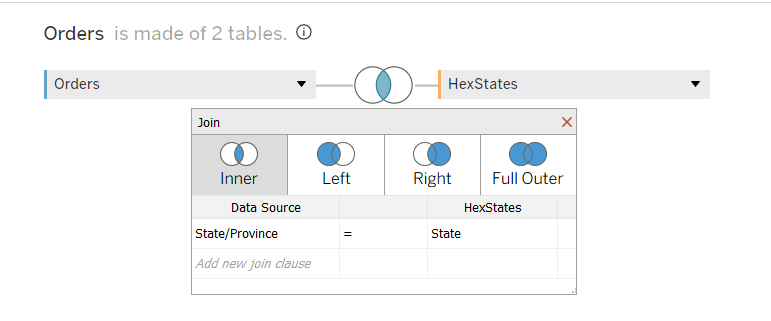
Click and drag "Hex-States-Shapefile" next to orders and set the join condition to inner join. Join on State/Province and State.
Perfect, now we can open a new sheet and get to building!
Double click "Geometry".
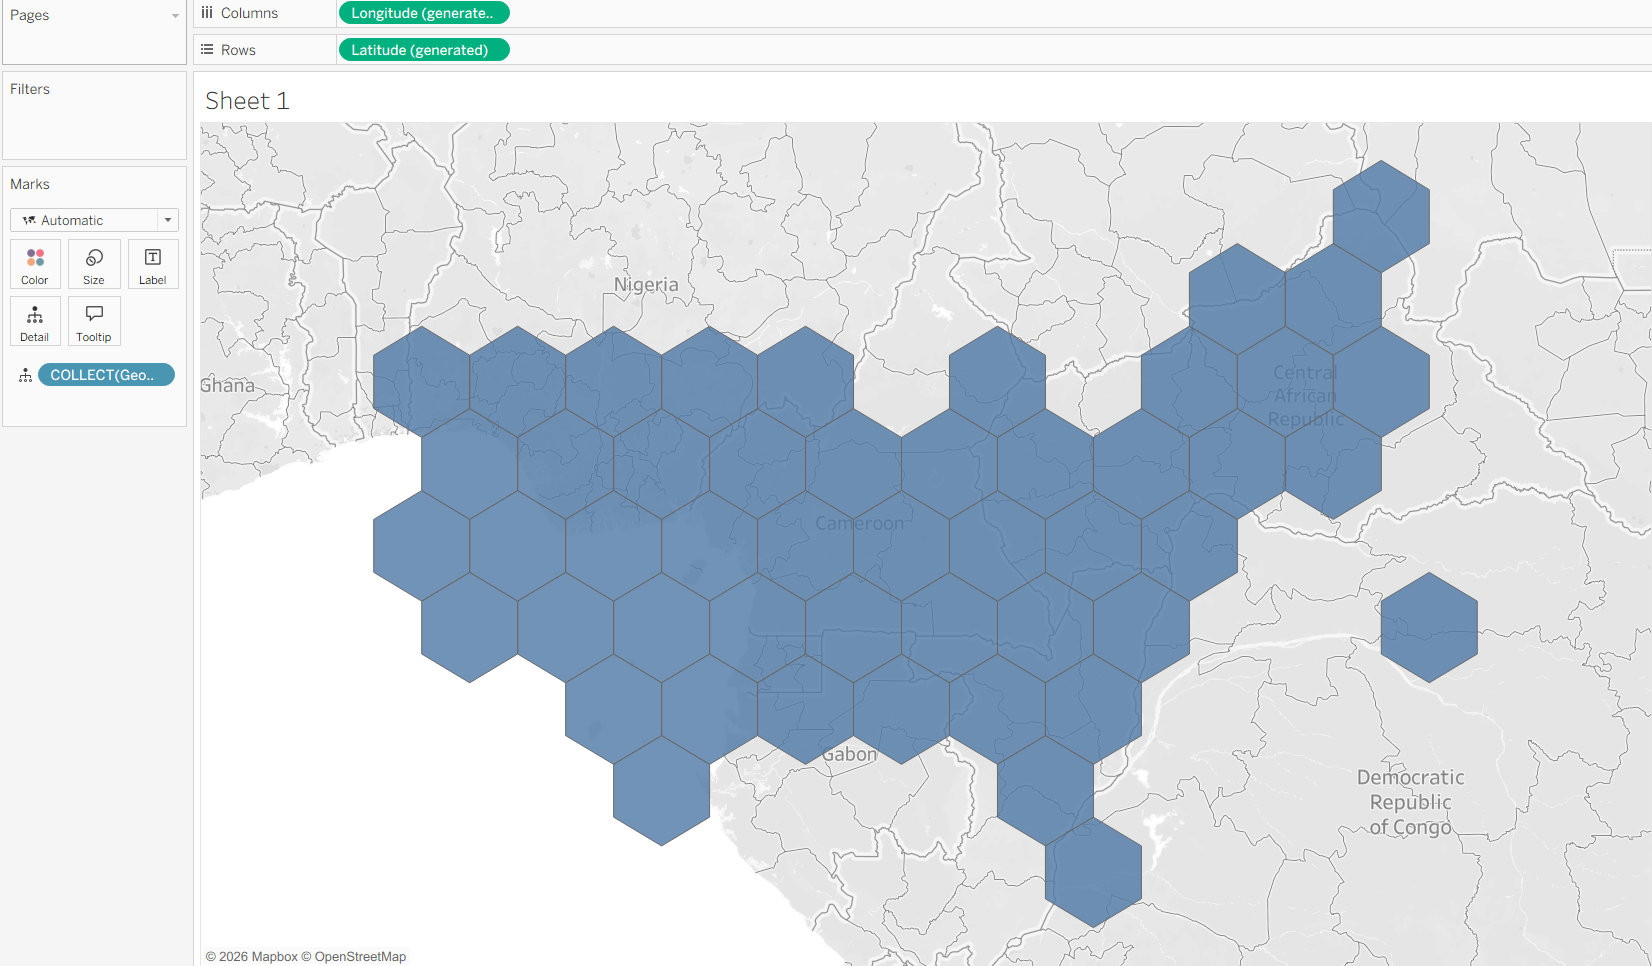
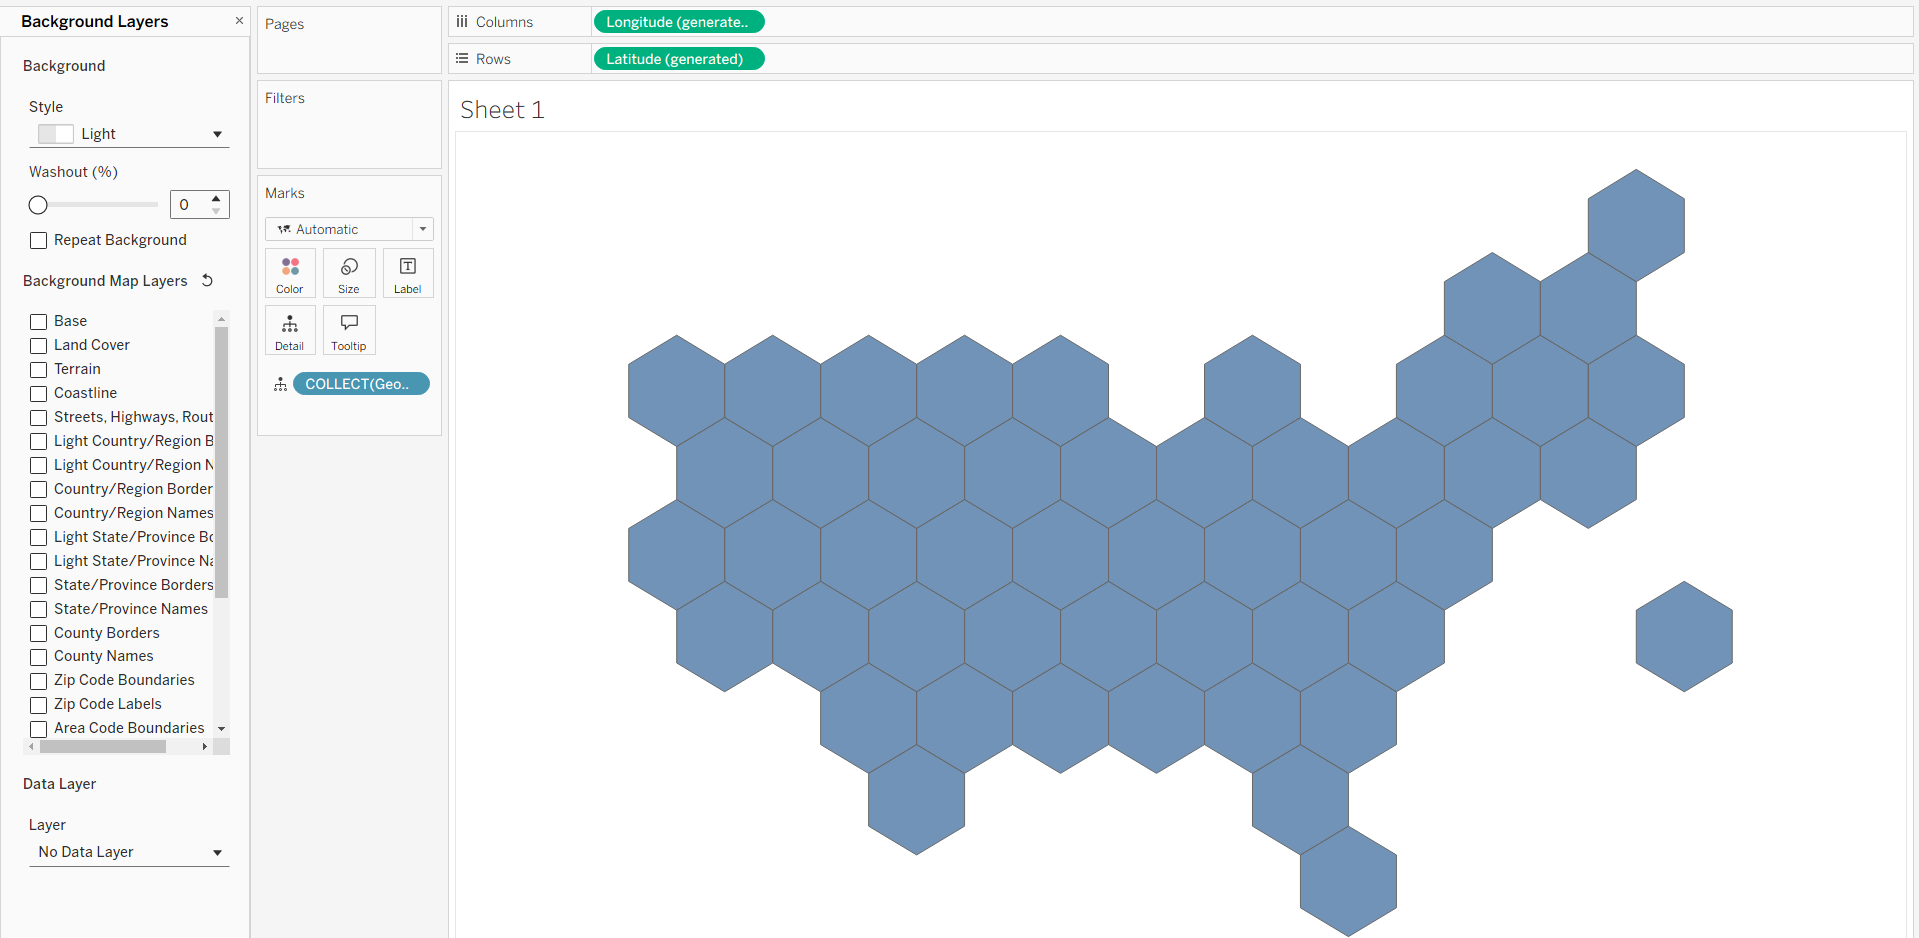
For some reason it plots the hex map over West-African Countries.
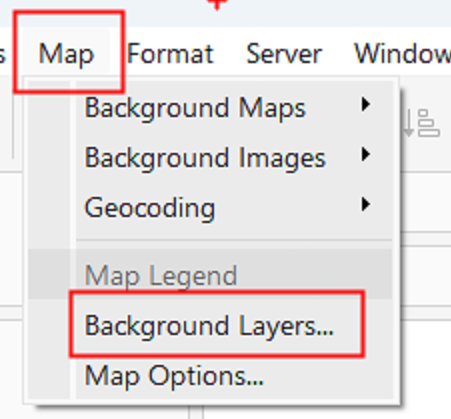
We can get rid of the background with the map --> background layers.
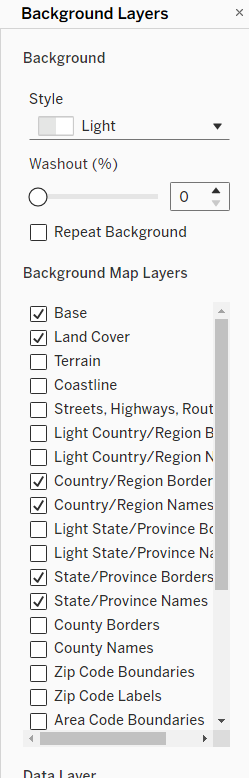
Untick everything.
Now put "State abbr" in text.
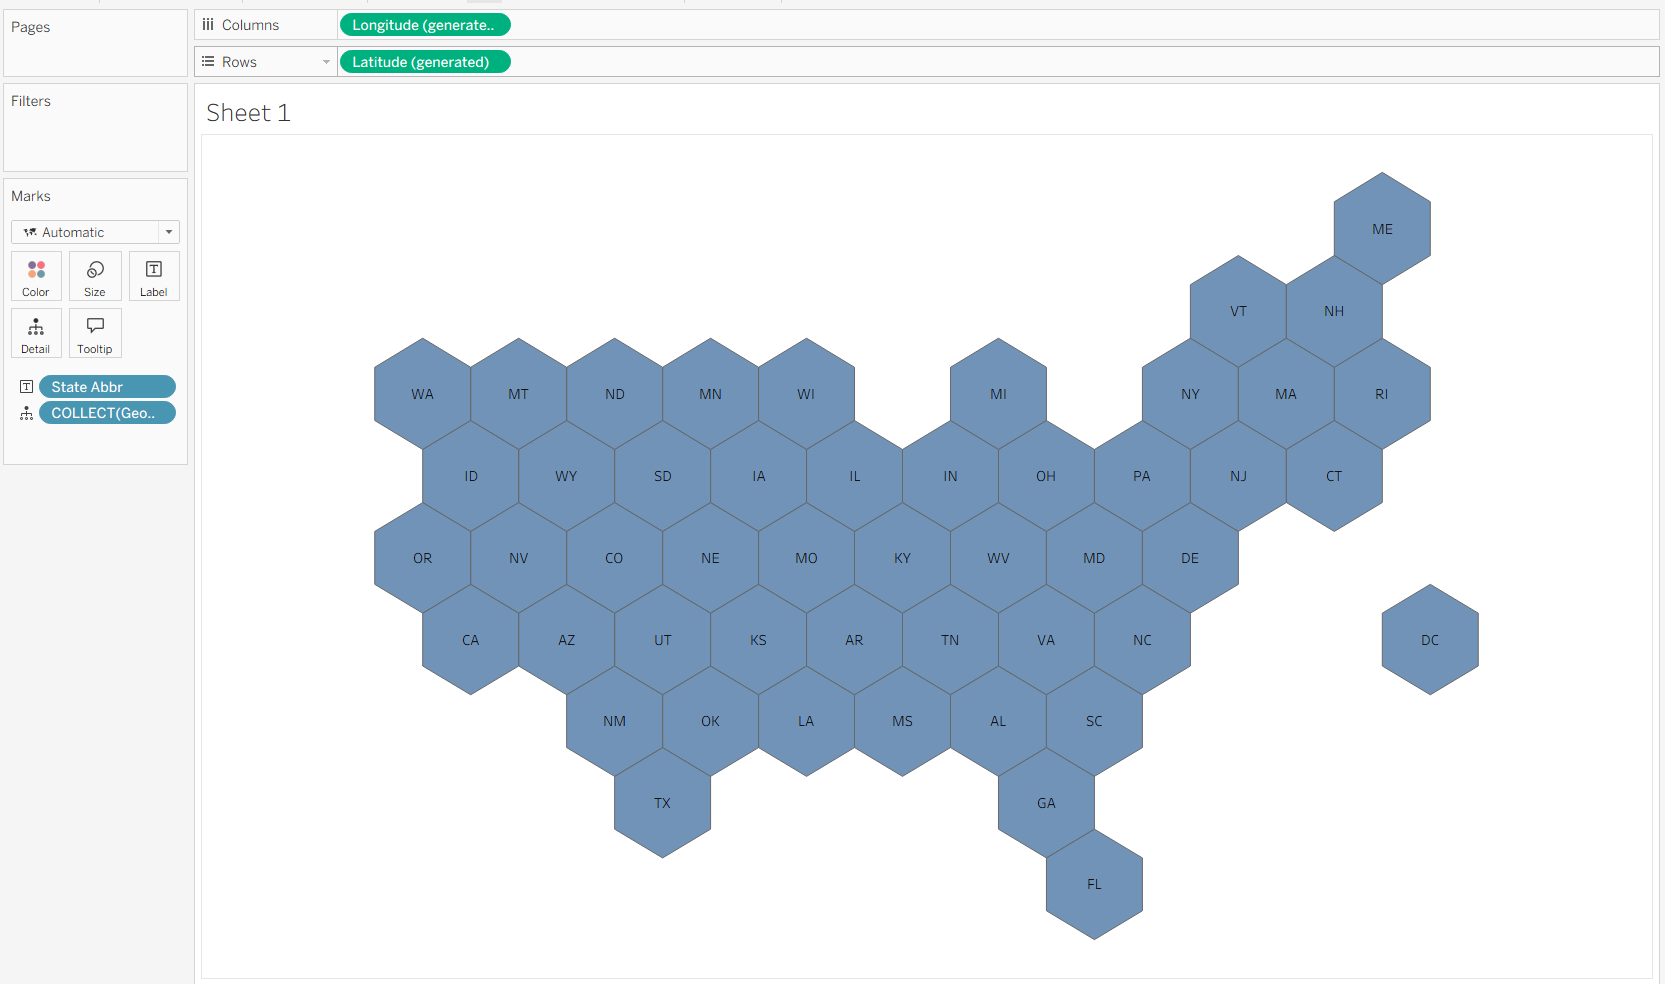
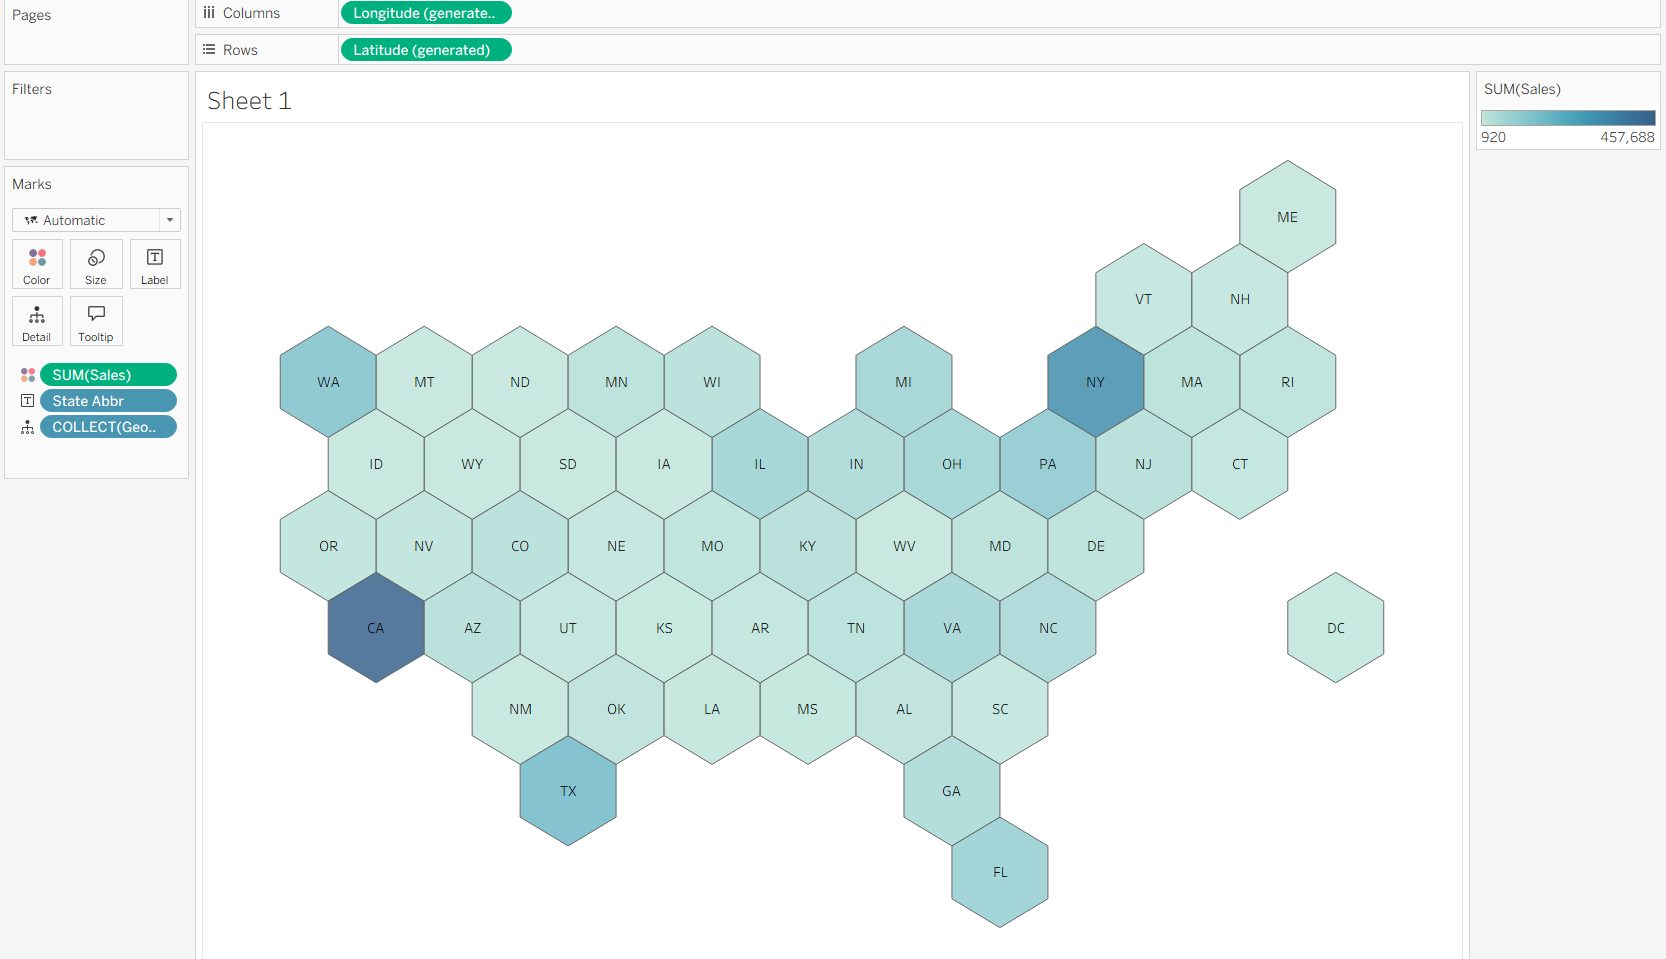
Now its basically ready to go. Feel free to put any metric on colour or format however you would like!
Happy Mapping!!