Another day another dashboard. For day 3 of dashboard week the task was to retrieve data via the Rick and Morty API . API's in general have been the constant bane of DS35 as we have gone through our training. A common theme we found was entering lessons and being asked 'have you had the session on api's yet?' to which we replied with a abrupt 'no'. Its a topic we've had to pick up by ourselves and today was another day of being thrown into the deep end.
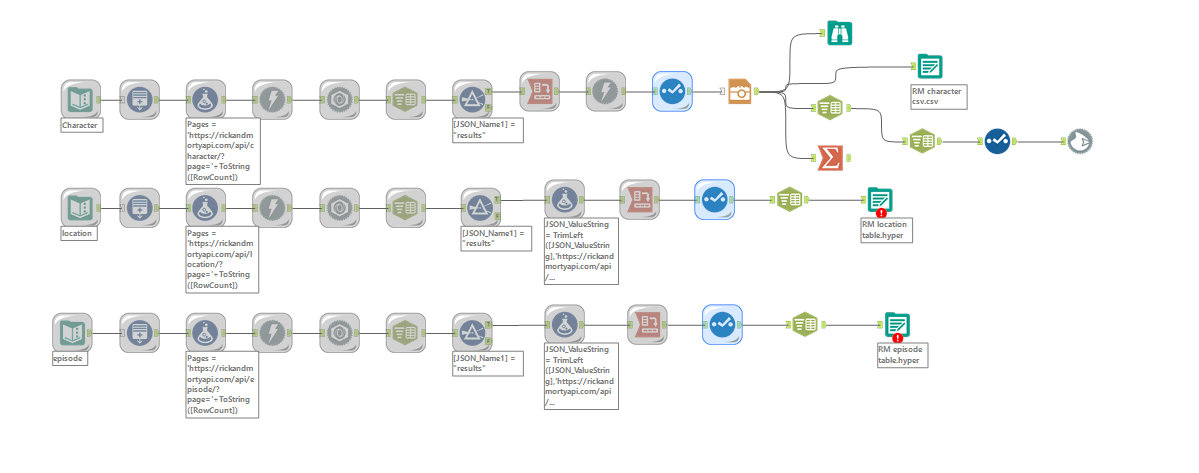
However, I will say the documentation about how to use the Rick and Morty API was certainly the nicest we've come across. So about the API: The Rick and Morty API is a great resource for fans of the show, as it allows users to access a wealth of information about the characters, episodes, and locations from the popular animated series. One way to access this data is by using Alteryx, below is a screenshot of my workflow:

To give you a brief overview of what i did in the workflow:
- I had one workflow each for each table: Character, location and episodes
- As the data was spread across multiple pages i had to use a process called pagination to obtain all the data - The input tool contains the url all the way up until the point the page number had to be typed in. The generate row tools creates row for every page while the formula tool merges the url with the page number.
- The download tool then downloads the data for each page while the json parse tool parse's it out.
- The rest of the flow tidies the downloaded data up into the tables I needed.

Once I had the 3 tables outputted as hyper files from Alteryx. I inputted the data into tableau desktop. I was then able to join the tables via relationships using the common id (the character id) with each other. This relationship can be seen above.
The above part of the task took the better part of the day not leaving much room for dashboard creation. However I can definitely say I'm glad to have done it as I've come away with a better understanding of API's.
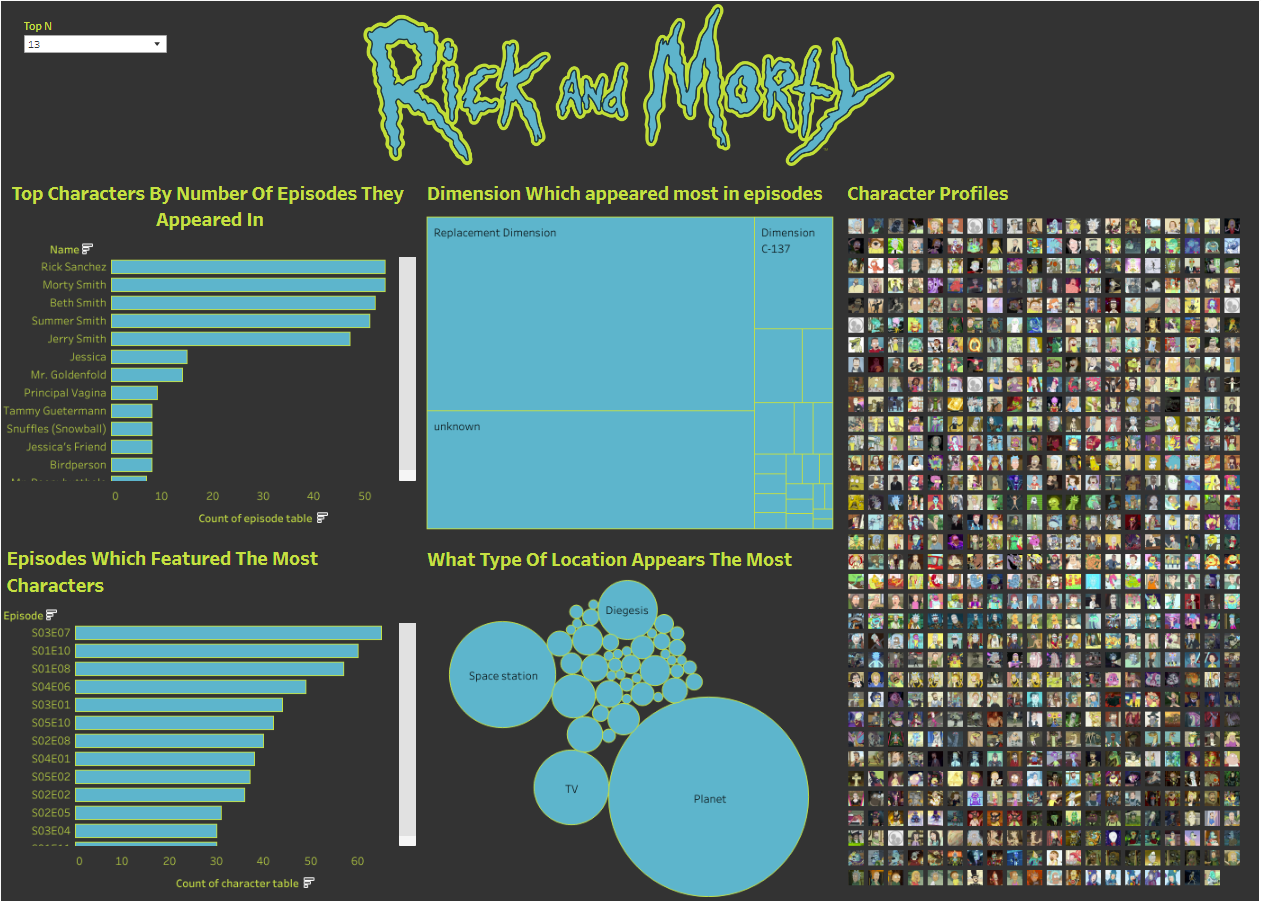
With the little time I had left I did manage to create a quick dashboard. Would've definitely wanted to do much more but given the time constraints as well as other hiccups I'm proud of what I was able to achieve.
Here's my dashboard below:

