So it really shouldn't come as a surprise anymore but every now and then, the data school really loves to throw you a curveball just to see how you will deal with it. Today was no different, we started the day (after having completed our accessibility training the day before) expecting to come in and have to actually start building dashboards in earnest today with new and scary datasets.
As we waited for the brief and spent the time thinking about all the different tableau skills we'd learned and have to put to use today what do you know turns out we're not building in tableau; a software we had learned in depth for more than 4 months now. we were using PowerBI a software we had a whole 1 day of training on!
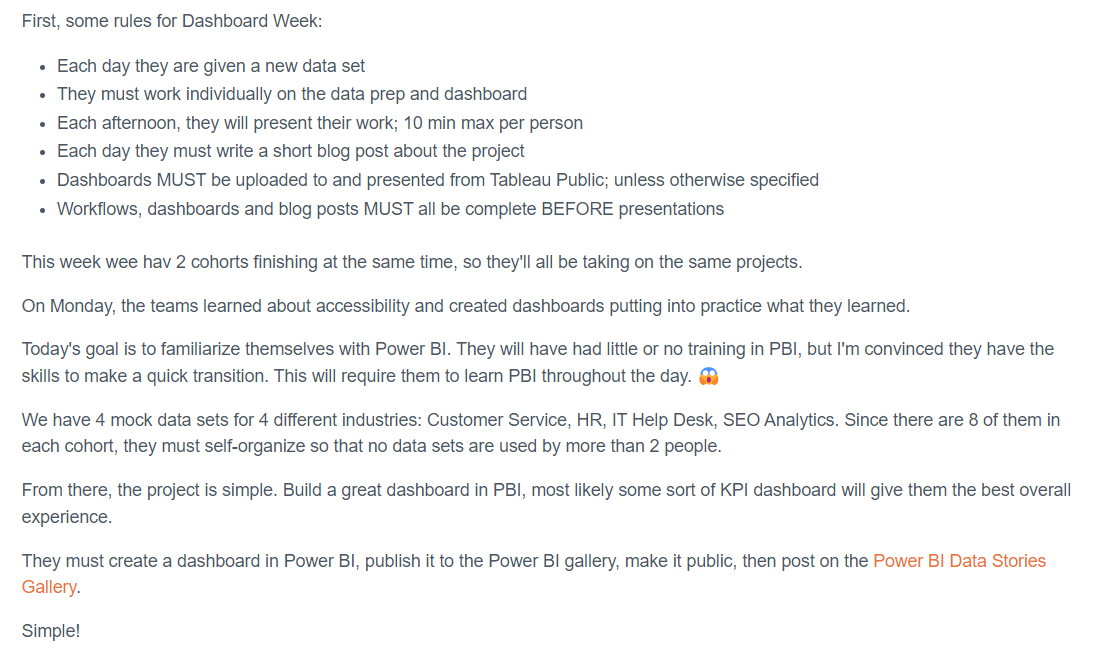
Heres a look at Andy's blog detailing the brief:
Admittedly the fact that we were buildings on a software we were unfamiliar with was somewhat comforting in the sense that if it was bad hey at least we had an excuse right?
Here was my process for building the dashboard:
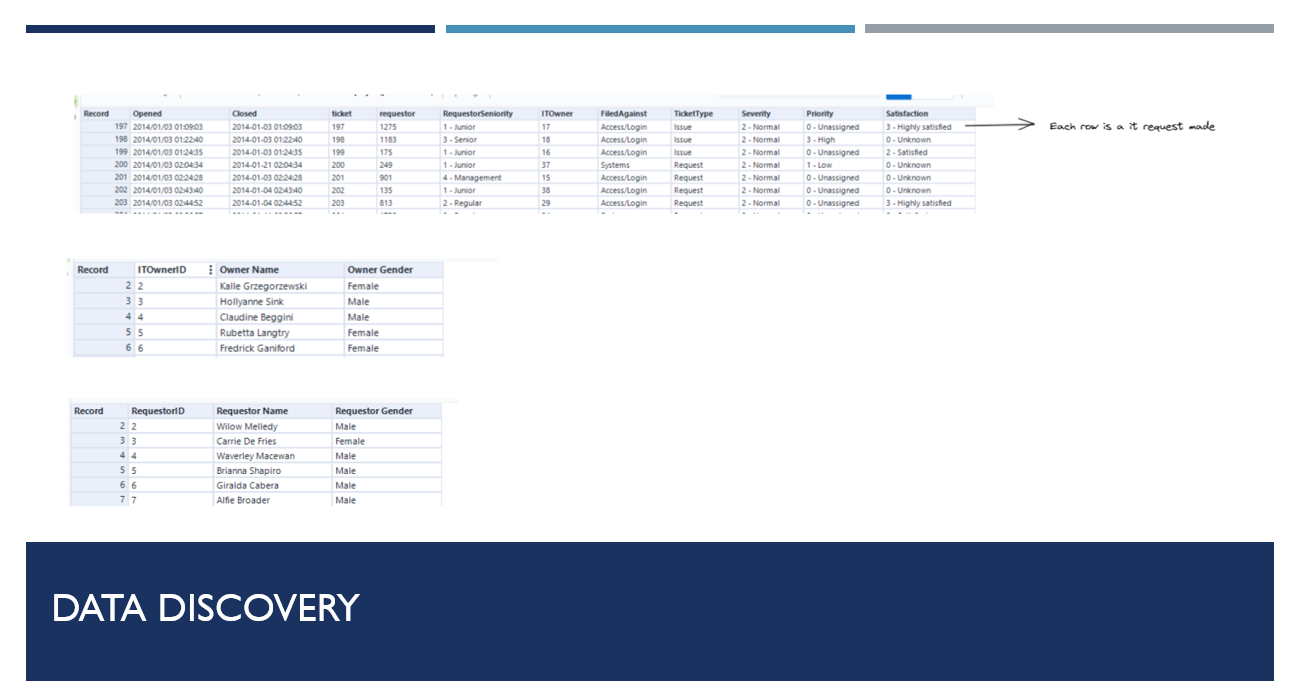
The data was pretty straight forward thankfully so didn't have to spend a huge amount of time trying to understand it.
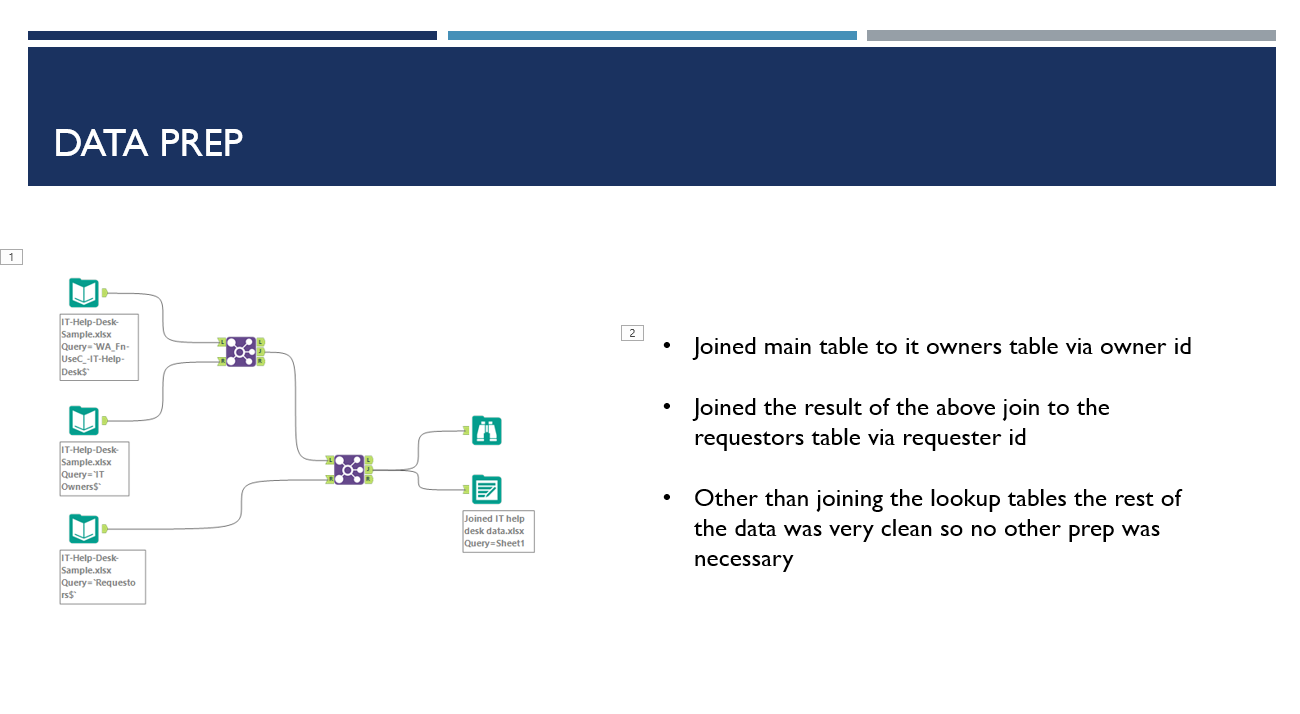
Again the prep was pretty simple just had to join the graphs to create a table with the other 2 lookup tables.
I then spent some time on both tableau public and the powerbi gallery looking for some inspiration which i certainly found. I wont share any pictures for copyright purposes etc.
Once I had an idea of what I wanted to do I went ahead and started creating my graphs. This wasn't as difficult as i thought it would be but i did hit a few bumps on the road when i tried to do some calculations. I spent some time banging my head against the wall and trying to google solutions until I realized what I was doing wrong and from then on it was plain sailing again.
After having created my graph I decided since I had more time then I thought I would have I would make a sketch of how I wanted to lay out my dashboard and make a background for it on PowerPoint:
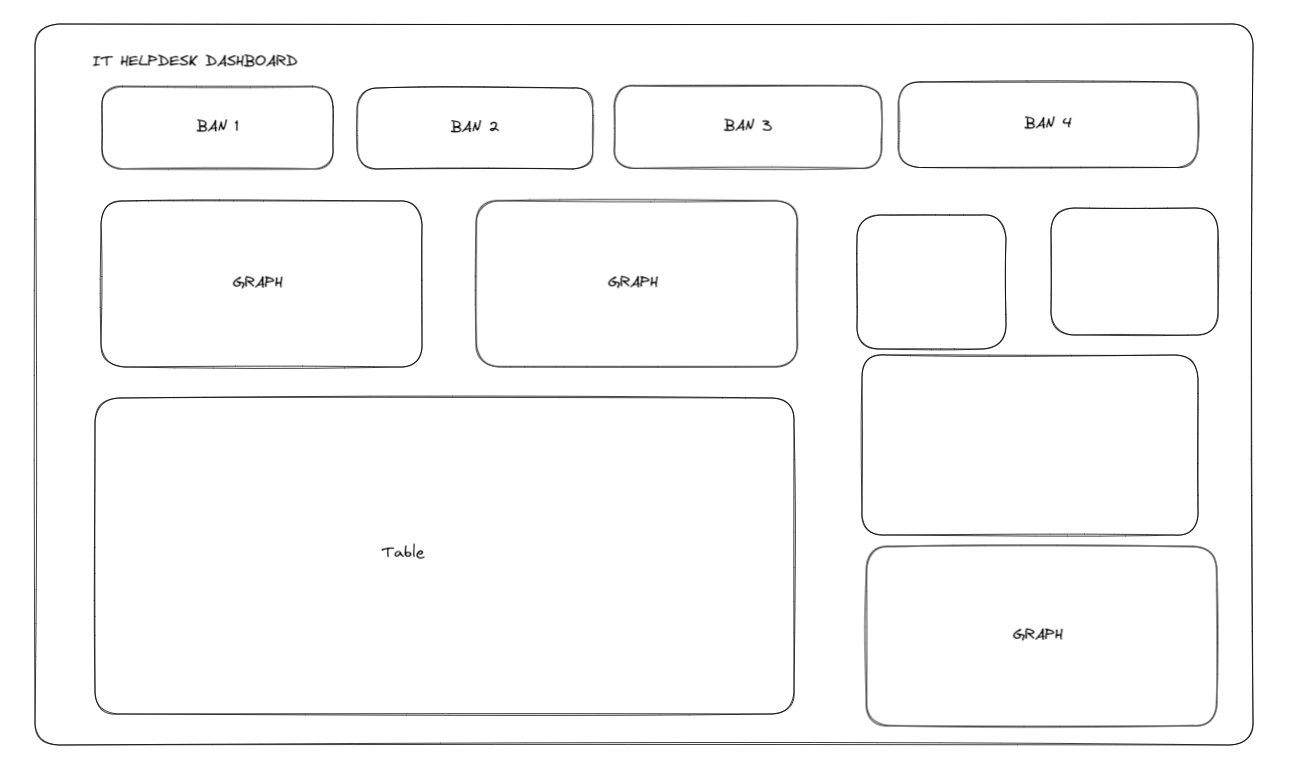

After that it was just the simple matter of formatting my dashboard and uploading it to the gallery.
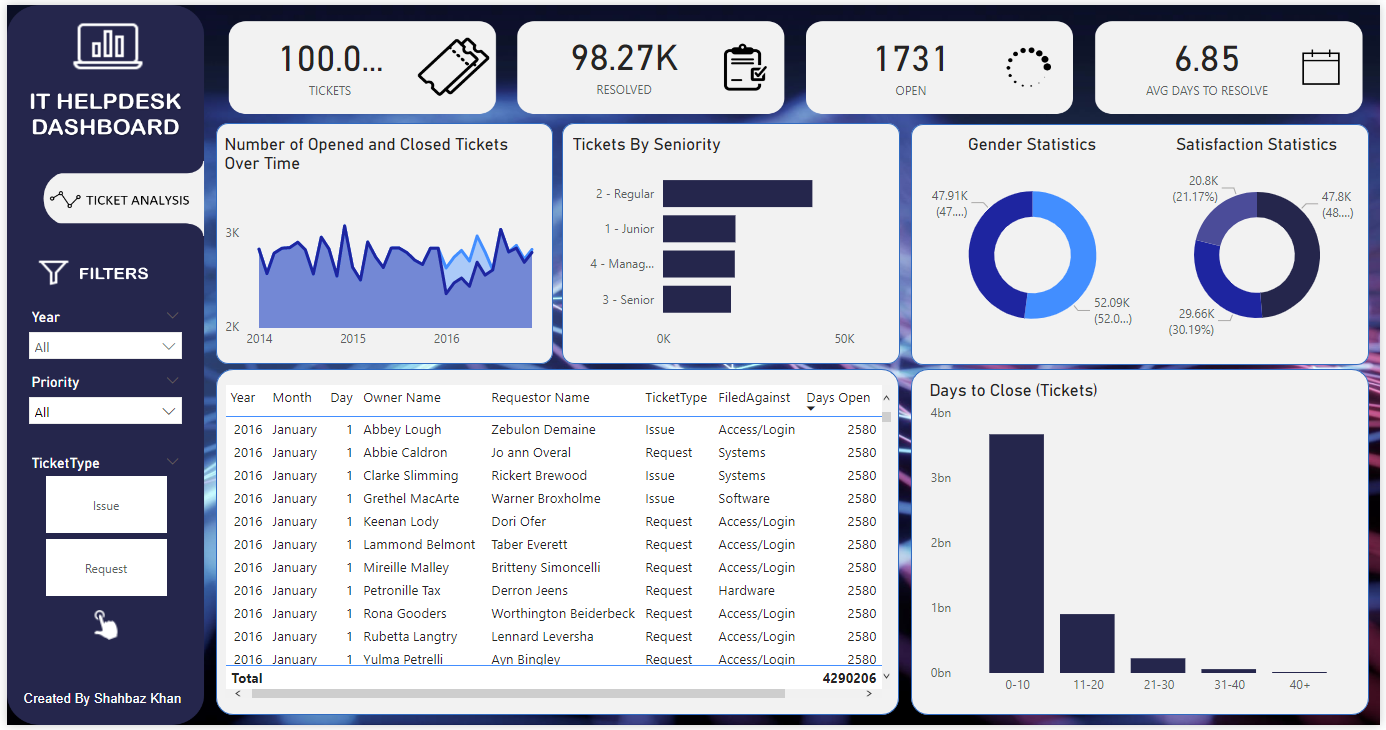
Here is my final dashboard:
