


Definition: Level of Detail (LOD) expressions allow to perform to show visualizations at a different granularity that what is currently shown. They provide the flexibility to bind a calculation to a specific dimension, in order for you to look at a broader total or a more granular level.
Fixed LOD
What is a Fixed LOD?
A Fixed LOD expression computes a value using specific dimensions without reference to the dimensions in the view. It locks the calcualtionto a specific level of granularity, ensuring the number remains constant regardless of how much you drill down or filter your data.
Superstore Scenario
Using the Superstore EU dataset, let's create a visual that shows the total sales for each category, even if we are afterwards looking at individual cities:
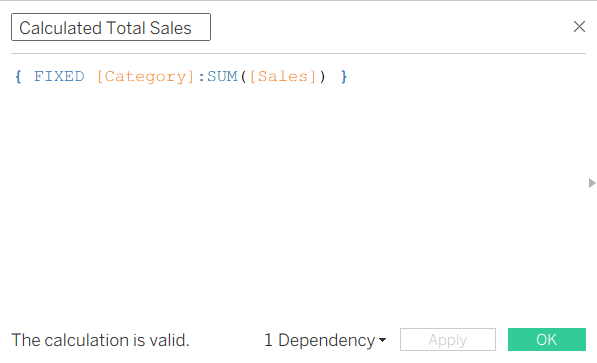
- Create a Calculated Field and Name it 'Category Total Sales'.
- Enter the Formula: { FIXED [Category] : SUM([Sales]) }
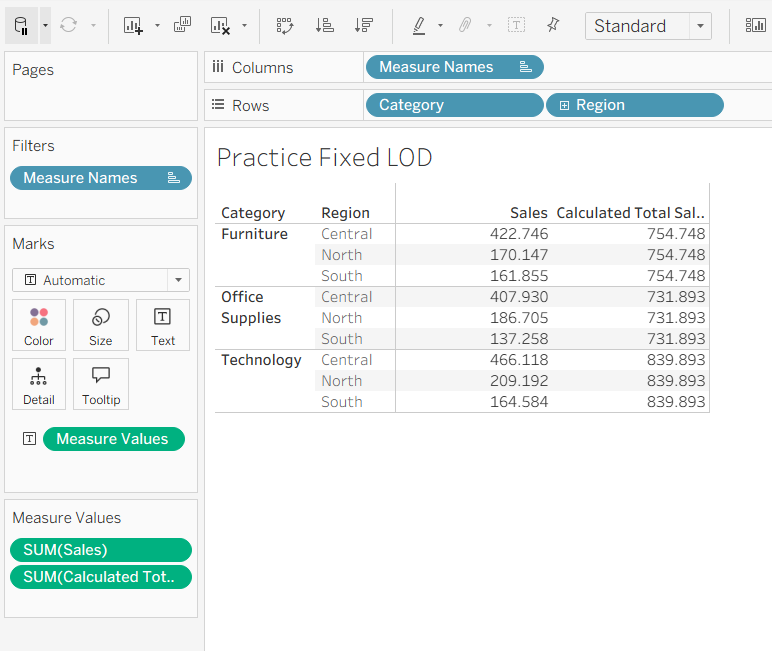
- Drag 'Category' and 'Region' to the Rows shelf.
- Drag the 'Sales' measure to Text.
- Drag your new 'Category Total Sales' measure into the table visual.
- You will notice that while the standard 'SUM(Sales)' changes for every 'Region', your 'Category Total Sales' repeats the same large number for every row within that category.
- Remove 'Region' from the rows. Even if we add 'Segment', that fixed value stays the same specified to 'Category' level.
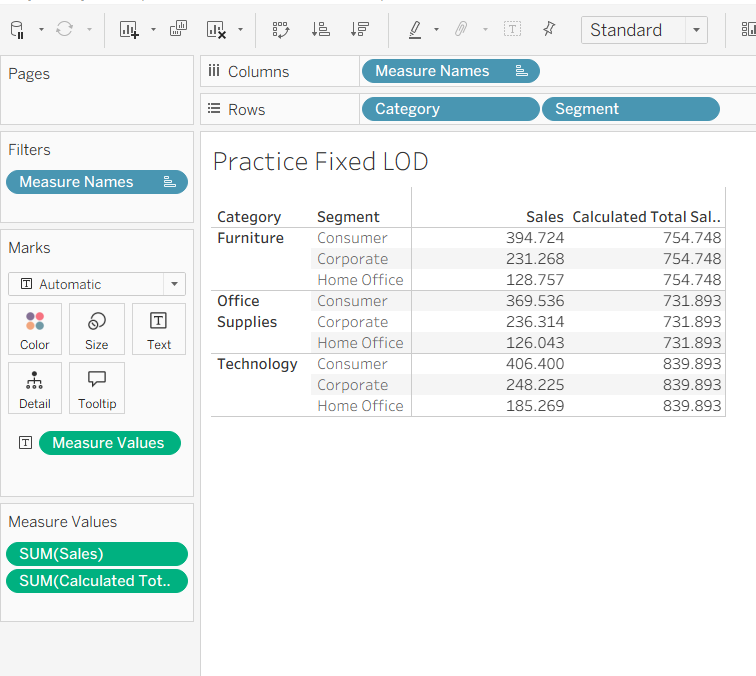
FIXED: "Give me the total for this Category, period."
Include LOD
What is an Include LOD
An Include LOD expression computes values using the specified dimensions in addition to the dimensions that are in the view.
Unlike 'Fixed LOD', 'Include LOD' is additive. It is useful if you want to calculate at a more granular detail that is currently not represented in the visual.
Superstore Scenario
Let's say we want to see the average 'Sales' per customer for each 'Region'. If you just take the Average of 'Sales', Tableau will just calculate the average of every individual transaction combined. To get the average of Customer Total, an Include LOD is needed, because a customer might had more than one transaction in the dataset.
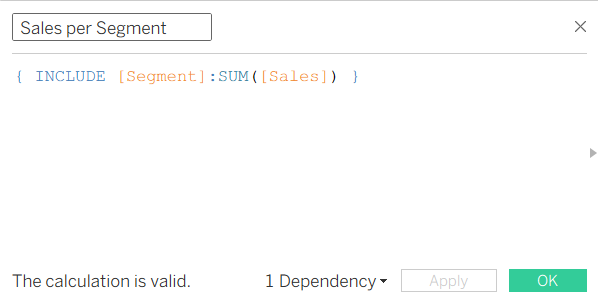
- Create a Calculated Field 'Sales per Customer'
- Enter the Formula: { Include [Customer Name] : SUM([Sales]) }
- Drag 'Region' to the Rows shelf.
- Drag 'Sales' to the Columns shelf. This shows total regional sales.
- Drag your new 'Sales per Customer' measure to the Columns shelf.
- Change the aggregation of LOD from SUM to AVG.
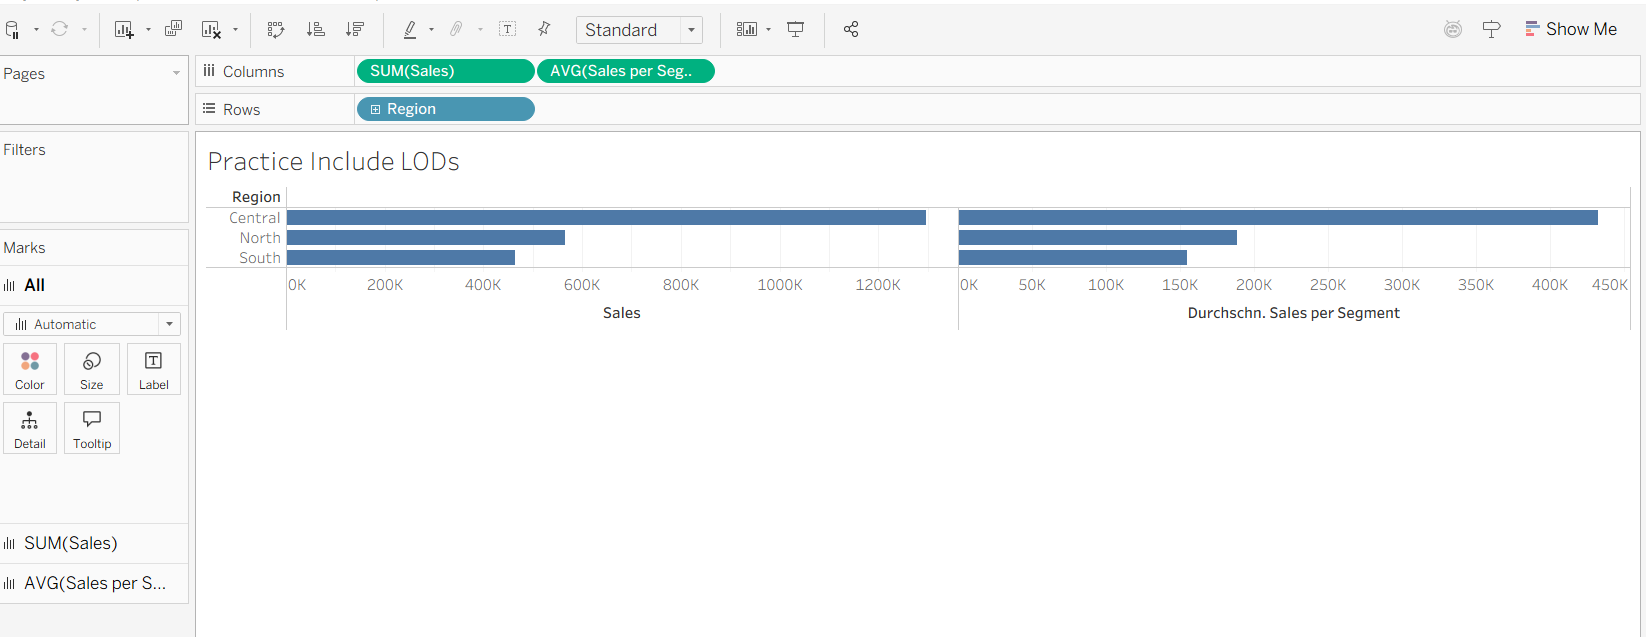
INCLUDE: "Give me the total for what's in my view, but make sure you consider the Segment too."
Exclude LOD
What is an Exclude LOD
An Exclude LOD expression declares dimensions to vanish from the calculation, even though they are present in the visual.
It is most used if you want to calculate 'Percent of Total' or when specific rows need to be compared against a higher level category without the category filter changing as filtered.
Superstore Scenario
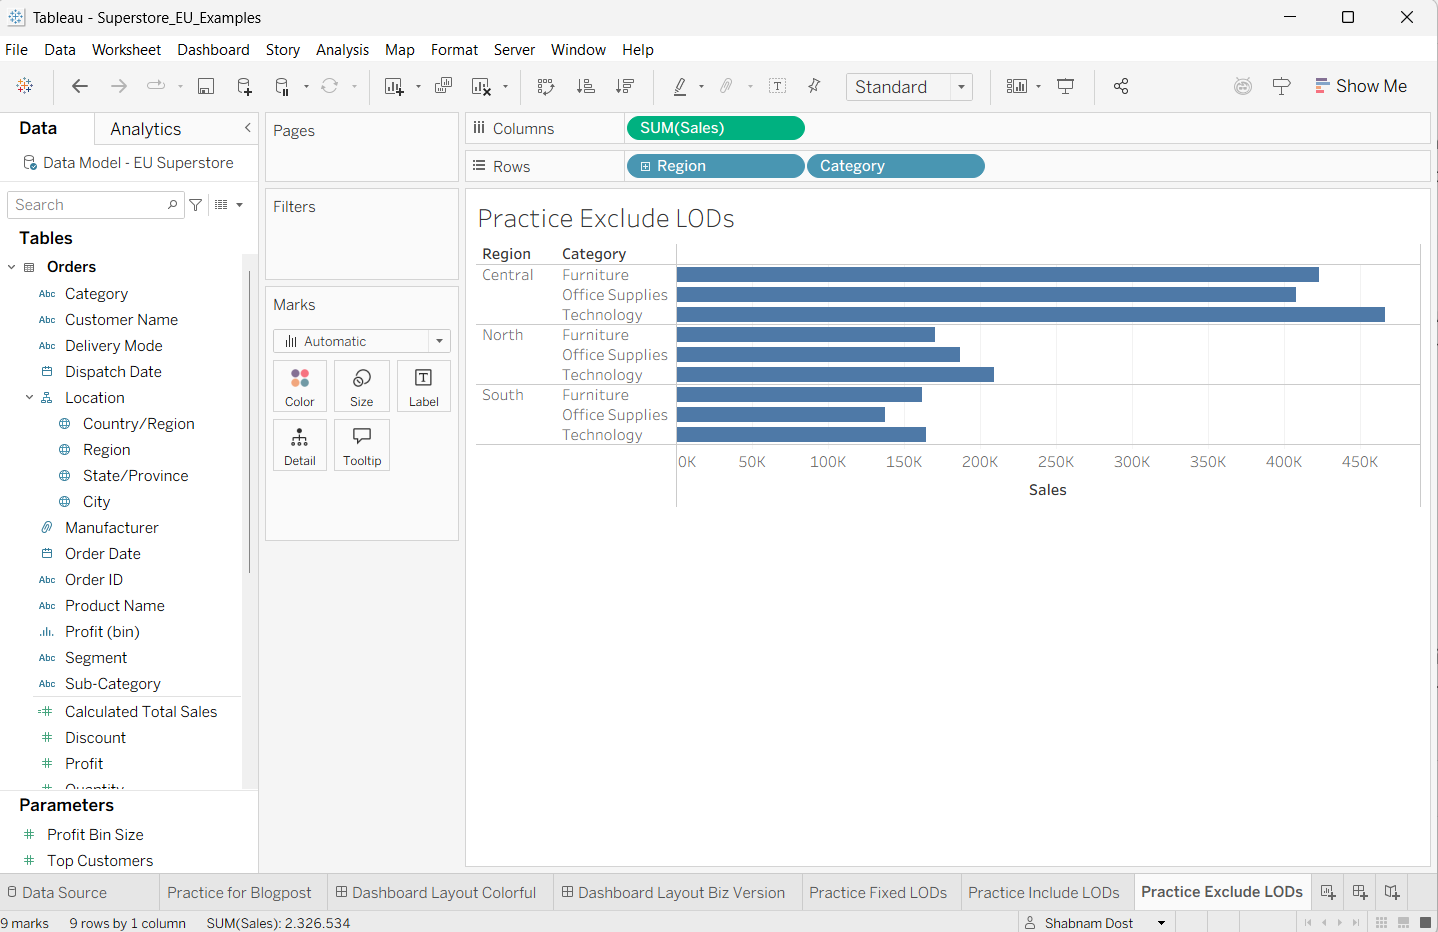
Imagine you have a view showing Sales by Region and Category, but you want to compare each row's sales to the Total Regional Sales, so ignoring the Category Breakdown.
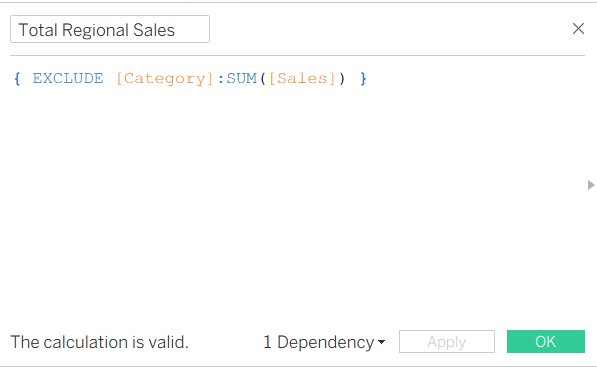
- Create Calculated Field named 'Total Regional Sales'.
- Enter the Formula: { EXCLUDE [Category] : SUM(Sales) }
- Drag 'Region' and 'Category' to the Rows shelf.
- Drag 'Sales' to the Text/Label card.
- Drag your new 'Total Regional Sales' to the Text/Label card.
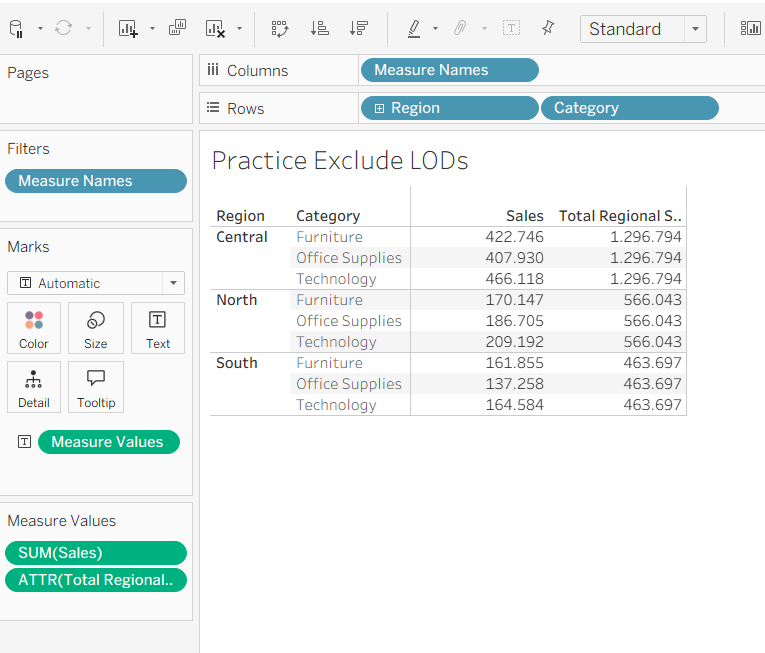
EXCLUDE: "Give me the total for what's in my view, but pretend Category isn't there."