


A super packed week, and a break from client projects! Join me for my weekly reflection on life at the Data School!
Monday - Alteryx Macros
After covering basic Macros in Alteryx a few weeks back, we moved onto creating Batch and Iterative Macros.
A Batch macro basically lets you create a macro that will run as many times as items in your 'batch'. For example, say your batch is made out of 7 currencies, where you macro is summarizing values by currency, then your macro will run 7 times. An Iterative macro on the other hand, lets you create a macro that will run until a certain condition is met.
We spent the day running through examples of these two types of macros, and by the end of the day I was definitely feeling much more confident in using macros!
Tuesday - Tableau Time
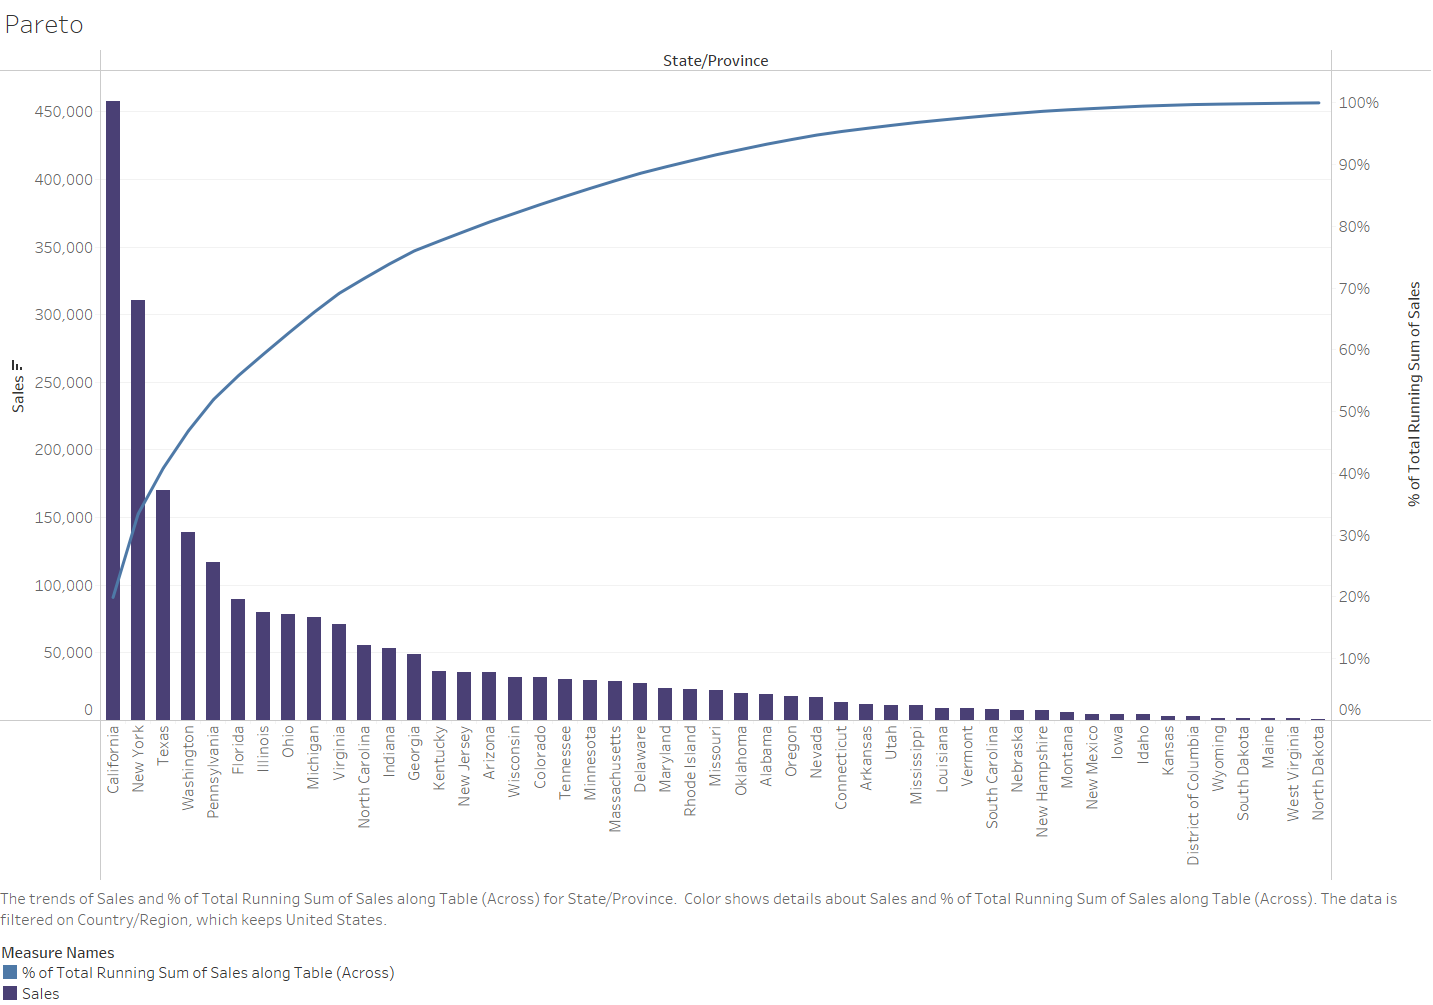
With a Tableau exam looming on Friday, we spent Tuesday morning running through some of the exam specifications in preparation. We then spent the rest of the day creating advanced table calculations in Tableau, which whilst challenging, was pretty fun! For example, we created a Pareto chart (see below), which shows a value both as a descending bar chart, and a cumulative total represented by a line graph. Will be using this one in any upcoming Makeover Mondays!
Wednesday - Salesforce
Given that the Information Lab partners with Tableau, and Salesforce owns Tableau, it seemed pretty prudent that we have a lesson on Salesforce, as until this point we have been pretty clueless on it. Salesforce is a customer relationship management solution, which also hosts a load of data, which you can access either on Salesforce itself, or via software such as Tableau. We had a go at prepping data on Salesforce, and then building a dashboard using CRM Analytics in Snowflake. After spending so much time in Tableau and Tableau Prep, this felt like trying to write with your left hand, when you're right handed...
Thursday - Exam Prep and Power BI
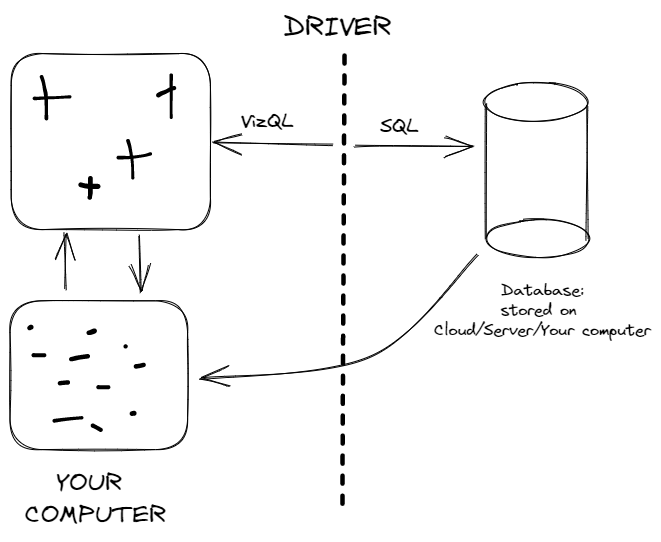
We spent this morning doing a little more prep for our exam tomorrow. One thing we went over was how Tableau connects to data. Tableau uses a language called VizQL, which isn't used by any databases, which you may thing would cause an issue when loading data into Tableau from a data source that runs on a language like SQL. This is where a driver comes in. A driver is like a translator for code, and allows Tableau to speak to data bases and extract data back into Tableau in VizQL. This looks something like this:
Following on our lesson testing out other data visualization tools yesterday, we spent the afternoon testing out PowerBI to create dashboards, and clean data. This felt a little more intuitive than CRM Analytics, but I certainly missed many elements that you get in Tableau, but you can't get in PowerBI.
Friday - Tableau Data Analyst Exam
Tomorrow is going to be a jam-packed day, with our Tableau Data Analyst exam in the morning, and then some mock interviews in the afternoon. If you want easy Fridays then the DS definitely isn't for you...