This is the second to last blog in my series on Tableau Table Calculations. This time we will be going through creating a Percentile Calculation! For this blog, I will be using the Superstore data on Tableau Desktop.
What is a Percentile calculation?
In a percentile table calculation, Tableau works out a percentile rank for each value in the chosen view. Instead of creating a normal rank with a whole number, Tableau creates a rank as a percentage.
Take the following example which shows Profit by Sub-Category:

Adding a Percentile table calculation to rank Profit by Sub-Category gives us the following view:

We have 17 different Sub-Categories, and each percentile will increase by approximately 6% (depending on the rounding, and taking into consideration that one value will be ranked 0%, and another 100%). Tables have the lowest profit, so are given a percentile rank of 0%. The Sub-Category with the second lowest profit was Bookcases, so this is given the next lowest percentile rank of 6%.
Percentile - Basic Quick Table Calc
Now we've gone through what a percentile quick table calculation is, let's try building one, using a quick table calculation.
Say we want to create table showing a percentile rank of Profit, by Manufacturers who only make items in the Sub-Category of Accessories. We can start by dragging Manufacturer onto the rows field, and then Sub-Category on Filters, and selecting 'Accessories'. Next let's drag Profit onto Text in the Marks card. You should have the following view:

Now let's apply our quick table percentile rank. Select the drop down menu on the Sum of Profit, and select 'Quick Table Calculation', and then ' Percentile'.

We can round this number by right clicking on the Sum of Profit pill, and selecting 'Format'. You can then edit the number of decimal places. I'm setting it to 2.

Finally sort by Profit so that the highest percentile rank is at the top, and you should be left with the following table:

Percentile - Advanced Table Calc
Quick table calculations use Tableau's default settings, however we can change the way the calculation works by editing our quick table calc, giving us a little more control over the output.
Working with the view we just created, select the drop down menu on Profit, and select 'Edit Quick Table Calculation'

This will bring up the following box:

You can use this to change the order by which the percentile rank is computed, i.e. descending or ascending.

Ascending will order the percentile ranks so that the highest value of e.g. Profit, will have a percentile rank of 100%, and the lowest value will have a rank of 0.0%. In the example below, the Manufacturer Logitech has the greatest profit of 15,301 so if given a percentile rank of 100%. The numbers below the percentile rank signify the order by which Tableau is looking at the data in the view, to create the percentile rank.

Descending will order the percentile ranks so that the highest value of e.g. Profit, will have a rank of 0%, and the lowest value will have a rank of 100%. In the example below, HP has the lowest Profit of any Manufacturer, so is given a percentile rank of 100%.

The second way to change the way our quick table calculation works, is by changing the partitioning of the calculations, i.e. the order in which the percentile rank is calculated, depending on what else is in the view.
To understand how we can change the partitioning, I'm going to add Segment to the columns field in the view we have already created, and add a second Profit pill to the labels, so we can better see how Tableau is calculating the percentile rank.
In our edit table calculation box, we can use the 'Compute Using' field to change the partitioning of our view, as seen below.

This gives us several options:
Table (across): Tableau will work out the percentile rank by going across the table from left to right. When it gets to a new row, it will start again. As you can see below, the percentile rank is calculated for each manufacturer separately, from left to right.

Table (down): Here, Tableau will work out the percentile rank by going from top to bottom within a single column, then restarting when it gets to the next column. Here you can see that all the Manufacturers are given a percentile rank on profit within the Consumer Segment, and this rank begins again for the Corporate Segment.

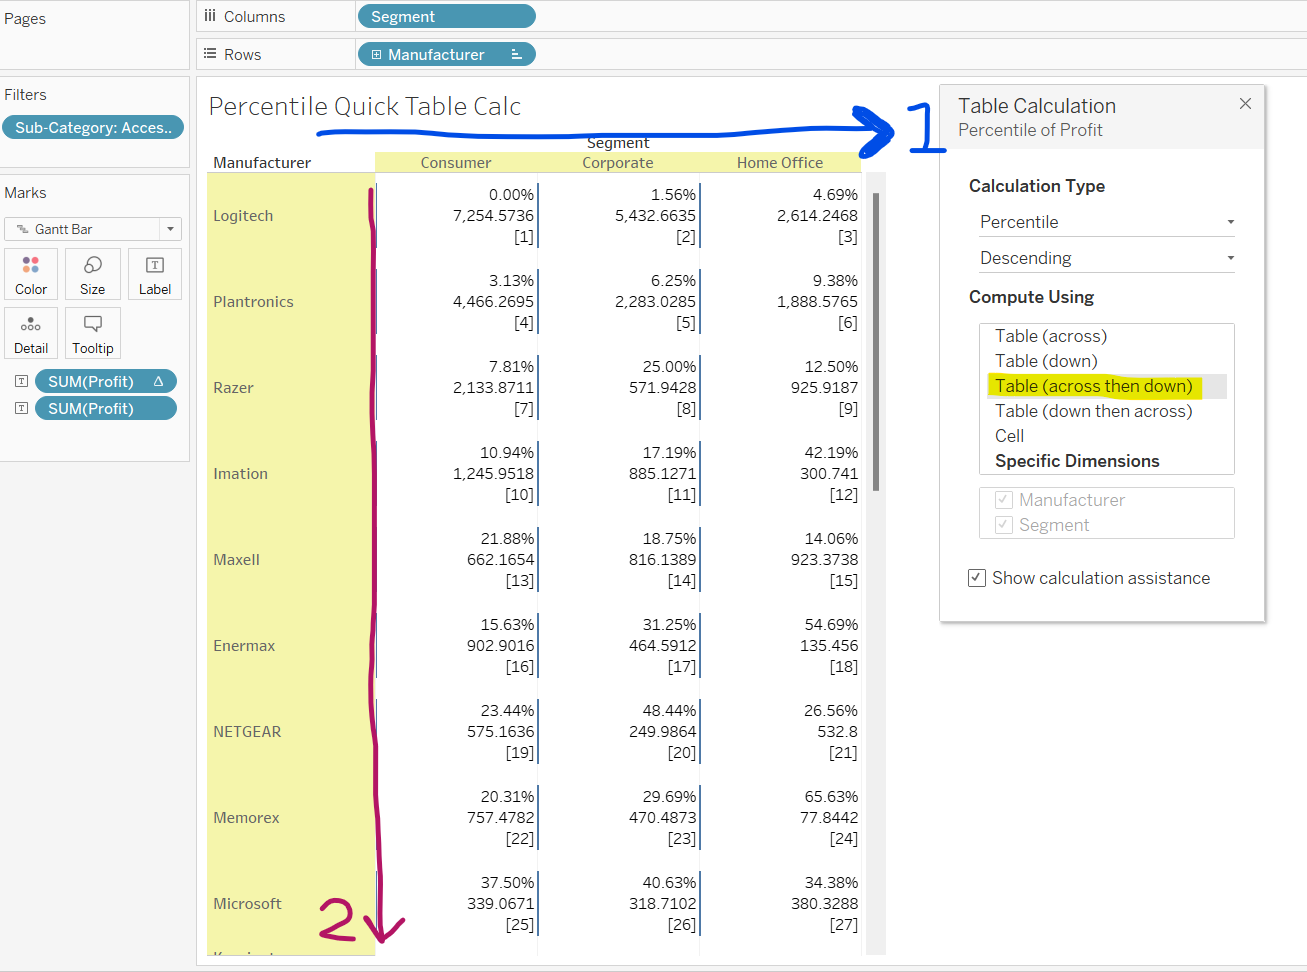
Table (across then down): with this partitioning, Tableau will start looking at the table from left to right, then continuing down the view onto the next row, again going from left to right, and so forth. You can see the order by which Tableau looks at the values by the numbers within [brackets]. With this partitioning in the table below, the profit rank is worked out for the table as a whole, rather than restarting by Segment or Manufacturer.

Table (down then across): with this partitioning, Tableau will start looking at the table from top to bottom, then continuing right onto the next column, again going from top to bottom. Again, with this partitioning in the table below, the profit rank is worked out for the table as a whole, rather than restarting by Segment or Manufacturer.

Cell: for this partitioning option, Tableau will work out a percentile rank for each cell as and of its' own, meaning the rank will start again for each cell.

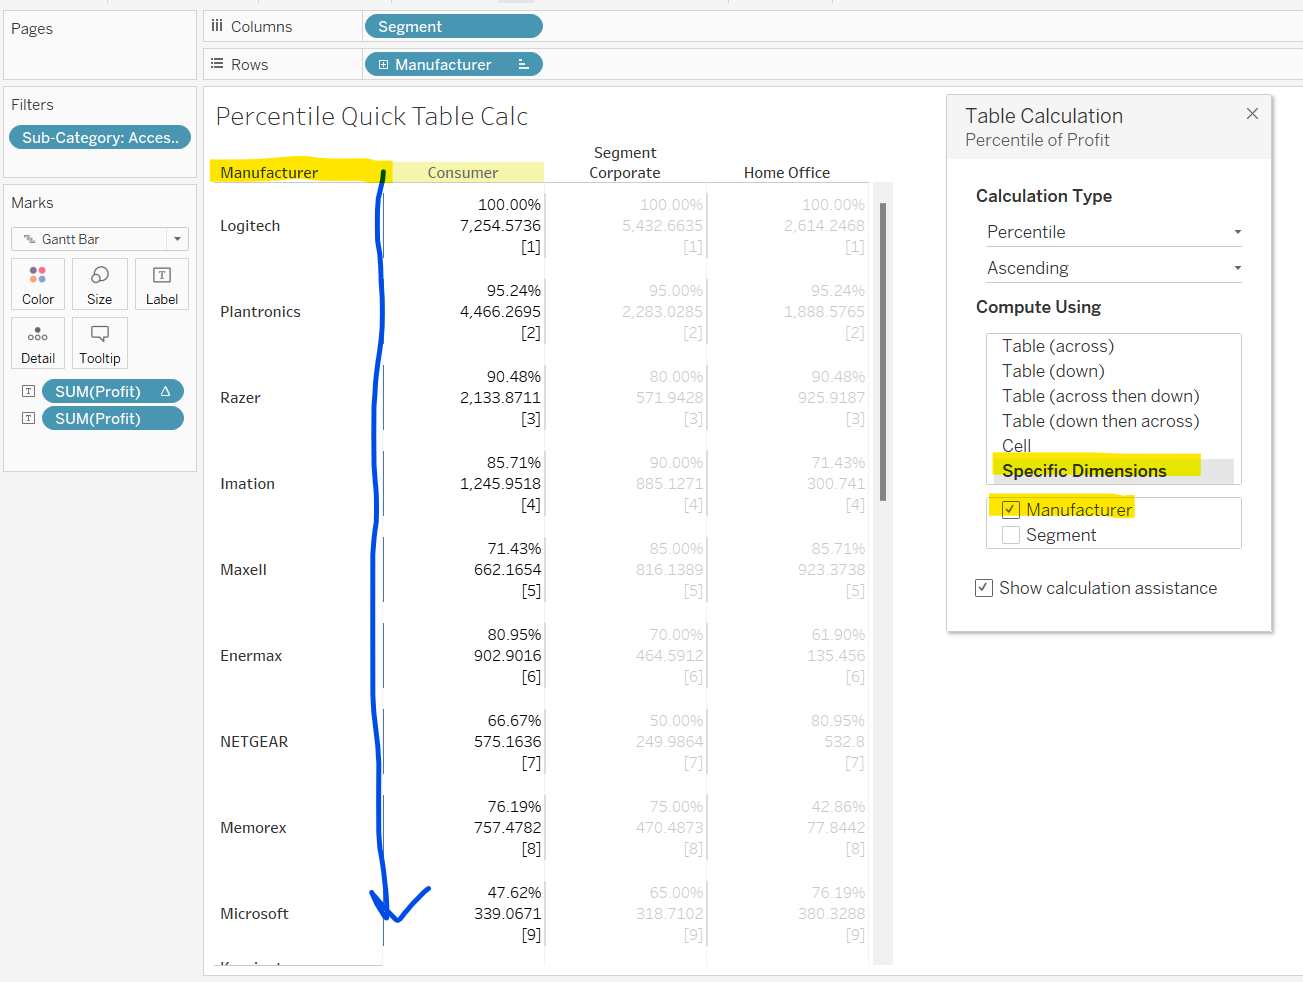
The final 'Compute Using' options that Tableau provides us are by 'Specific Dimensions'. These can get a little confusing, as they work in a manner that is slightly contradictory to what you would expect (at least this is the case for me!). In our current view we have two fields by which Profit is being given a percentile rank - Manufacturer and Segment. Ticking one of these within the specific dimensions option, and leaving the other unticked, will basically tell Tableau to work out the percentile rank for every value within the field that is ticked, and then restarting for the unticked field.
Looking at the example below, we can see that Tableau works out the percentile rank for each Manufacturer within a segment, restarting at the next segment.

If we untick Manufacturer, and then tick Segment, our view changes so that Tableau is working out the percentile rank for Profit for each Segment, for a single Manufacturer, and restarting again for every Manufacturer.

If we tick both Manufacturer and Segment, then Tableau will work out the percentile rank for the table as a whole, as seen below.

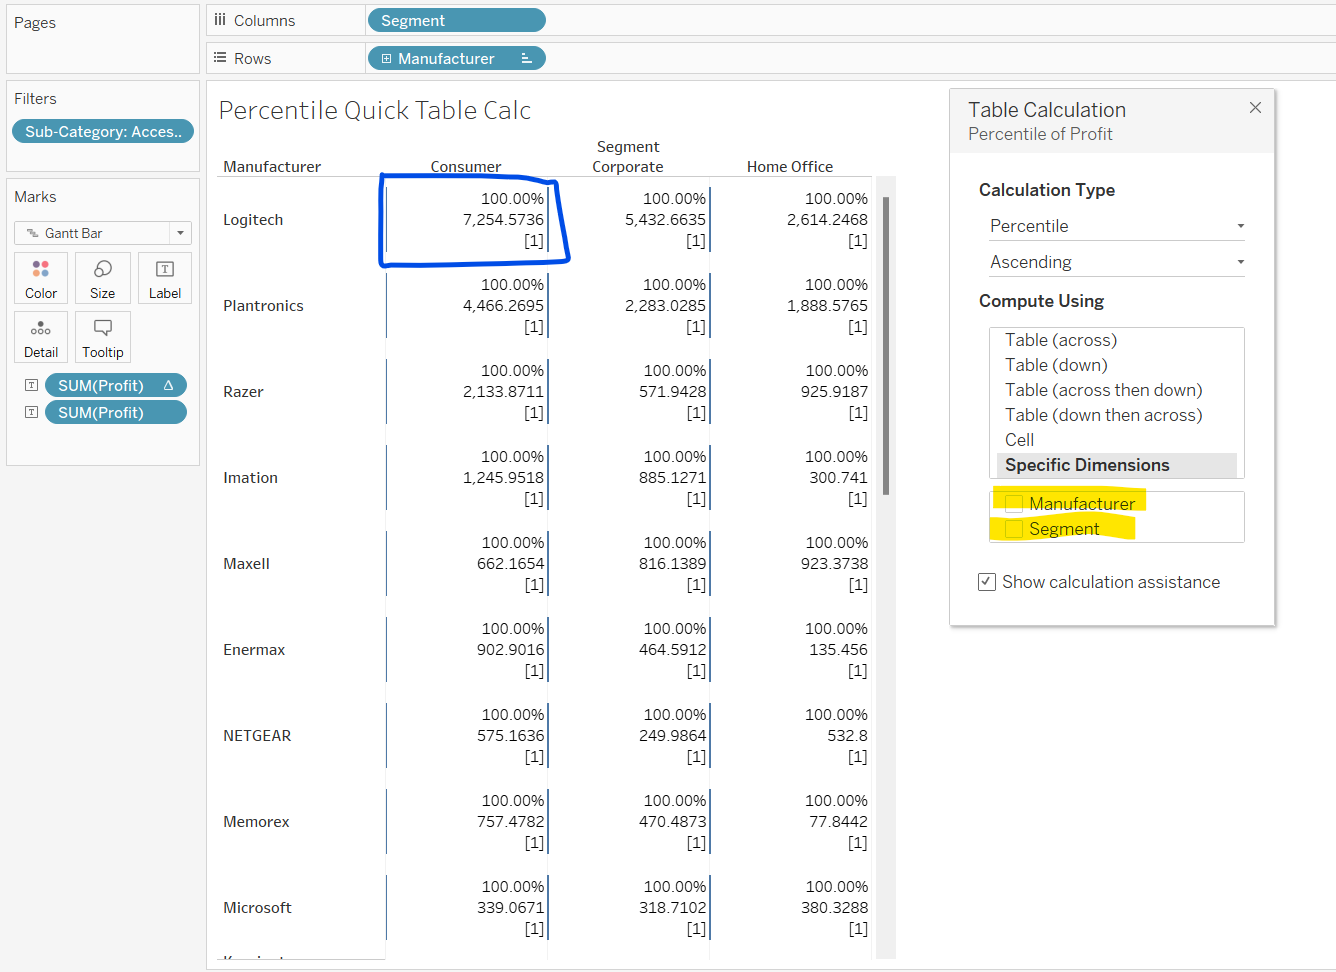
And finally, if we untick both Manufacturer and Segment, then Tableau will work out the percentile rank for each cell, restarting at every Manufacturer and for every Segment.

And that is all!! We've gone through what a percentile rank table calculation is, how to apply one using a quick table calculation, and then how to edit that calculation! Hope you've found this useful, and stay tuned for my final blog in my table calc series which will be on Moving Average table calculations!
