This is the fifth blog in my series on Tableau Table Calculations. This time we will be going through creating a Rank! For this blog, I will be using the World Indicators data on Tableau Desktop.
What is a Rank calculation?
For a Rank calculation, Tableau ranks each value in a view, starting from 1. Let's see an example to understand how this works.
Consider the following graph. This shows global CO2 Emissions between 2000 and 2010.
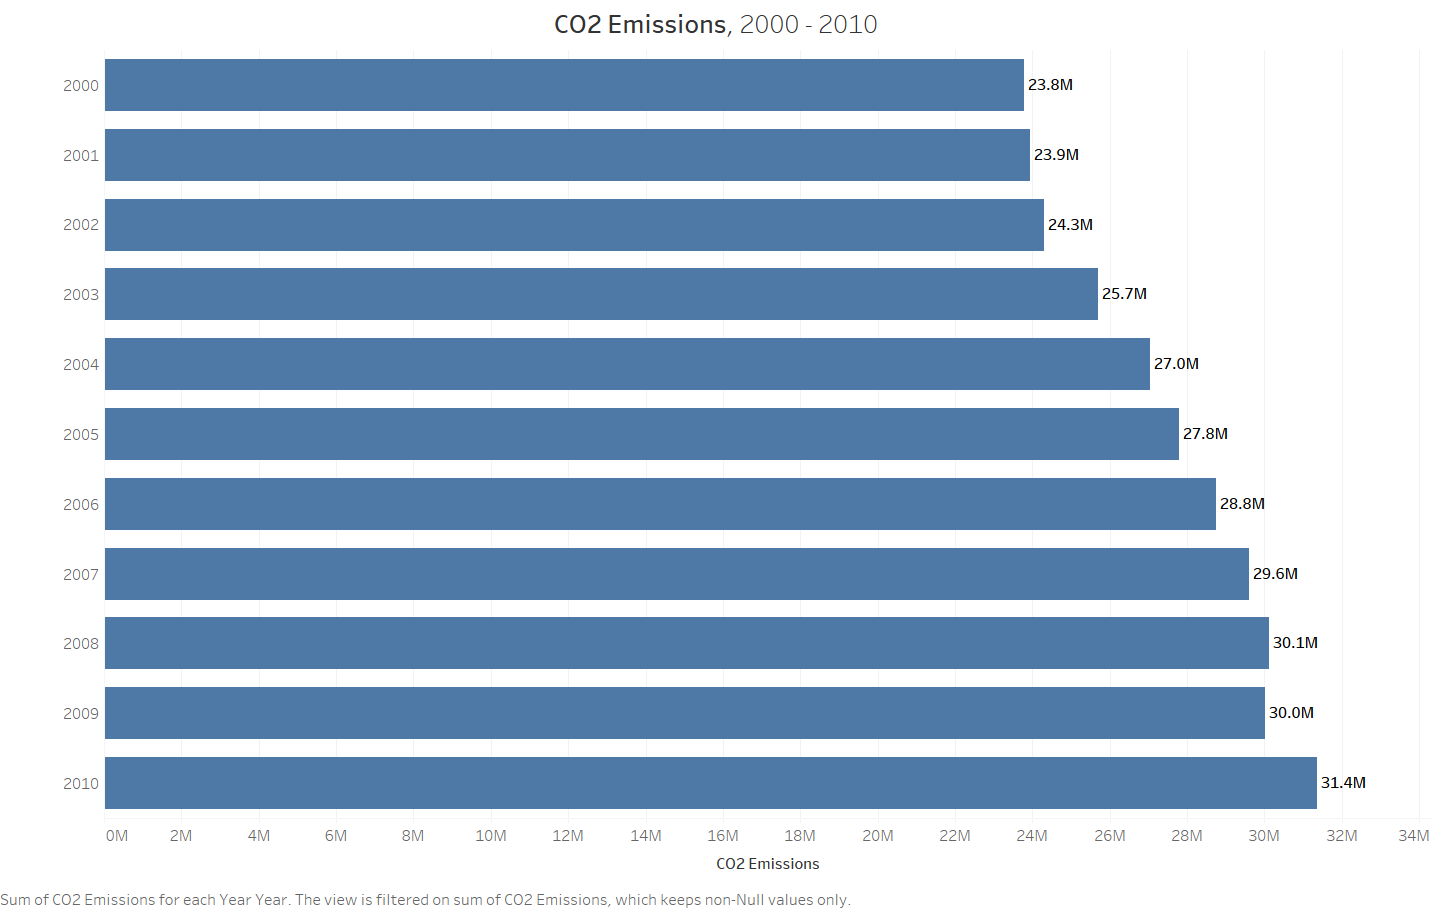
Currently, our view is showing us the emissions by year. Let's say instead we want to see a rank of emissions for each year, from highest emissions to lowest. Well, this is where our Rank table calculation comes in, which transforms our view from that in Table A, to the following view:
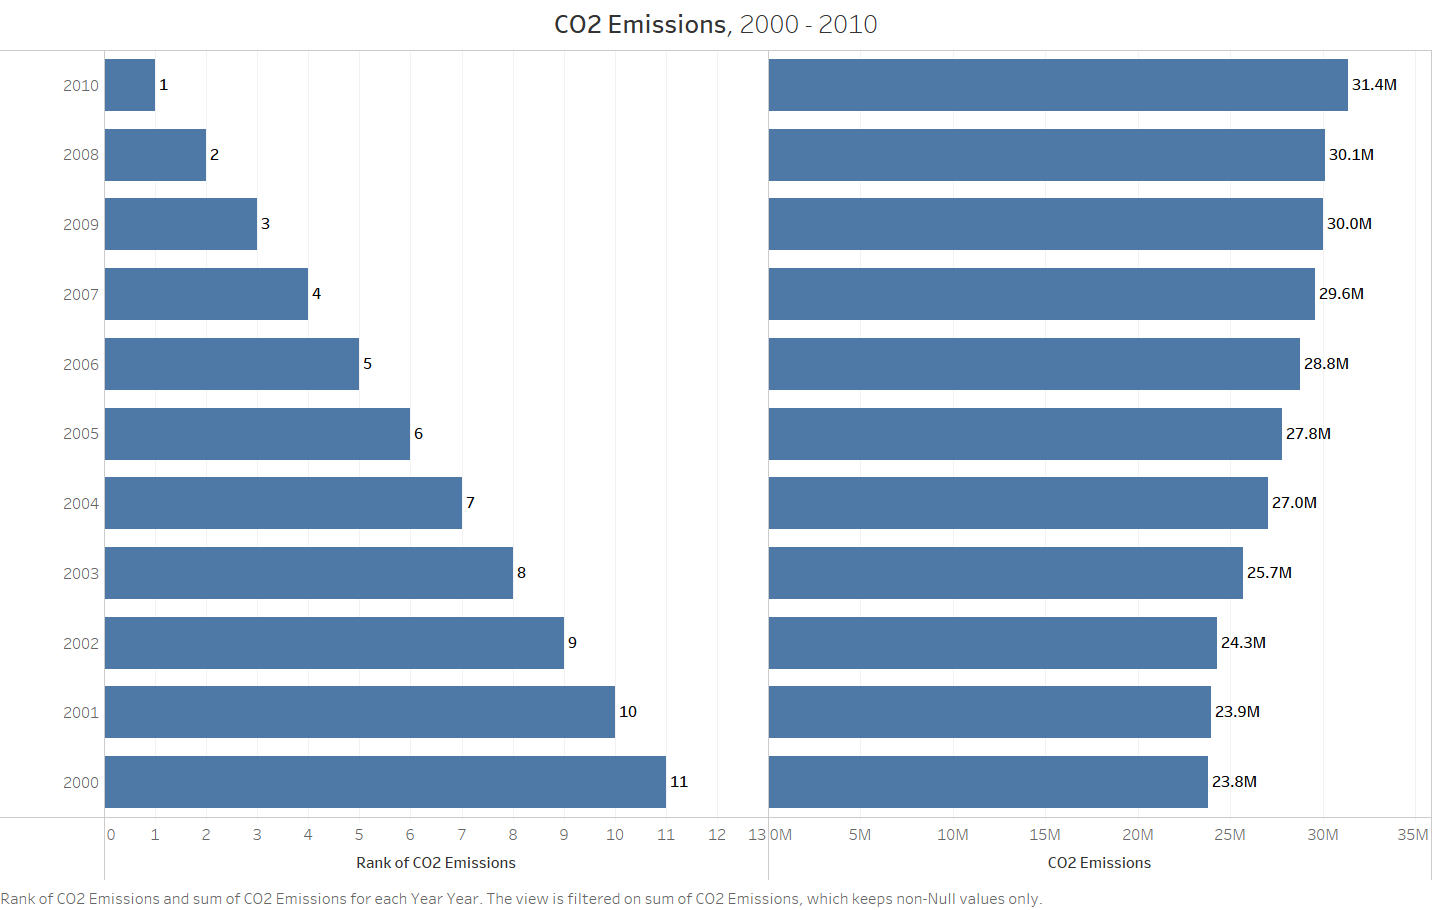
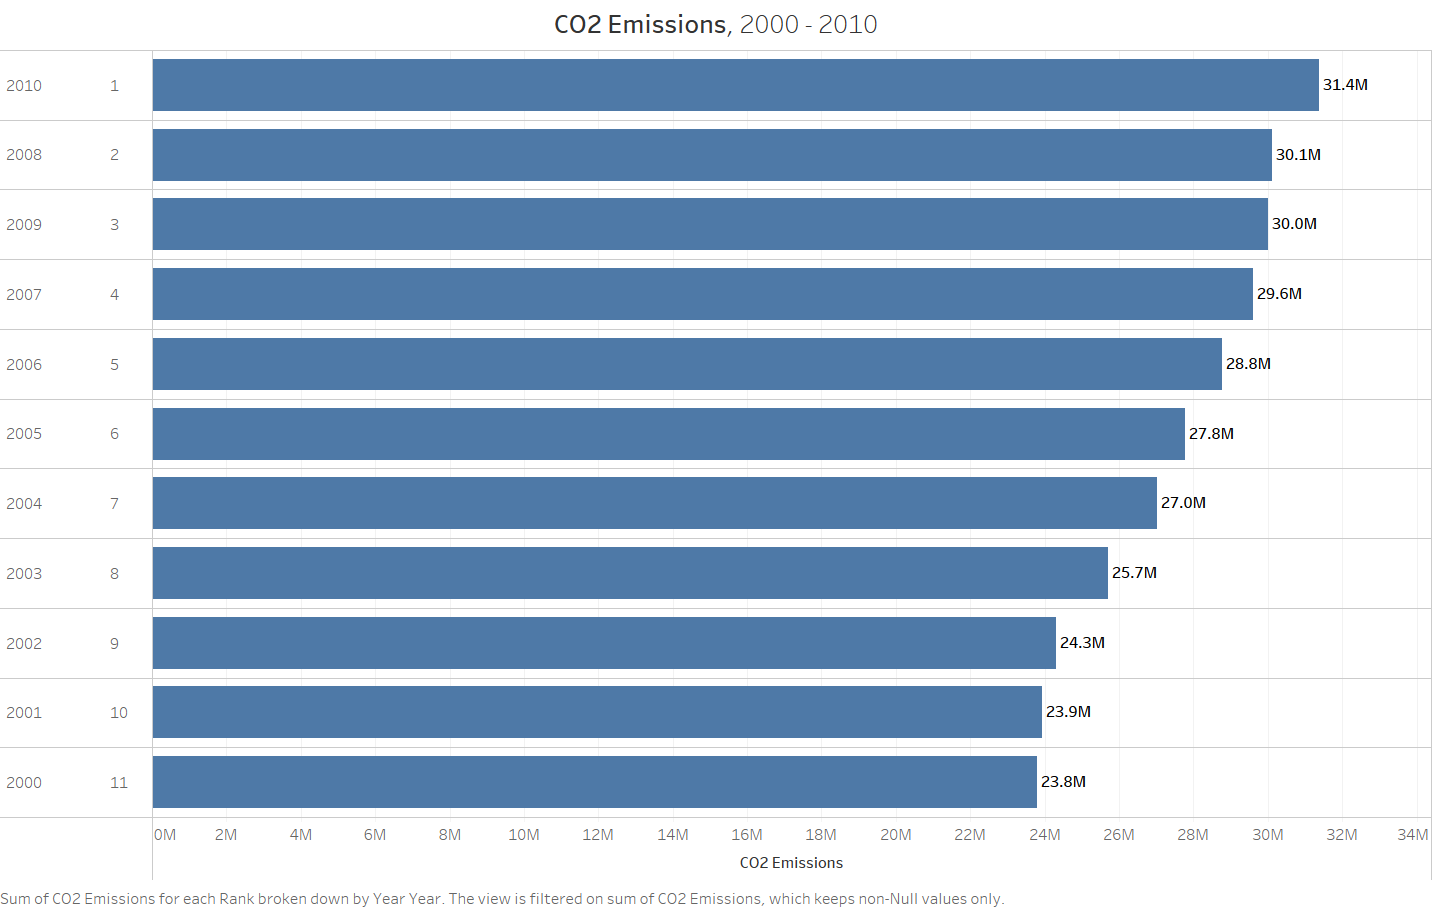
On the left we can see the rank of emissions for each year, where the year with the highest emissions (2010) sits at the top. Notice how the order of the years is different to that in Table A. On the right we can see the bar chart with the original emission values, which you can see are decreasing. We can combine these view to create the following graph, displaying our emissions and rank more clearly:
Let's put this into practice!
Rank - Basic Quick Table Calc
Now we've covered what a Rank calculation is, let's build one.
We want to create a rank of GDP for countries in the Middle East, from highest GDP to lowest, in 2012. We also want to set our view as in Table C, where our rank is displayed in text on the left, and the actual values displayed via a bar graph.
Let's start by dragging 'Country/Region' into the Rows field, and then dragging 'Region' onto Filters, and selecting 'Middle East'. Also drag 'Year' onto Filters and select 2012. Next we want to drag 'GDP' into the columns bar, and turn on our marks labels. I also excluded any null values.
You should be left with the following view:
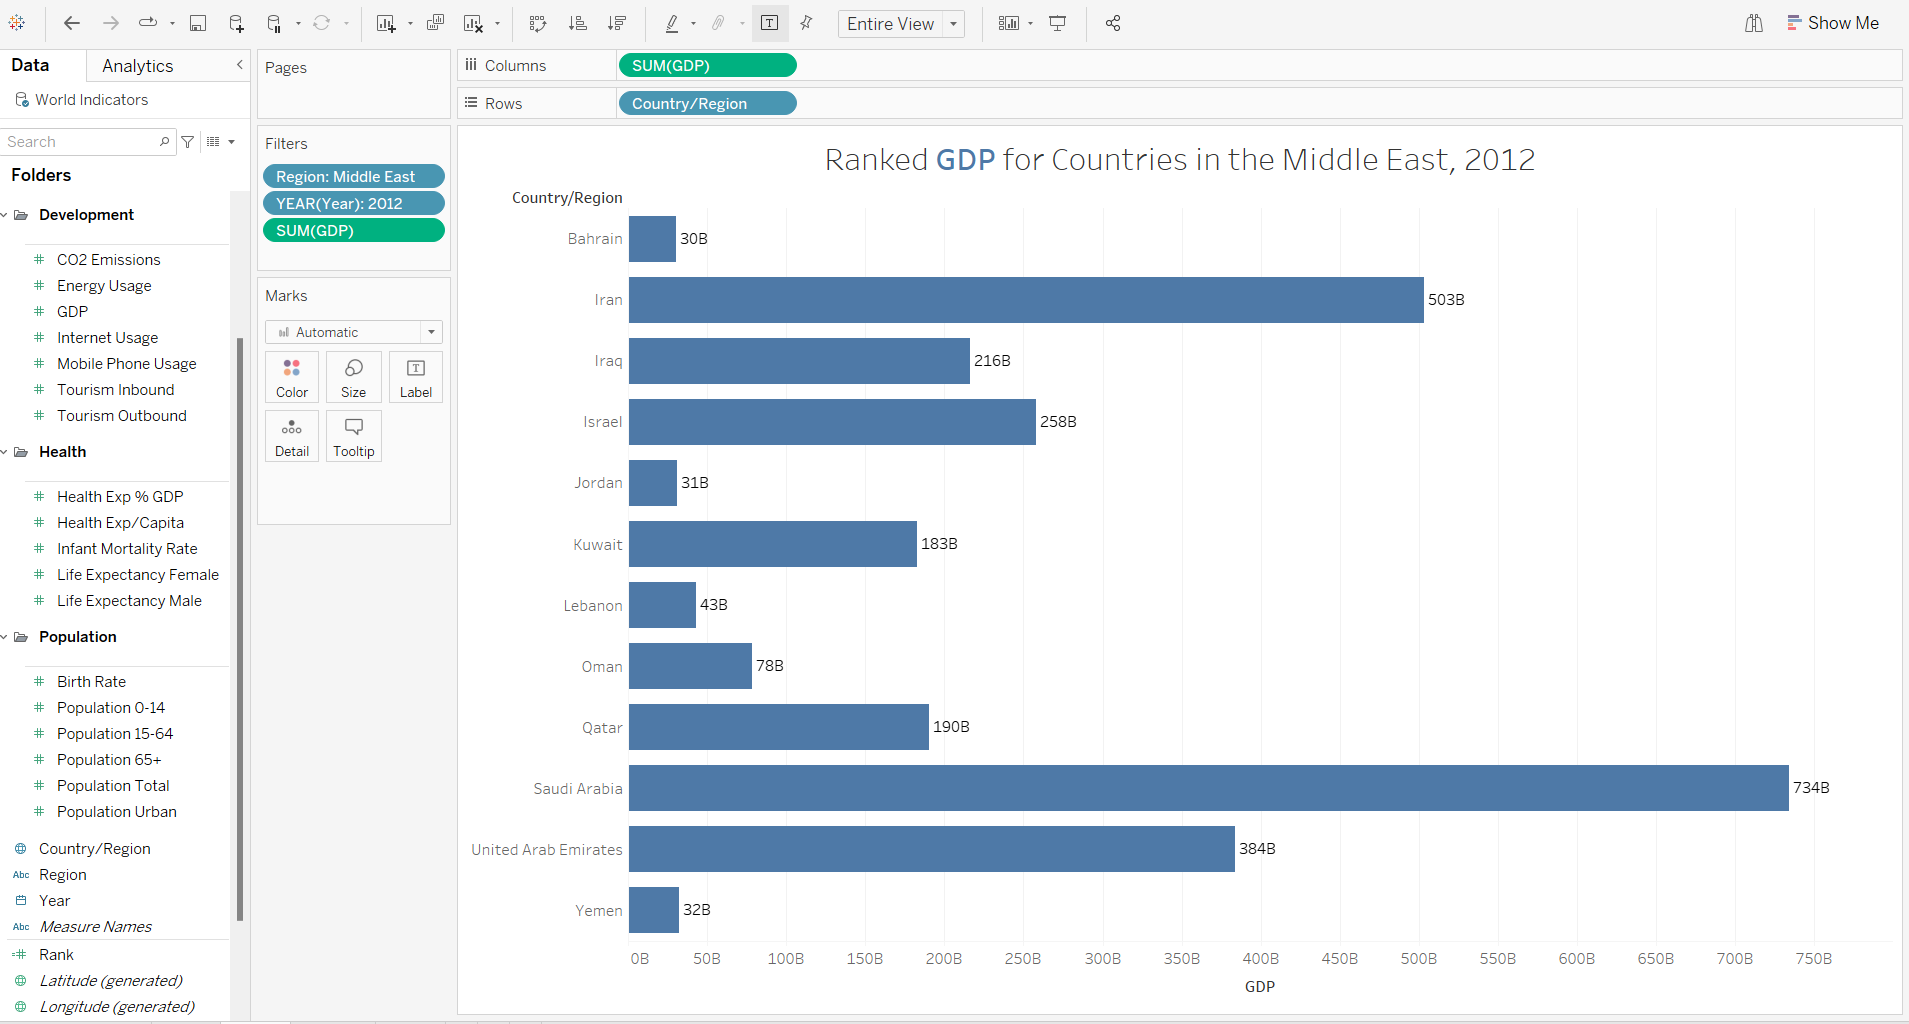
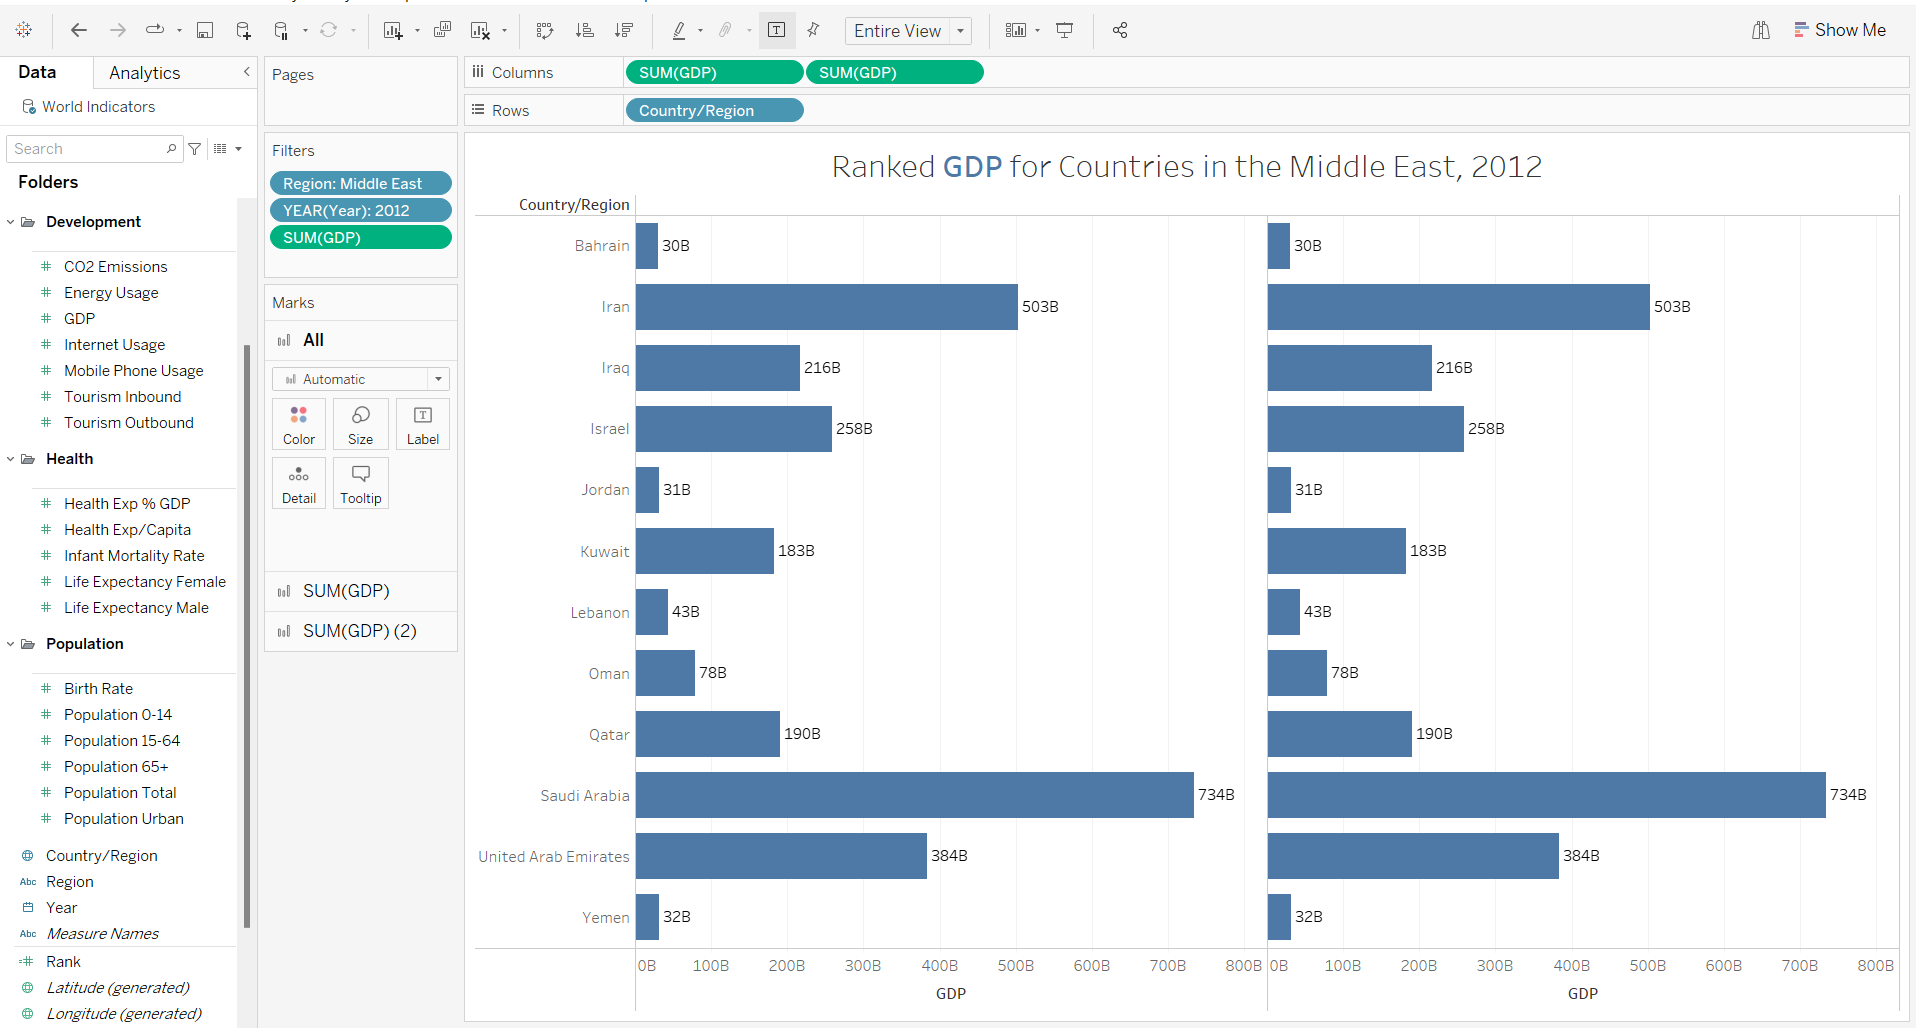
Before we add our rank calculation, let's duplicate GDP in the columns field so that we have two bar charts side by side, as shown below, as we want to apply our Rank once, and also keep the view of the original bar graph showing the GDP values.
Now let's add the rank calculation. Click the drop down menu on the first GDP pill, select 'Quick Table Calculation', and then select 'Rank'.
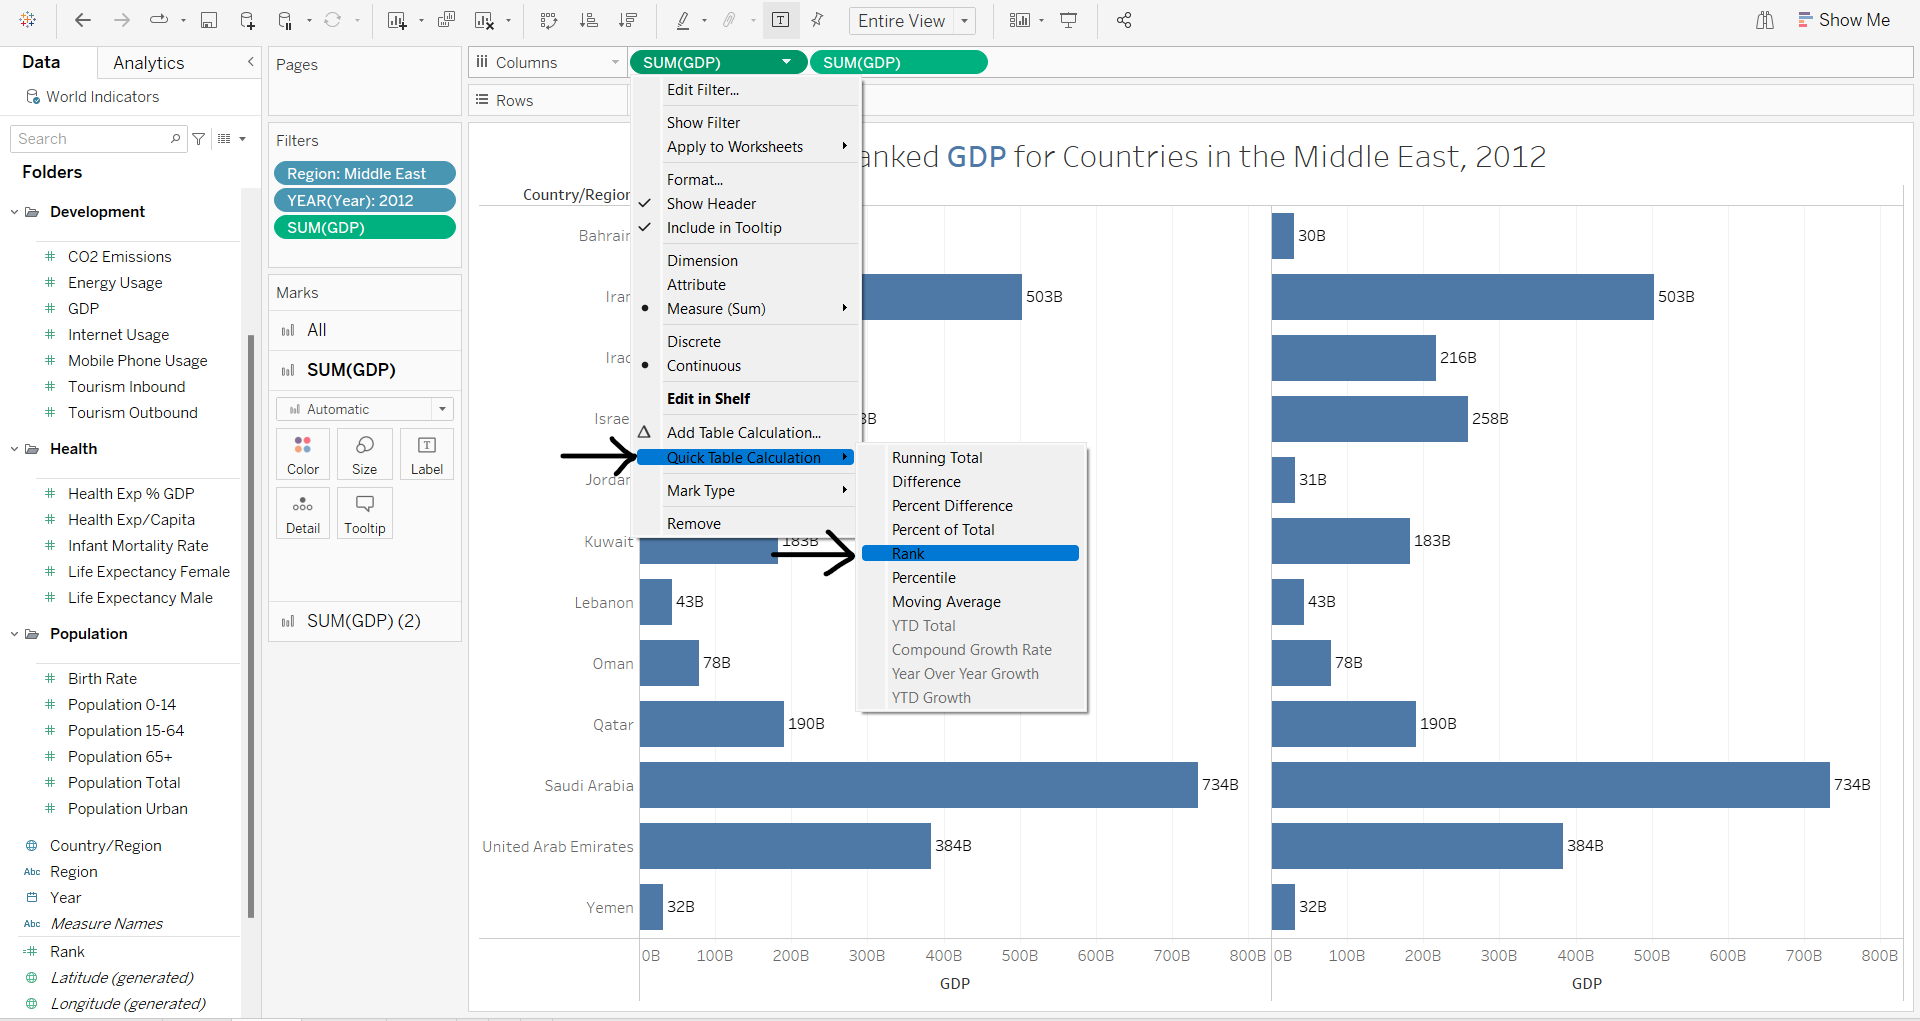
You should be left with the following view:
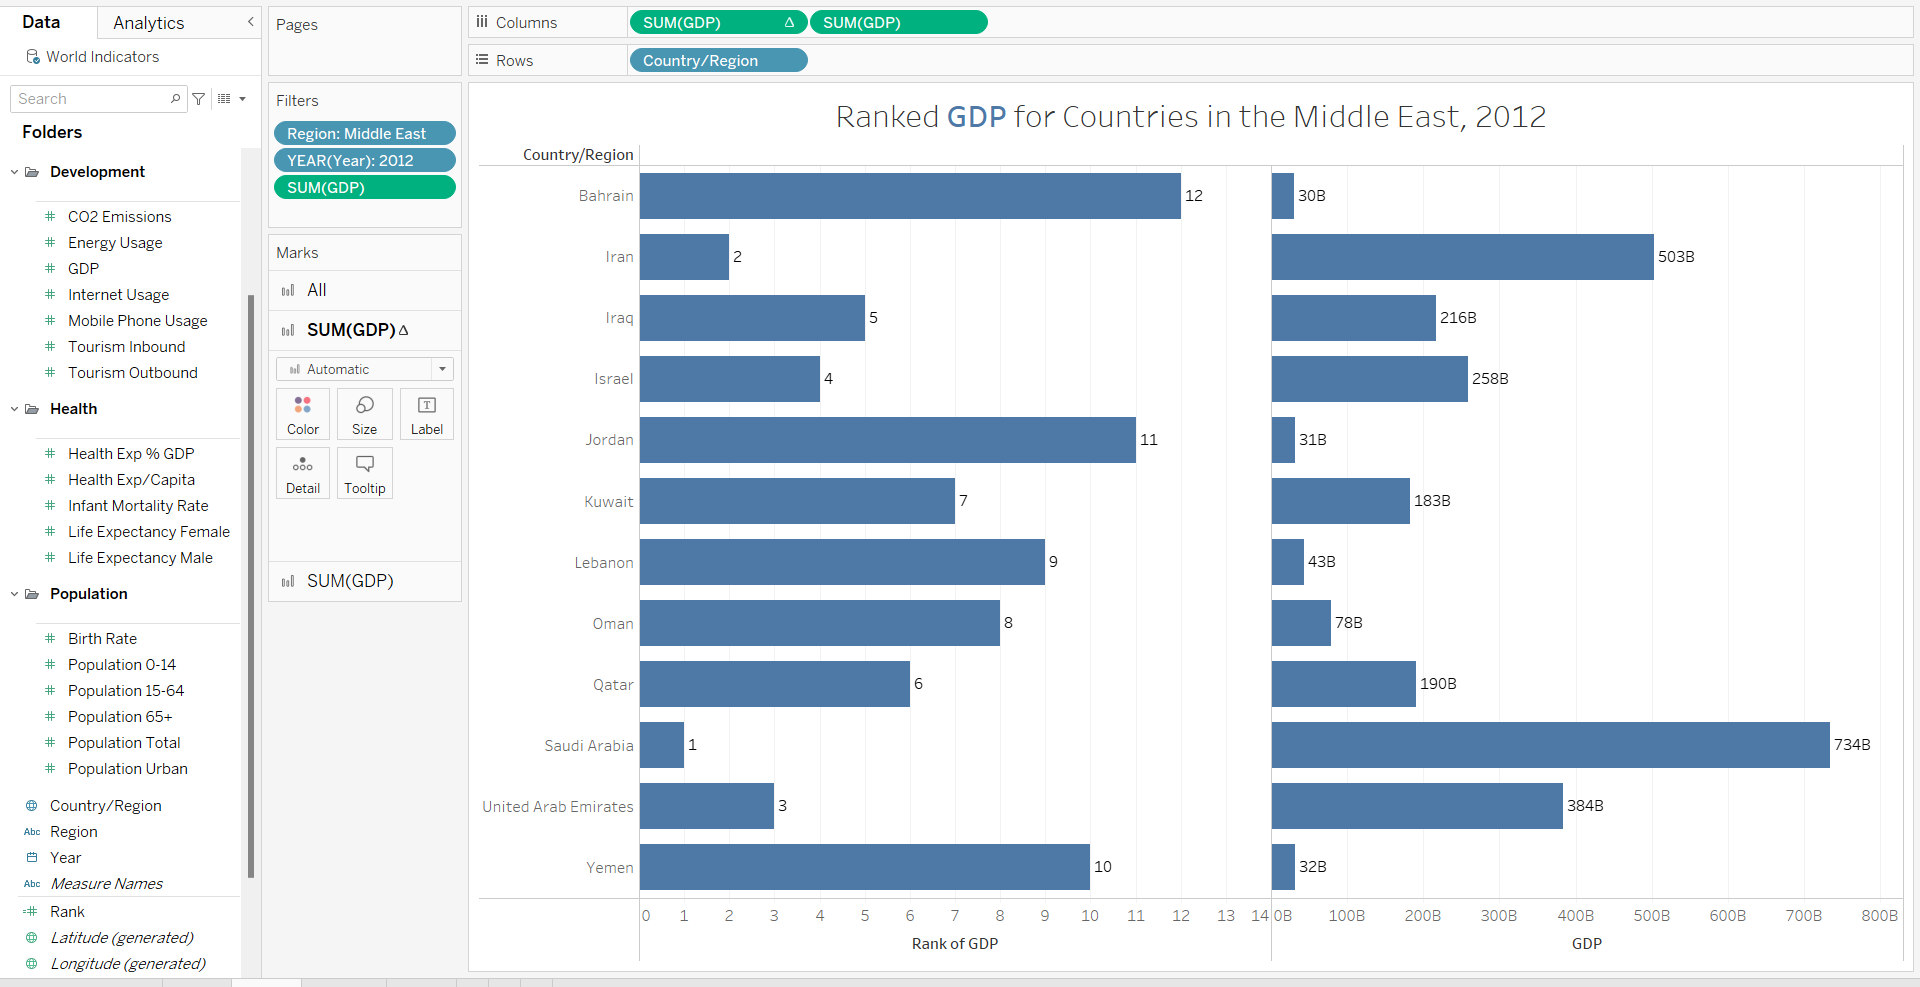
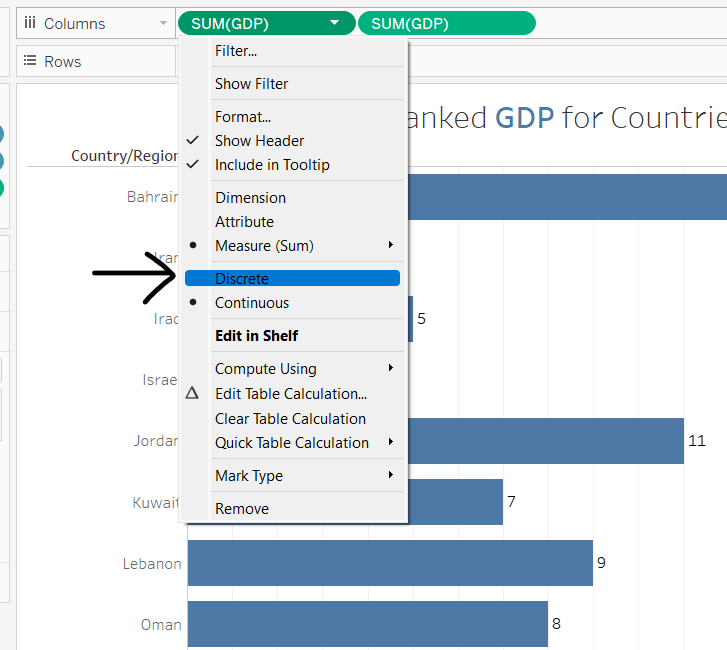
Now we just want to change the Rank of GDP from continuous to discrete, and then move it from the columns bar, to the rows bar, after the Country pill.
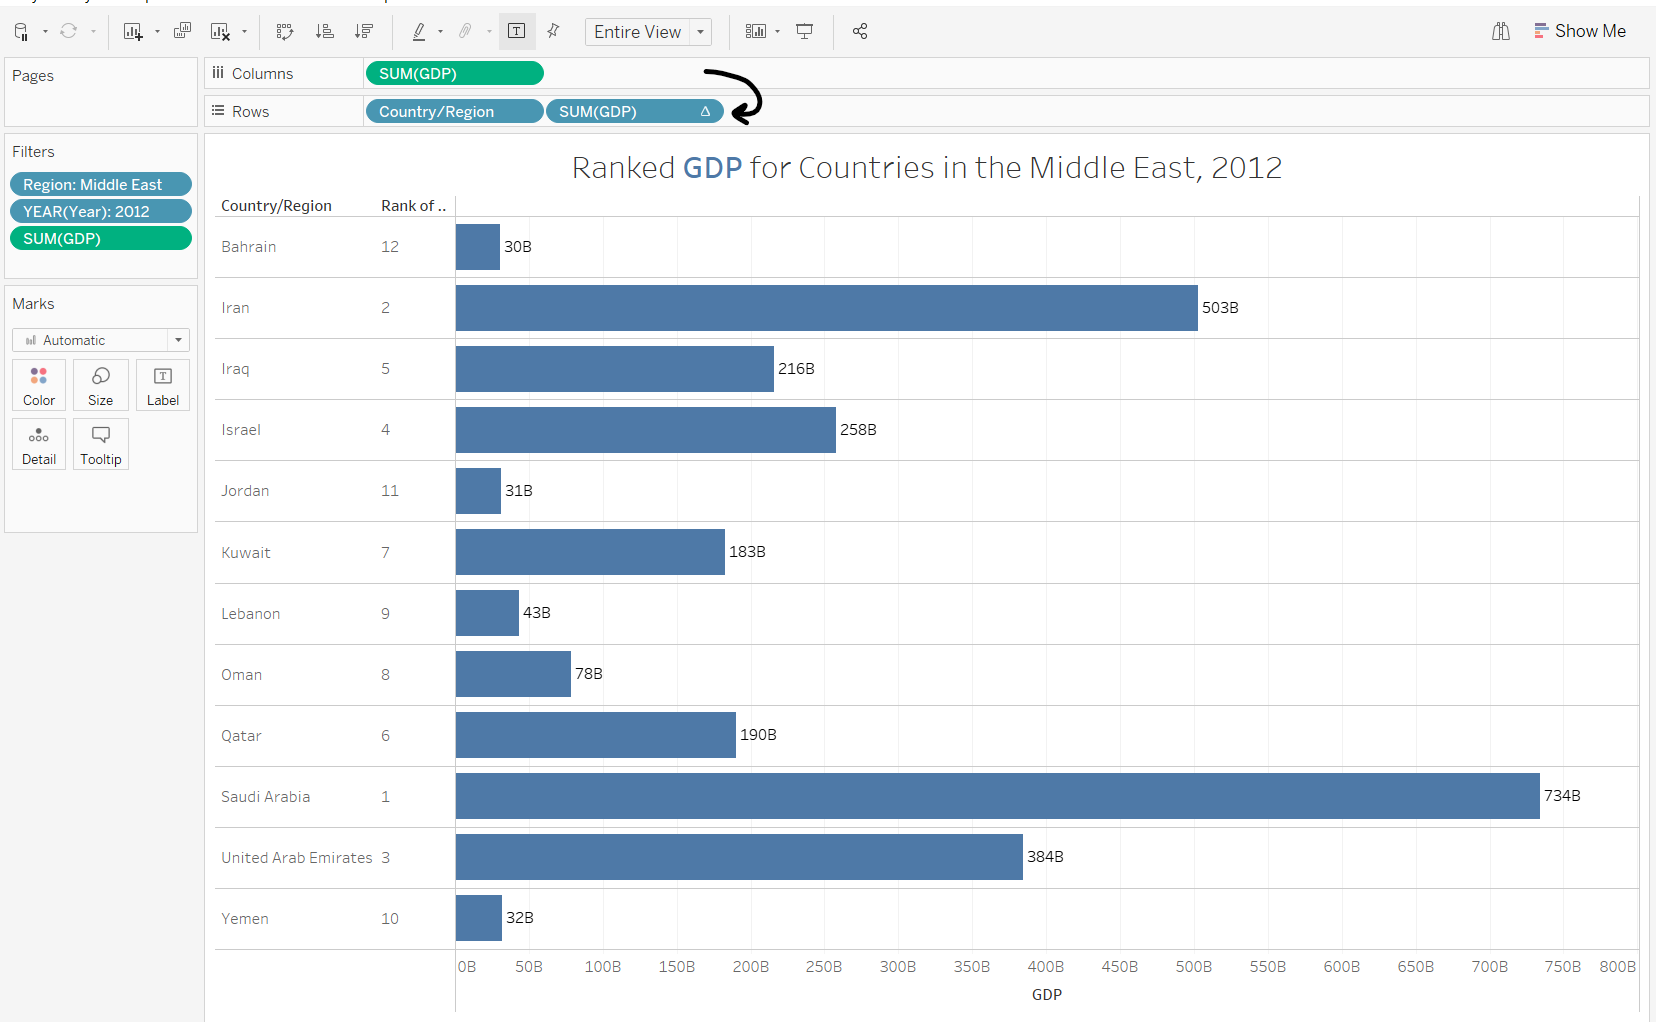
Finally, sort the data by rank, add a title and a little formatting, and you should be left with something along the lines of this:
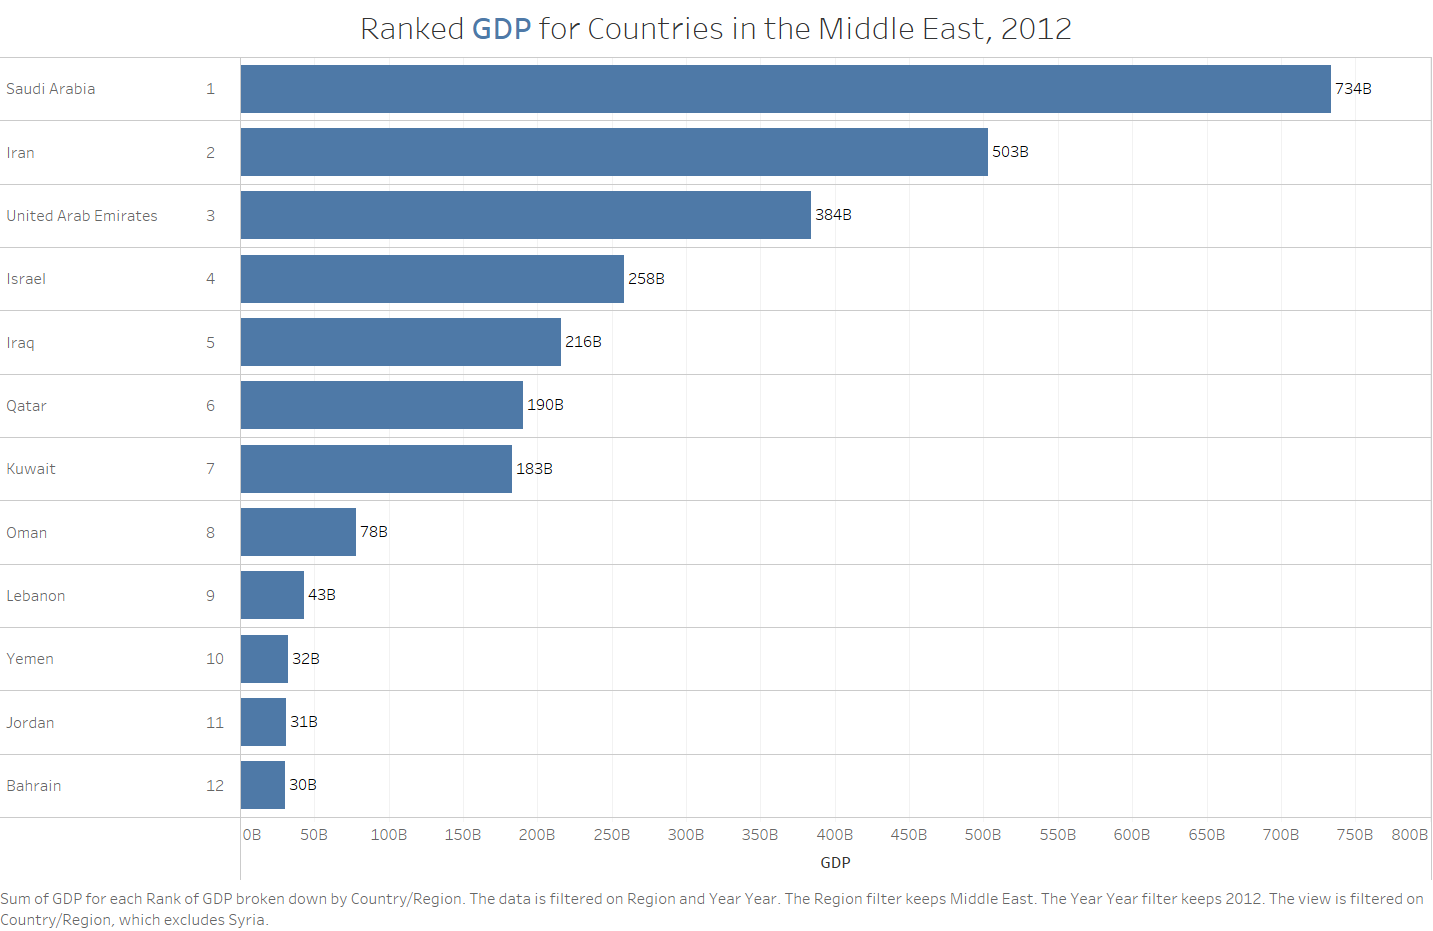
And that is a quick and easy way to use a Rank quick table calculation in your viz!
Rank - Advanced Table Calc
Now, as I've mentioned in previous blogs, quick table calculations are great because they're super simple to use, however they use Tableau's default settings. If you want the calculation to run in a different way, giving you more control over it, then you can edit the quick table calculation.
First, to edit the quick table calculation, all you need to do is select the drop down menu on the pill that your calculation is on, and select 'Edit Quick Table Calculation'.
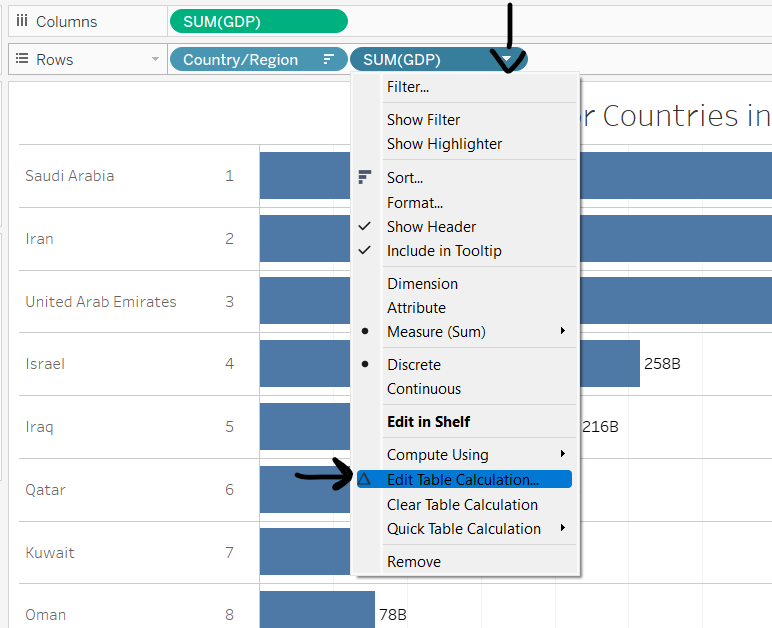
A menu then pops up, allowing to to edit your quick table calculation in the following ways.
Descending vs. Ascending
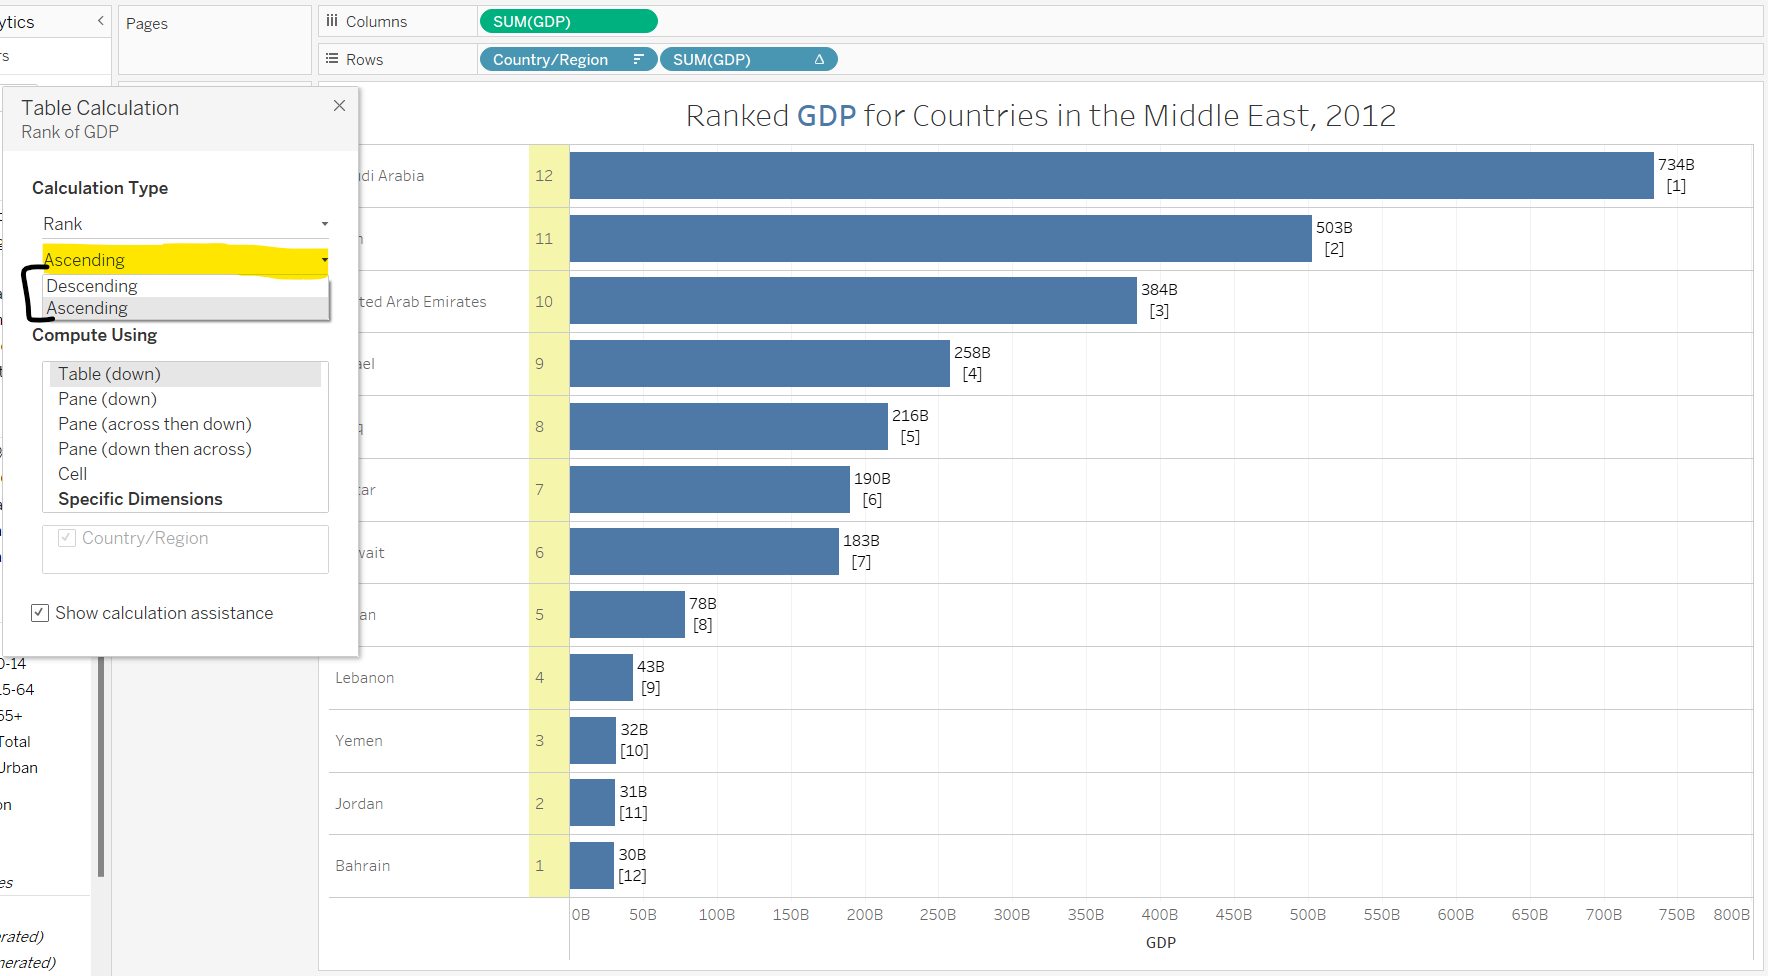
In the example I ran through using a quick table calculation for Rank, you can see that the Countries GDP Rank is ordered Descending, i.e. the rank is starting at the country with the greatest GDP, ranking it 1, and then going to the country with the second greatest GDP and so on.
If we instead wanted our rank to look at the country with the smallest GDP, and rank this 1, then all we would need to do would to change the order from Descending to Ascending:
Rank Type
The second way by which we can edit our table calculation, is by rank type. Take the following example, which shows the average female life expectancy for countries in the Middle East, which is ranked from highest to lowest. As you can see, several countries have the same life expectancy, so how can we change the rank to be more reflective of this?
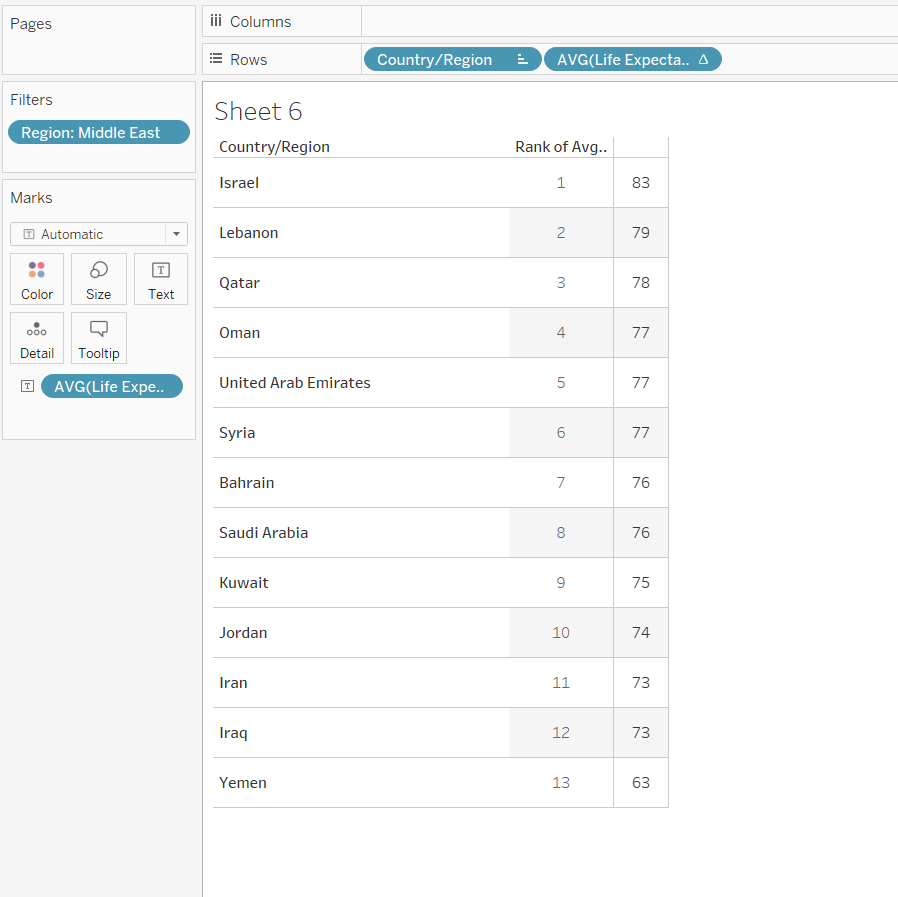
Tableau has four choices of Rank type: Competition, Modified Competition, Dense and Unique.
Competition
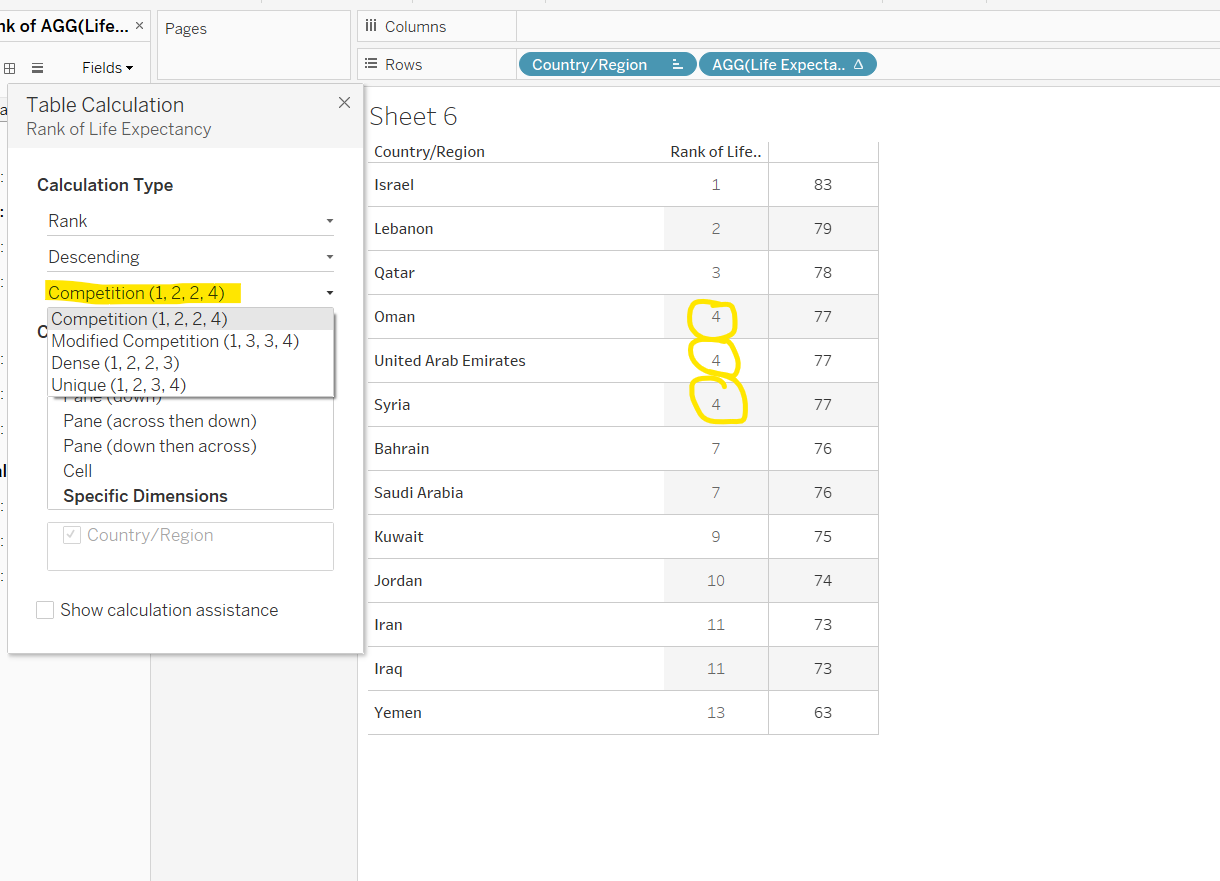
For a competition rank type, identical values are given the same rank. The next non-identical value is then given the rank it would have had, regardless if those before it were identical or not. As you can see in the example below, Oman, the UAE and Syria have the same average female life expectancy of 77 years, so are all given a rank of 4. Bahrain is then given a rank of 7, the same rank as it had before we changed the rank type.
Modified Competition
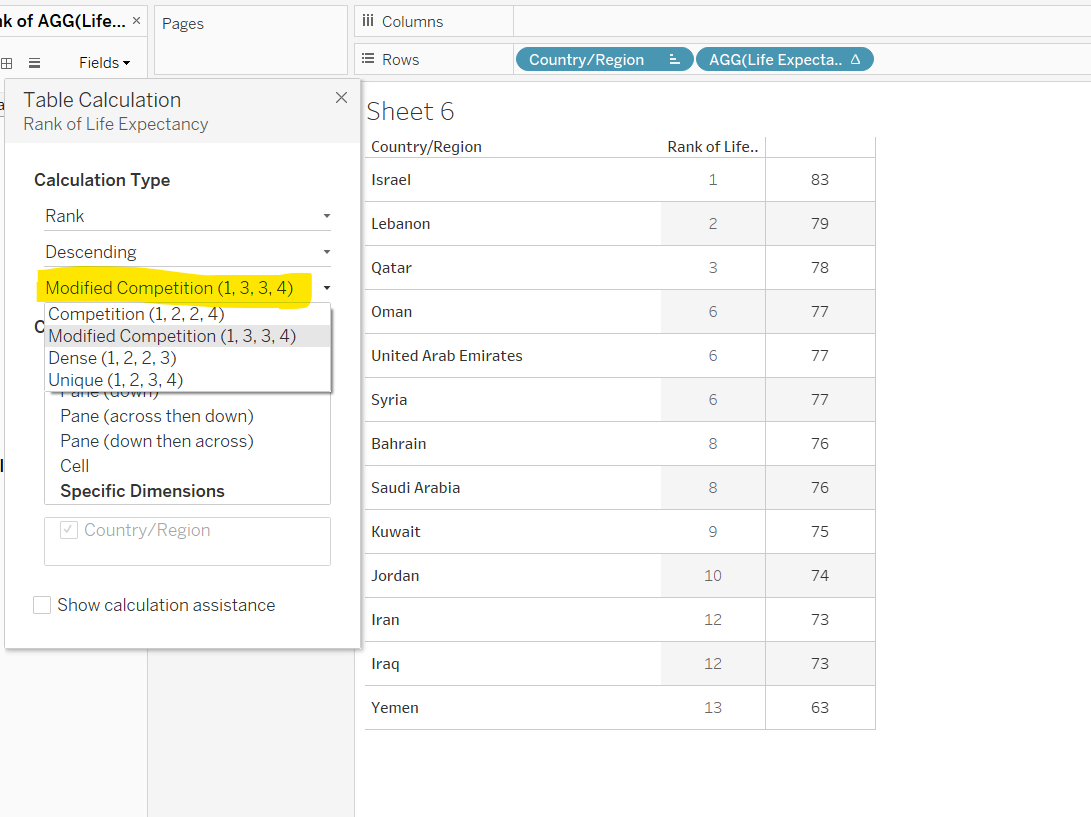
For a modified competition rank type, Tableau also assigns identical values the same rank. However, instead of giving them the rank number following that of the value which came before, Tableau looks at the last place of the the identical values, and assigns them all that rank. For example, if the identical values were following an item ranked 3, but came before an item ranked 7, then instead of all being ranked 4, they would be ranked 6. You can see this in the following example:
Dense
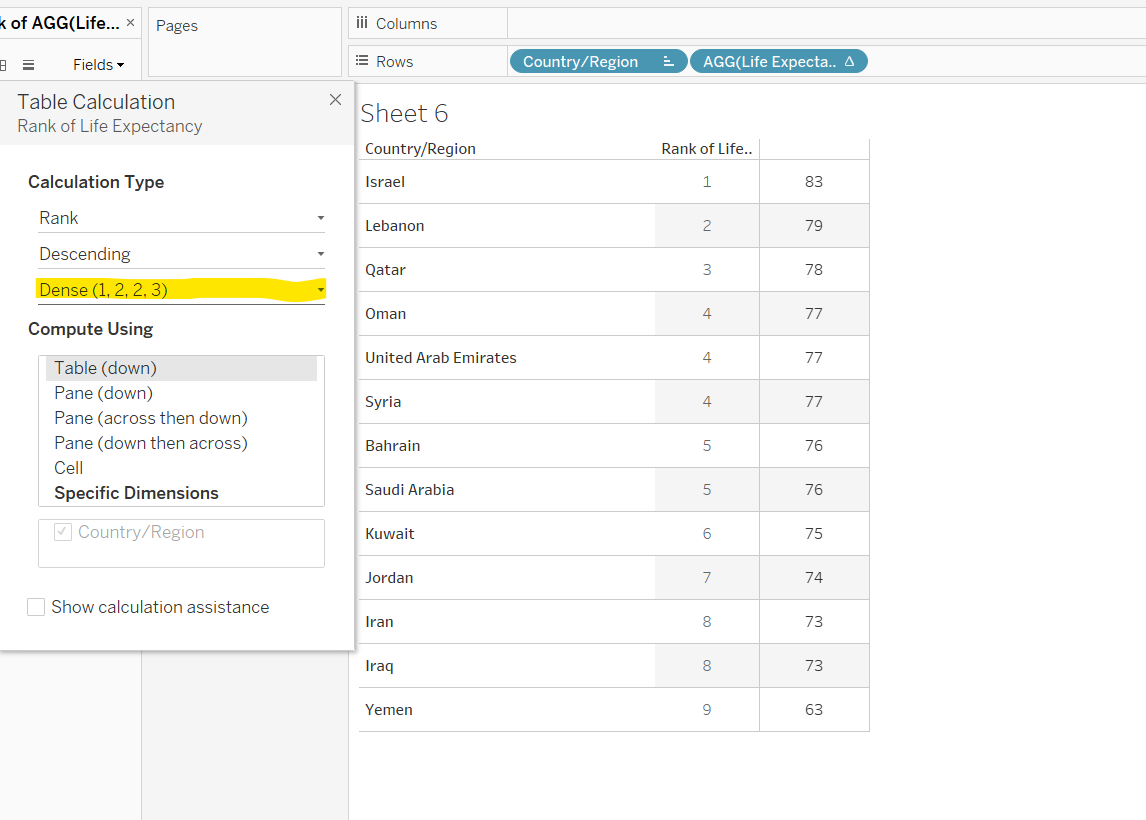
In a dense rank, all identical values are assigned the same rank, which will be the next number in the sequence, i.e. if the number before was 2, then the identical values will all be assigned 3. The next value after the duplicate values will continue in the same way. Take a look at the following example:
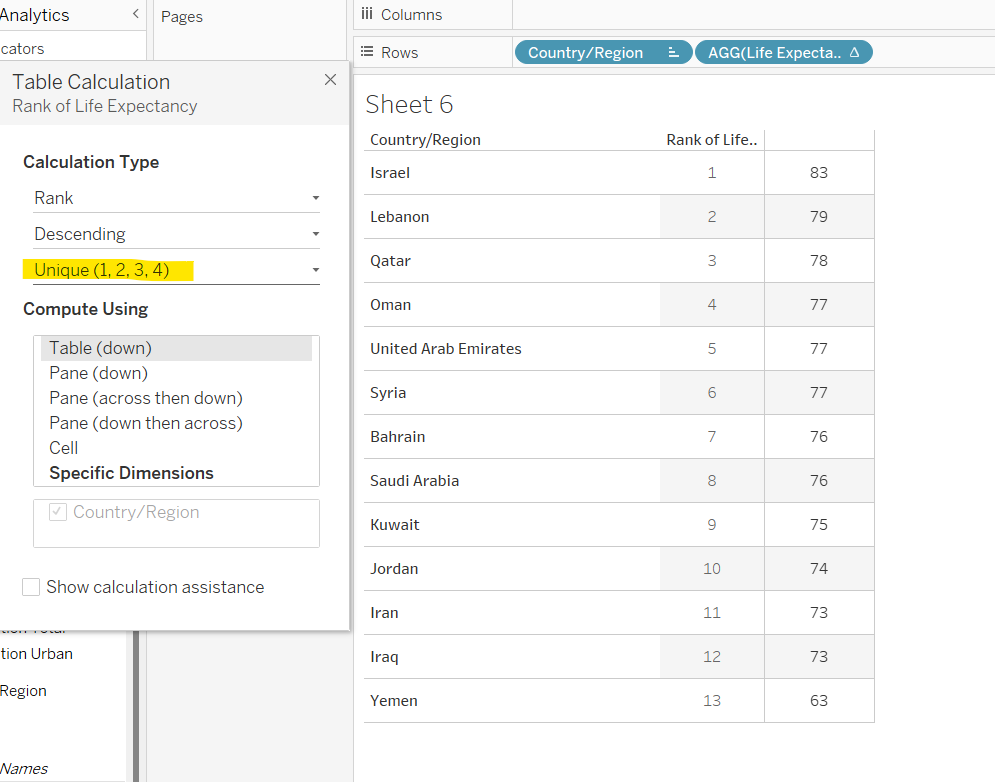
Unique
For the final rank type, Tableau gives all values unique rankings, like so:
And that's it! You've learnt how to create a quick table Rank calculation, and how to edit the calculation by order, and by rank type!
Look out for my next blog in my table calc series which will be on Percentile table calculations!
