This is the fourth blog in my series on Tableau Table Calculations. This time we will be going through Percent of total! As in my previous blogs, the data I will be using is Tableau's Superstore dataset.
What is a Percent of Total calculation?
In a Percent of Total calculation, tableau works out a value as a percentage of the total of all values in a view. This basically allows you to work out what portion of a total value, a chosen category makes up.
Let's take a look at this in action!
A Percent of Total calculation allows you to take a view from this (pay attention to the values on the bars!):
To this:
Table A shows the total 'Sales' by 'Category' and 'Sub-category'. Table B, looks at the total of sales for the whole view, and works out the % of those sales made up by each subcategory. For example, we can see that, for the total sales for all subcategories, 'Chairs' makes up 14.43% of those sales.
Let's try put this into practice!
Percent of Total - Basic Quick Table Calc
We know what a percent of total calculation is, so let's work on building one using a quick table calculation.
We want to create a pie chart showing the percent of total 'profit', made up by each 'Category'.
Let's start changing our marks card from automatic, to 'Pie Chart'.
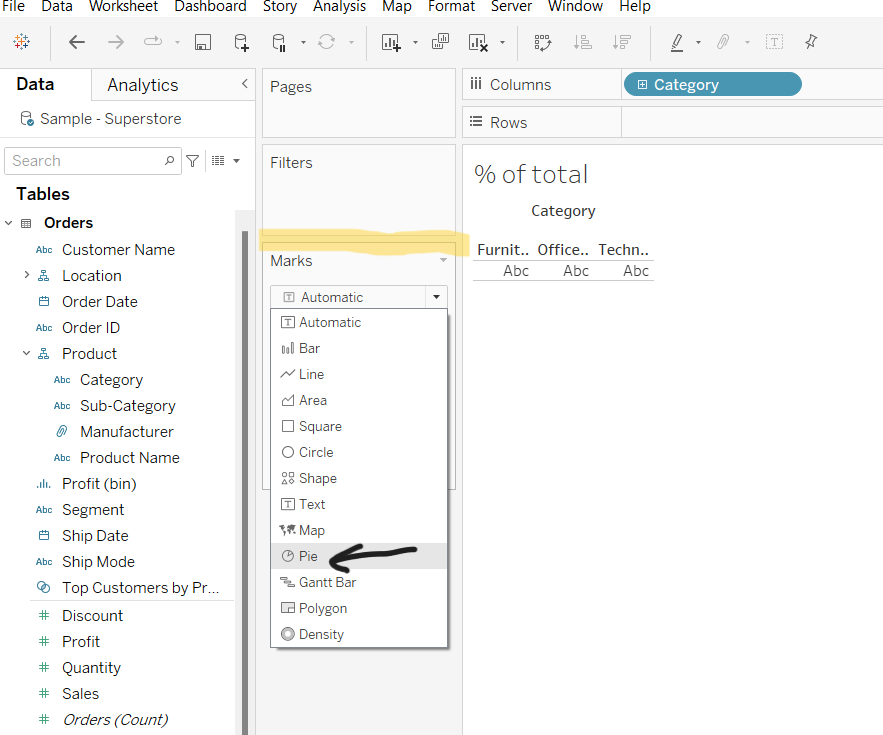
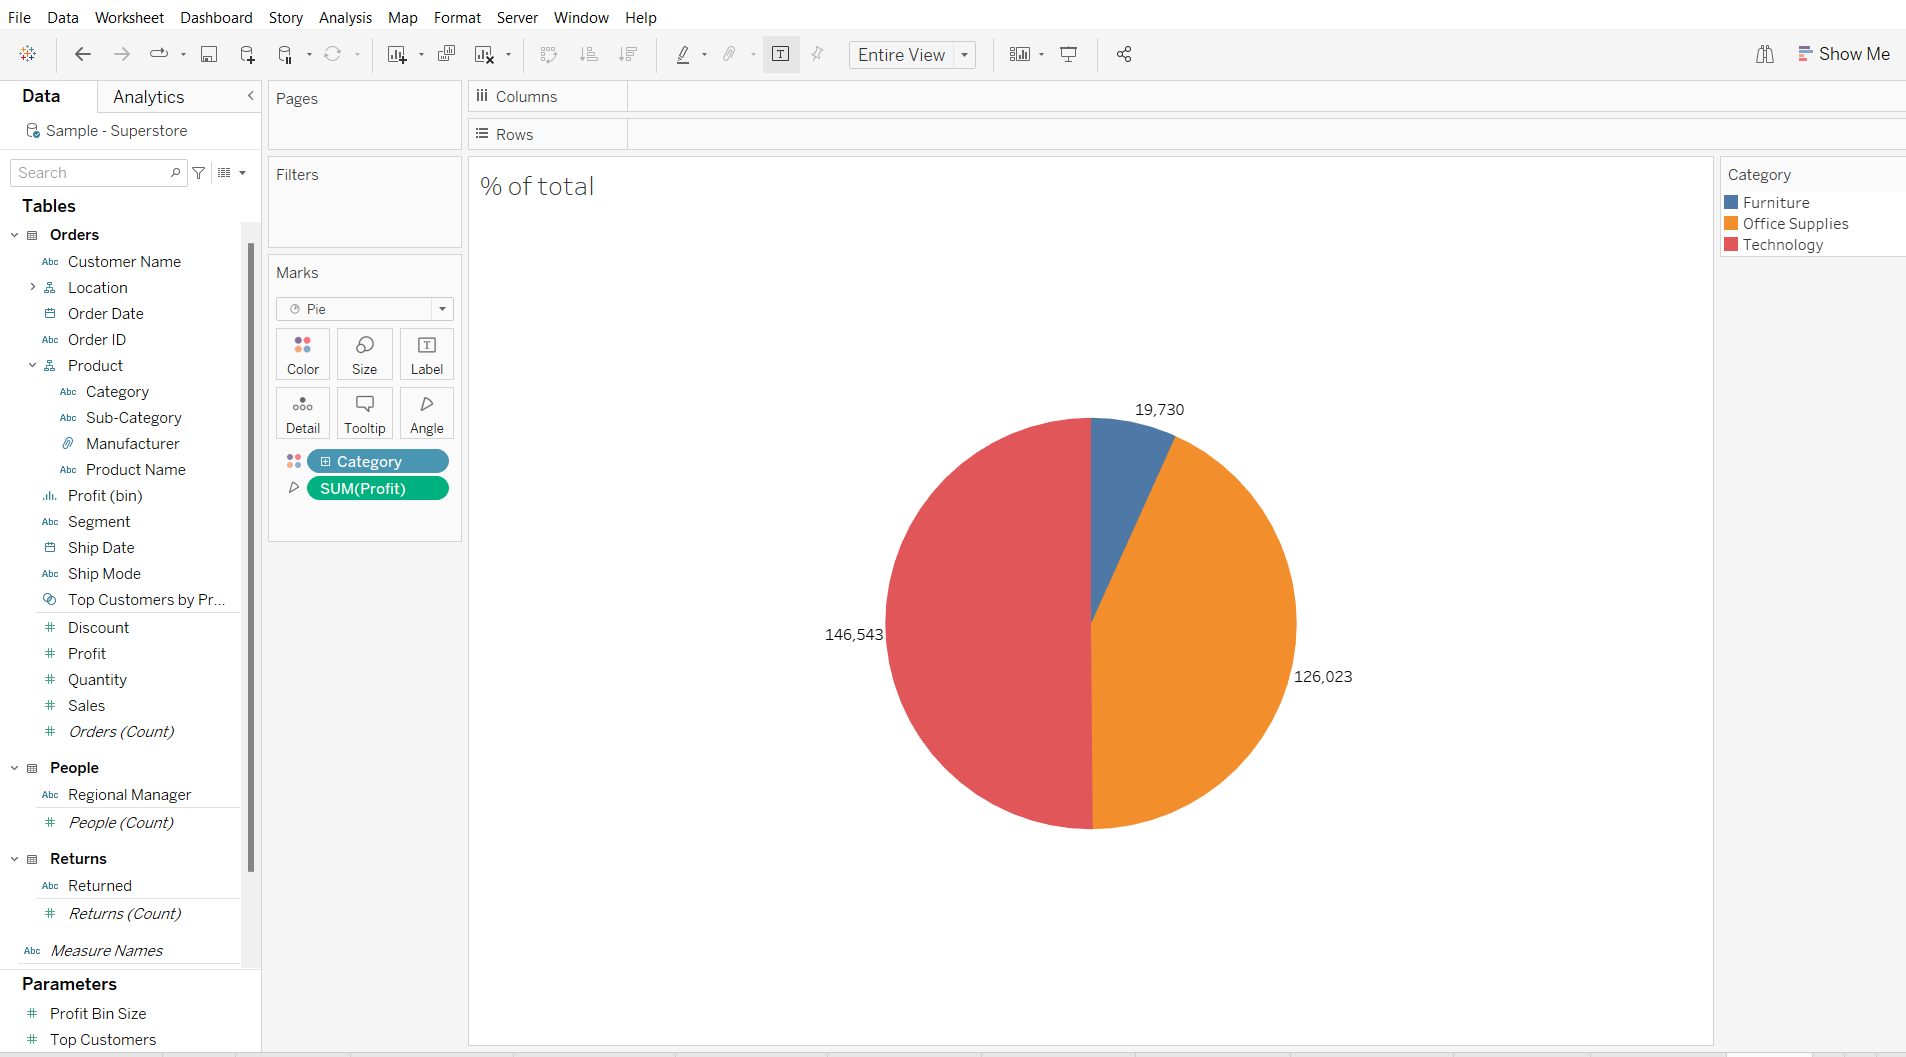
We next want to drag 'Profit' onto 'Angle', and then 'Category' onto 'Color'. Make sure you set the view to 'Entire view' too. Finally, turn on your marks labels. You should now have the following pie-chart:
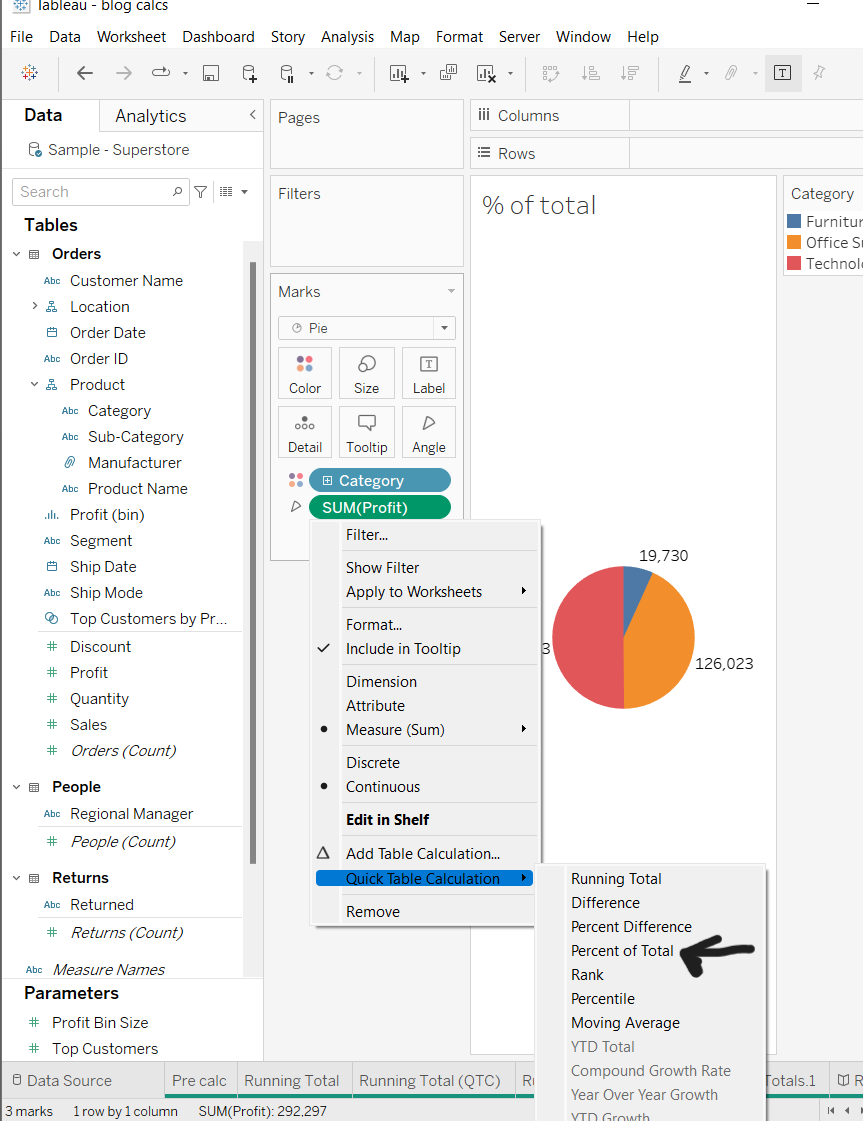
Now to add our quick table calculation. We want to click the drop down menu for our 'Profit' pill, select 'Quick Table Calculation' and then select 'Percent of Total'.
You should now be left with the following view, showing the percent total of Profit, by Category.
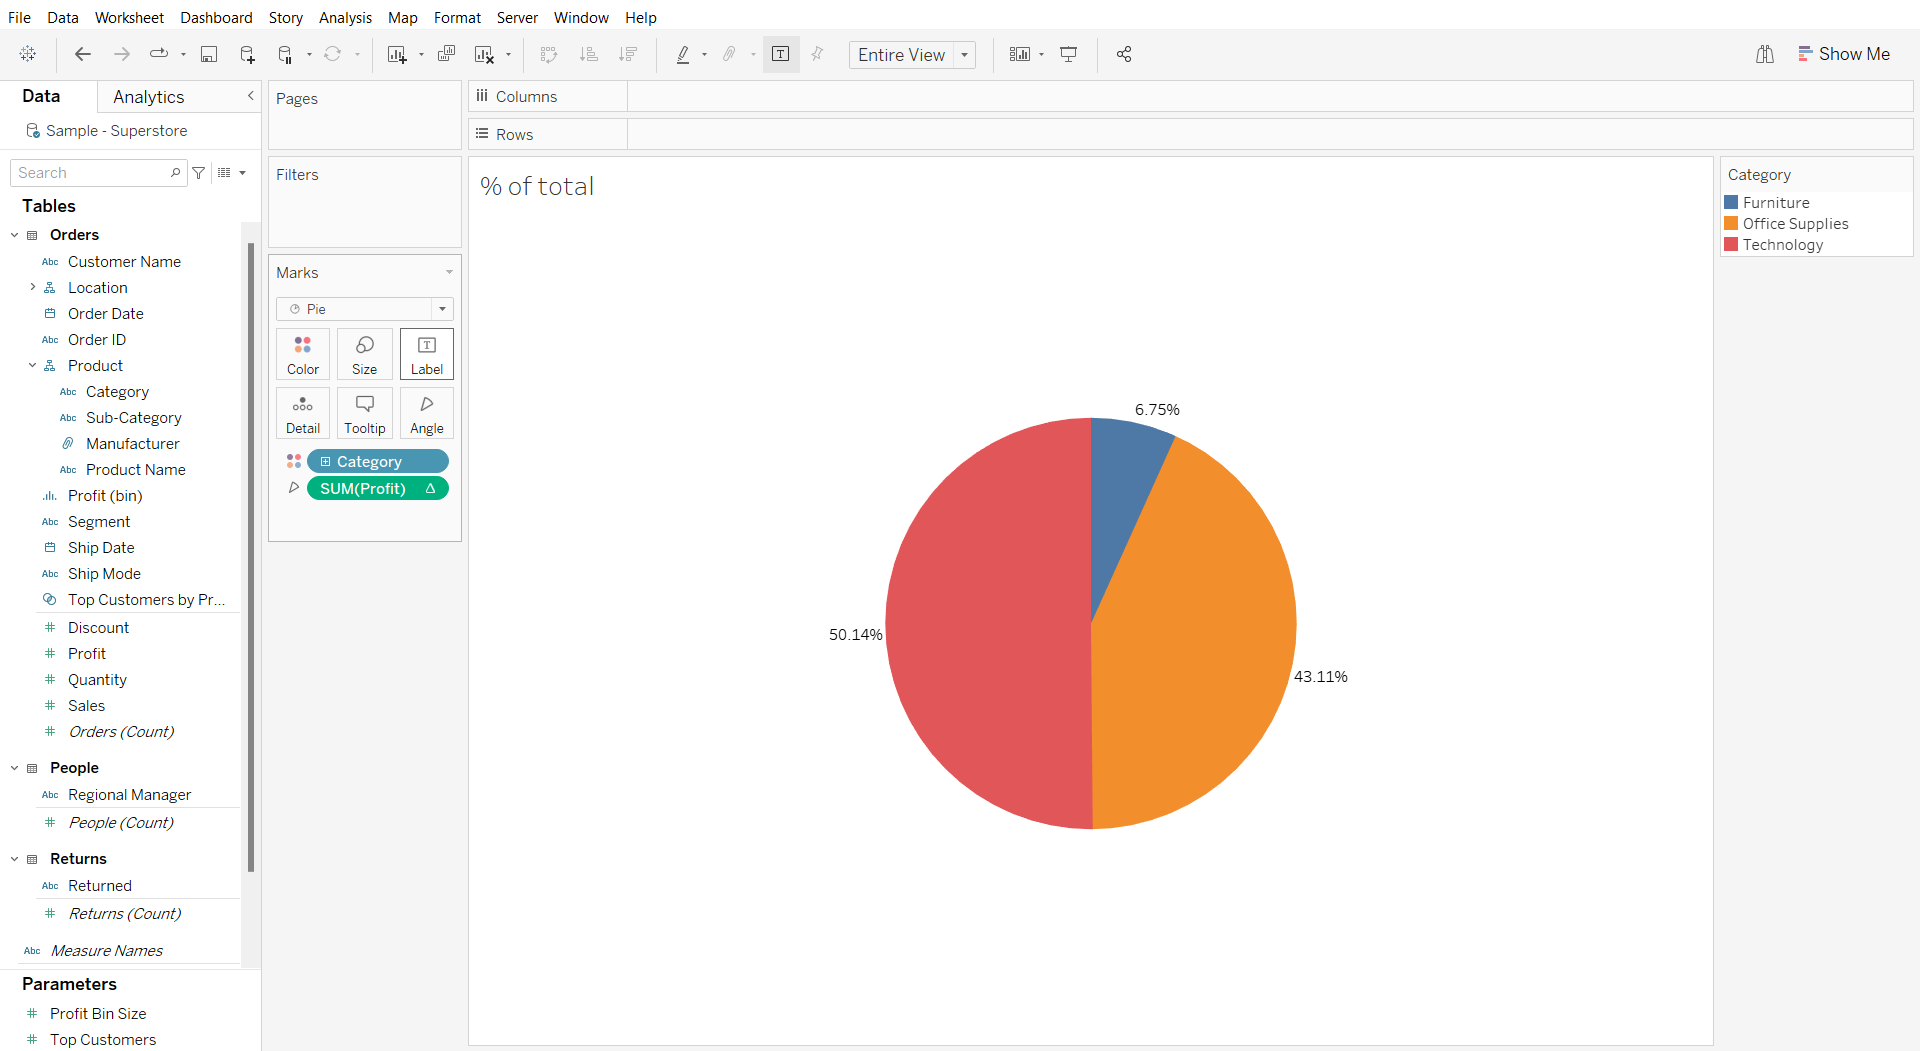
And that's it! You've created a percent of total quick table calculation, using a pie-chart.
Percent of Total - Advanced Table Calc
As I've mentioned in previous blogs, Tableau's quick table calculations are quick and easy, but not very dynamic as they use Tableau's default settings within the calculation. To give us more control over the calculation, we can edit the quick table calculation and tell tableau how we want it to operate.
We can do this by changing the partitioning of our view.
Let's take the following example where we have a percent total of profit by 'Category' and 'Segment':
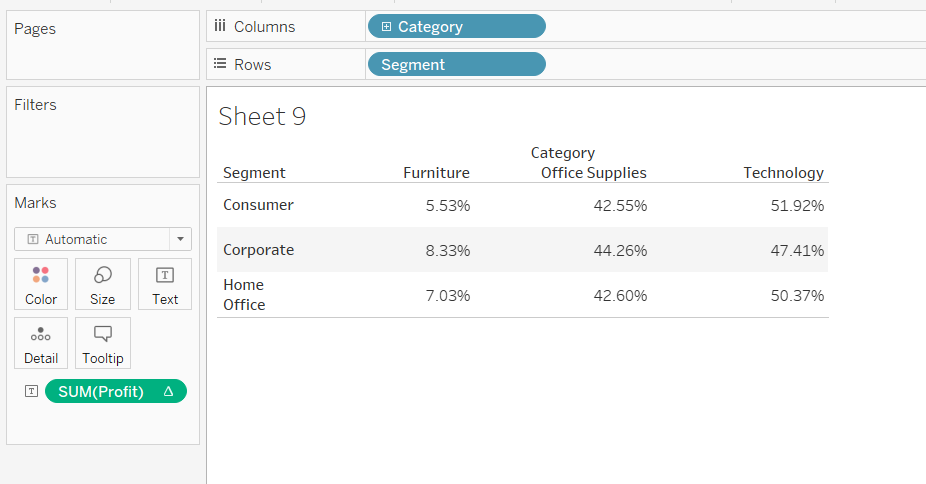
By clicking the drop-down menu on our Profit pill, and selecting 'Edit Table Calculation'. You will be presented by the following options:
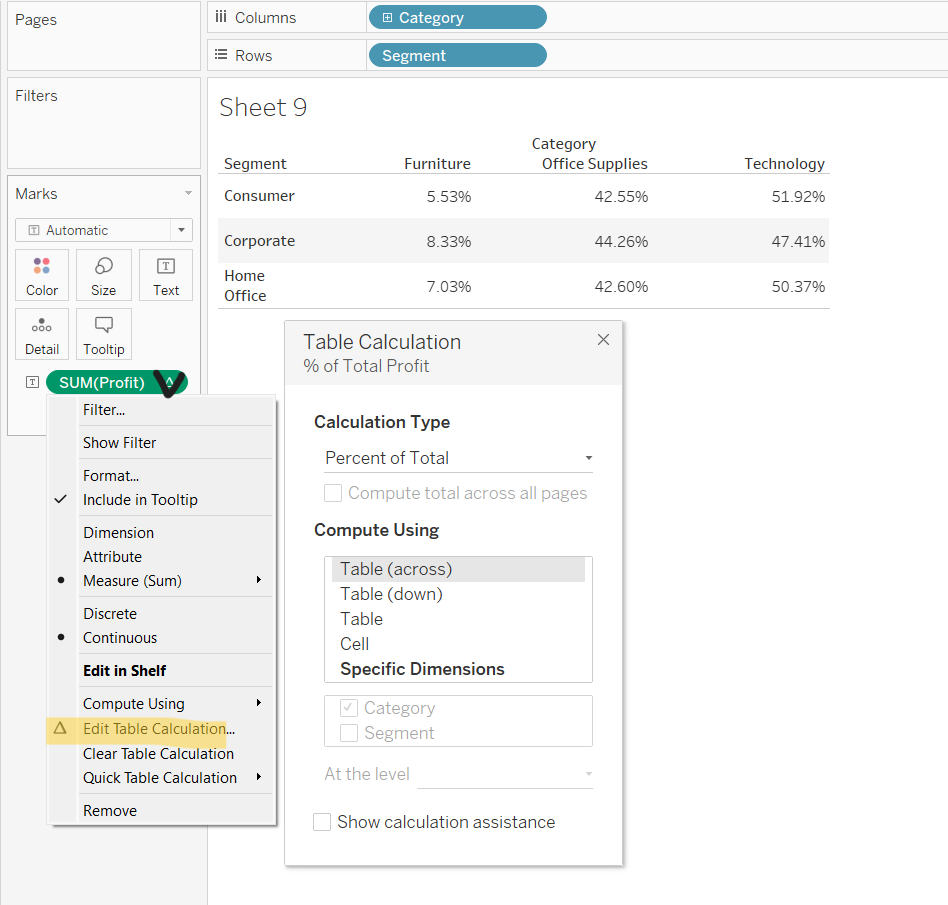
The 'Compute Using' section allows us to change how the table calculation runs.
Table Across
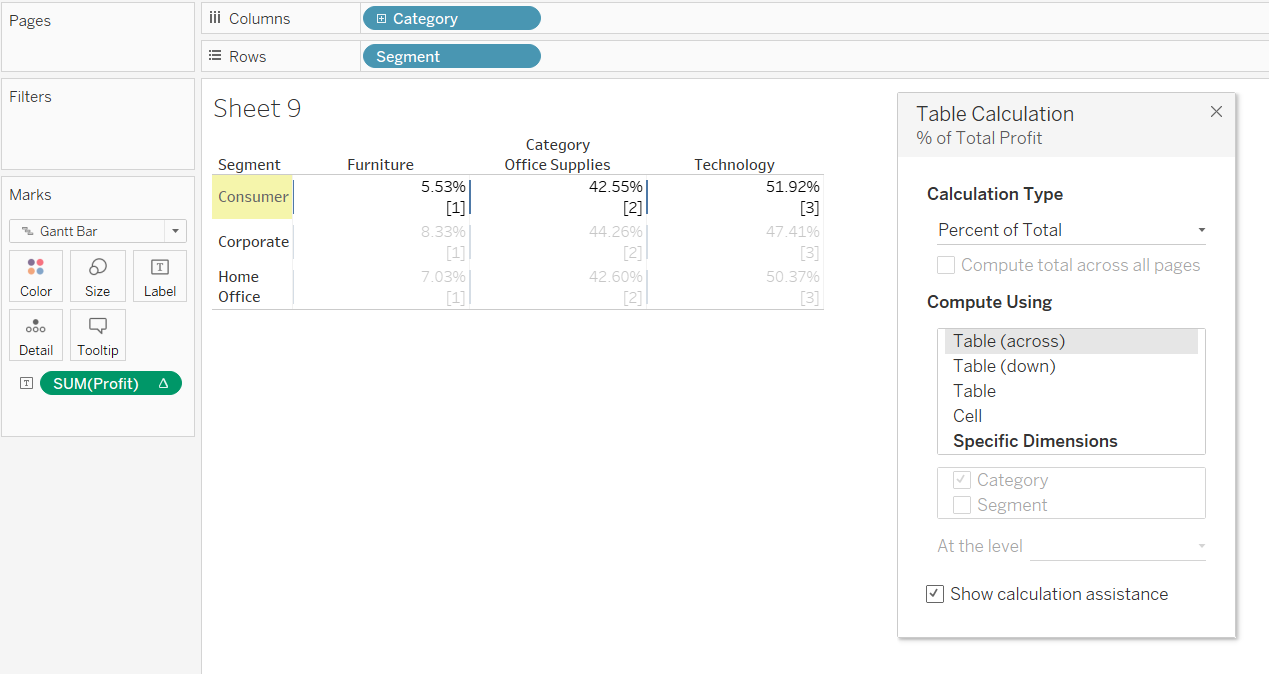
Selecting 'Table (across)' means that Tableau works out the percent of total calculation, by going left to right for a single row, looking at this as a whole, and working out the percent of total each value in that row makes up. It then goes to the next row and starts again.
Table Down
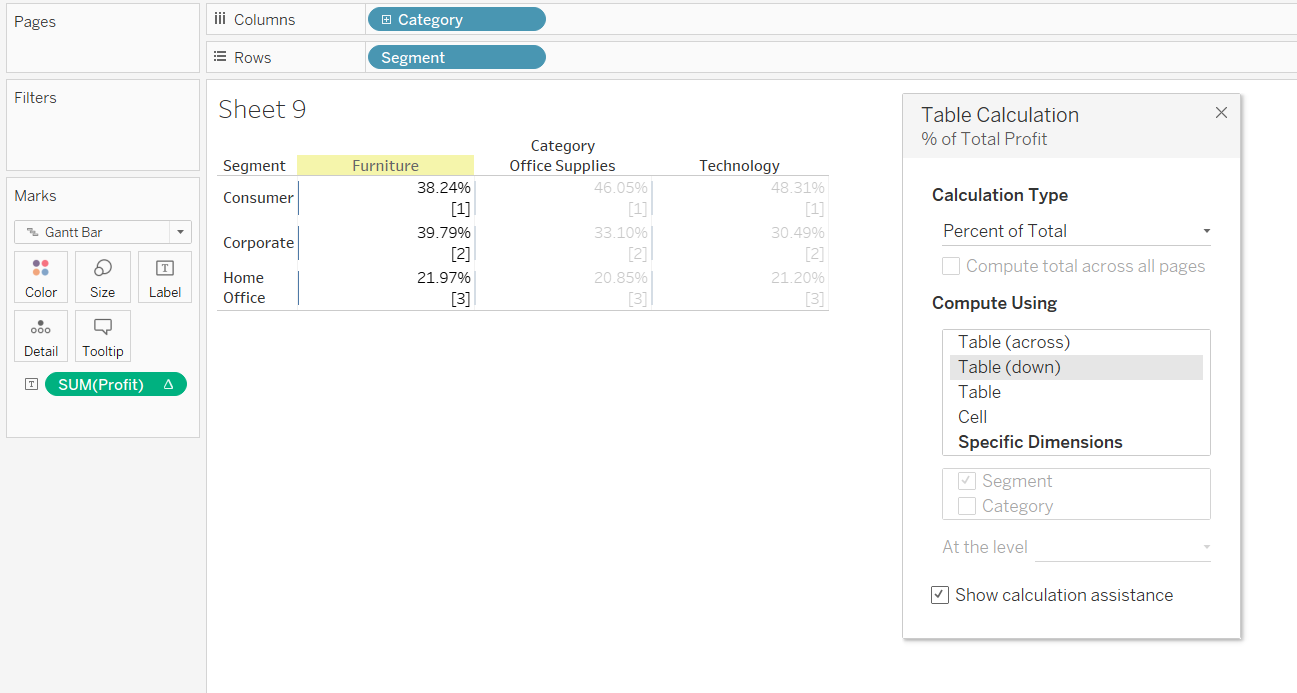
Selecting 'Table (down)' means that Tableau works out the percent of total calculation, by going top to bottom for a single column, looking at this as a whole, and working out the percent of total each value in that column makes up. It then goes to the next column and starts again.
Table (default settings)
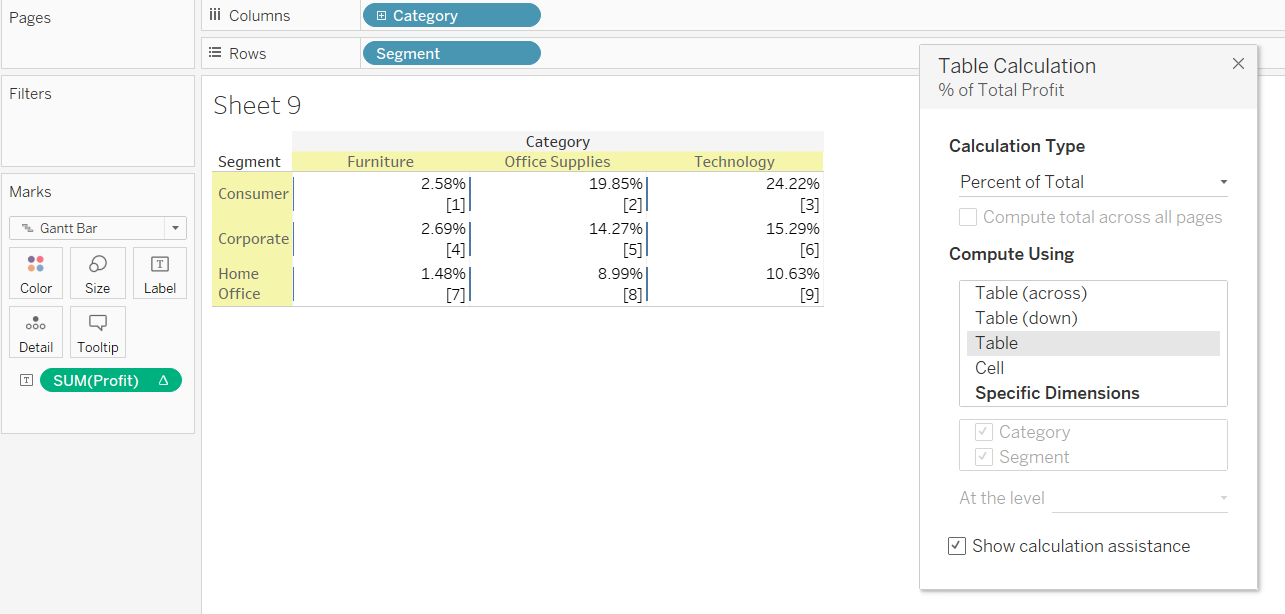
Selecting 'Table' means that Tableau works out the percent of total calculation, by going from left to right, top to bottom, and looking at the whole table as a whole, working out the percent of total each value in the whole table makes up.
Cell
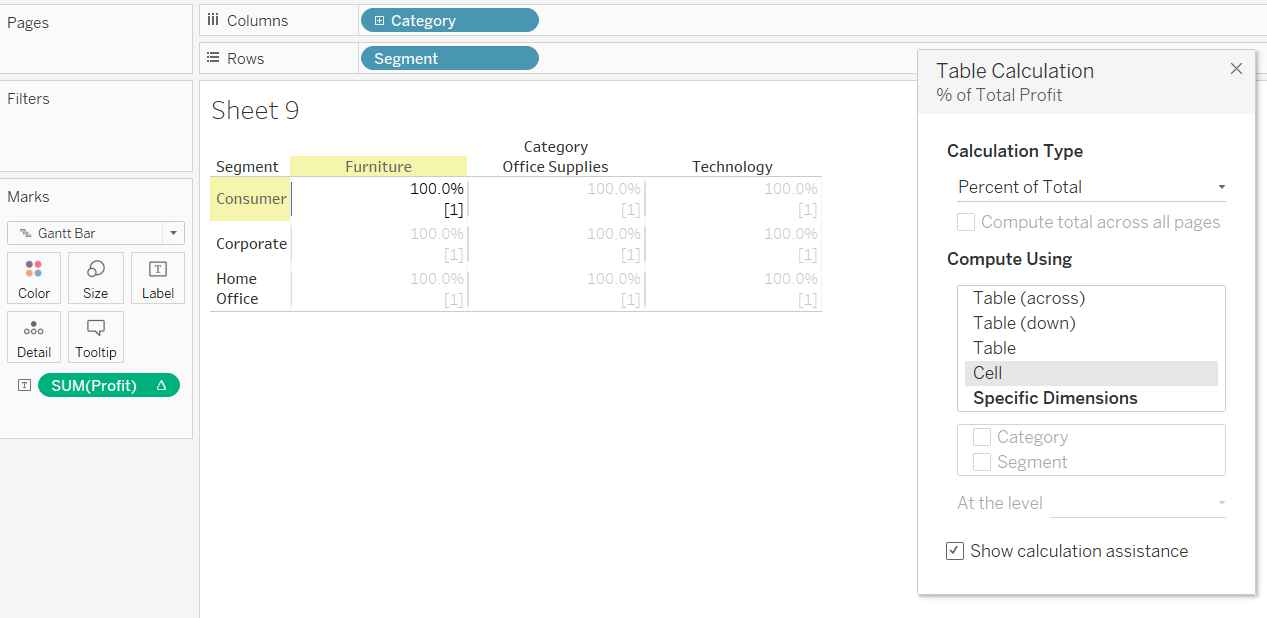
Selecting 'Cell' means that Tableau works out the percent of total calculation by looking at an individual cell as a whole. This means that each cell's value represents 100% of itself.
3, 2, 1, Action!
Now lets put this partitioning into practice. We want to build three pie charts showing the percent total of profit, by Category, for each Segment.
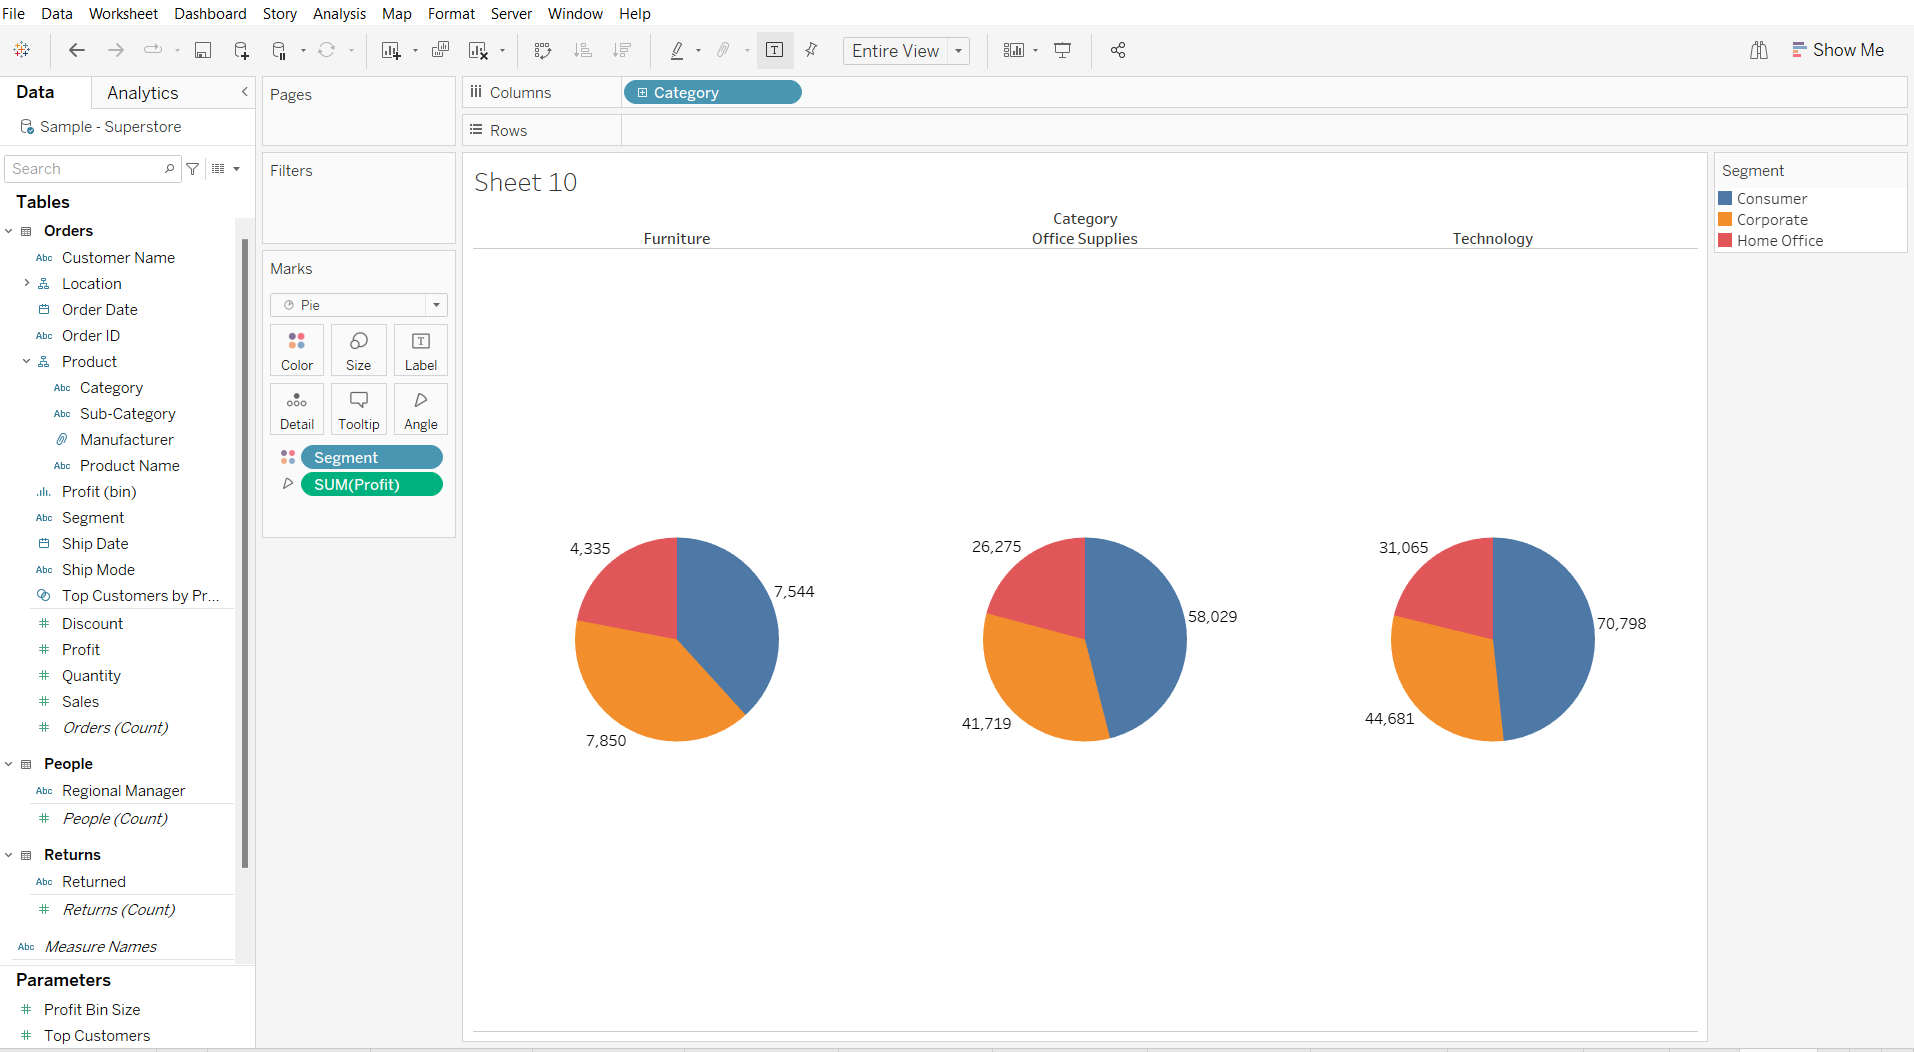
We're going to start by dragging 'Category' into the columns bar, changing the marks card from automatic to 'Pie Chart', then dragging 'Profit' onto 'Angle', and 'Segment' onto 'Color'. Put on the marks labels and make the graph 'Entire View'. You should have the following view:
We now want to add our quick table calculation, as before, by clicking the drop down menu and selecting 'Quick Table Calculation' and 'Percent of Total'. You should now have this view:
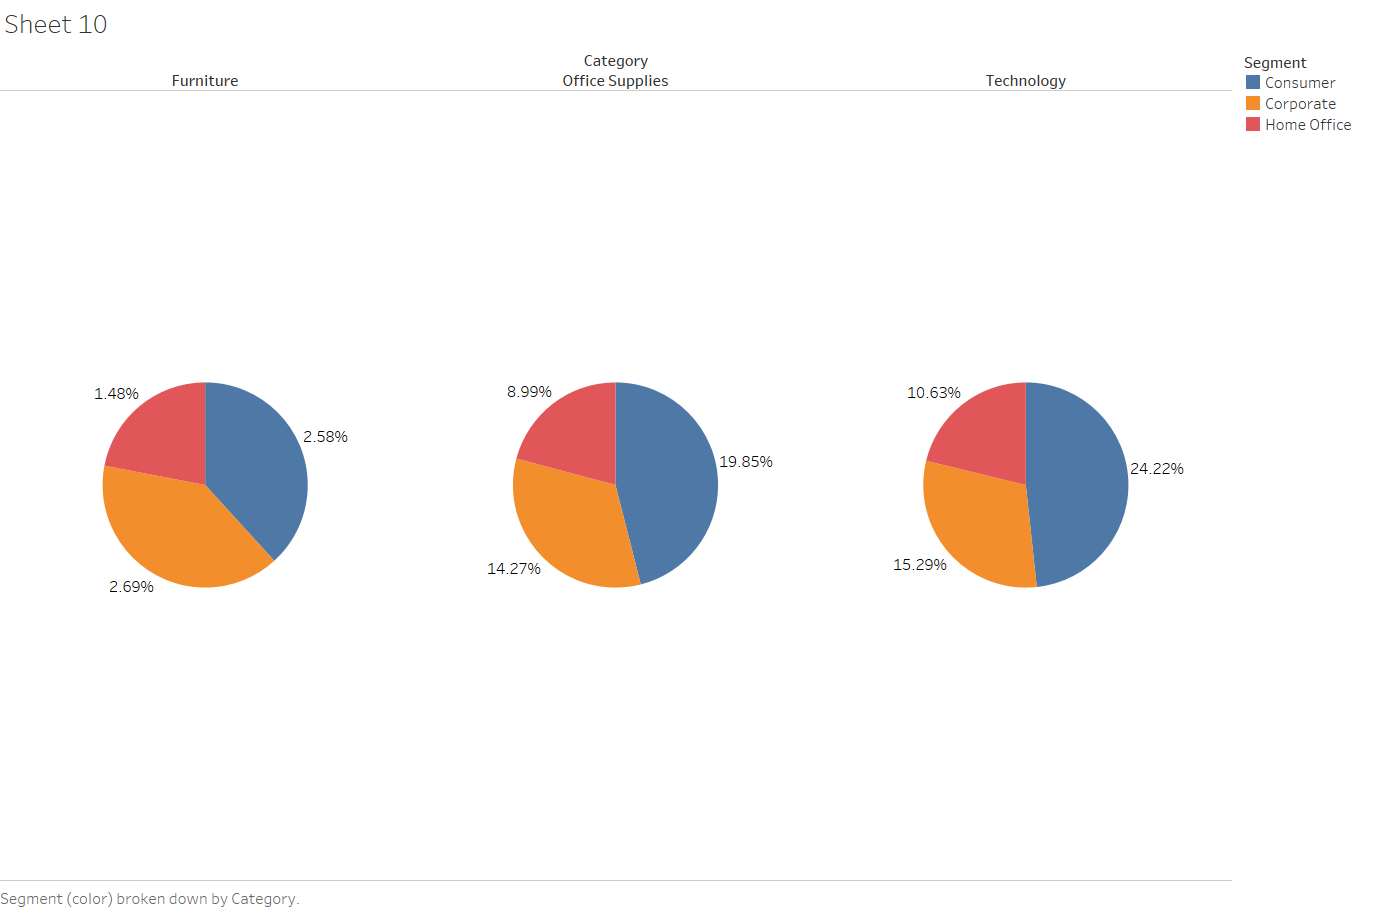
Here, using the Tableau default settings, the percent of total calculation is being applied to the whole view, and is showing us the percent total of profit for all categories, made up by each segment. I.e. the percentages for all three pie charts adds up to 100%.
We want to change this view so that each category is considered a whole, meaning the percent of total for each pie chart is 100%.
To do this, we need to select the drop down menu on our 'Profit' pill, select 'Edit quick table calculation', and choose 'Table (down). This will mean that Tableau looks at each column, i.e. each category, and works out the percent of total for each segment, before moving on and restarting for the next column.
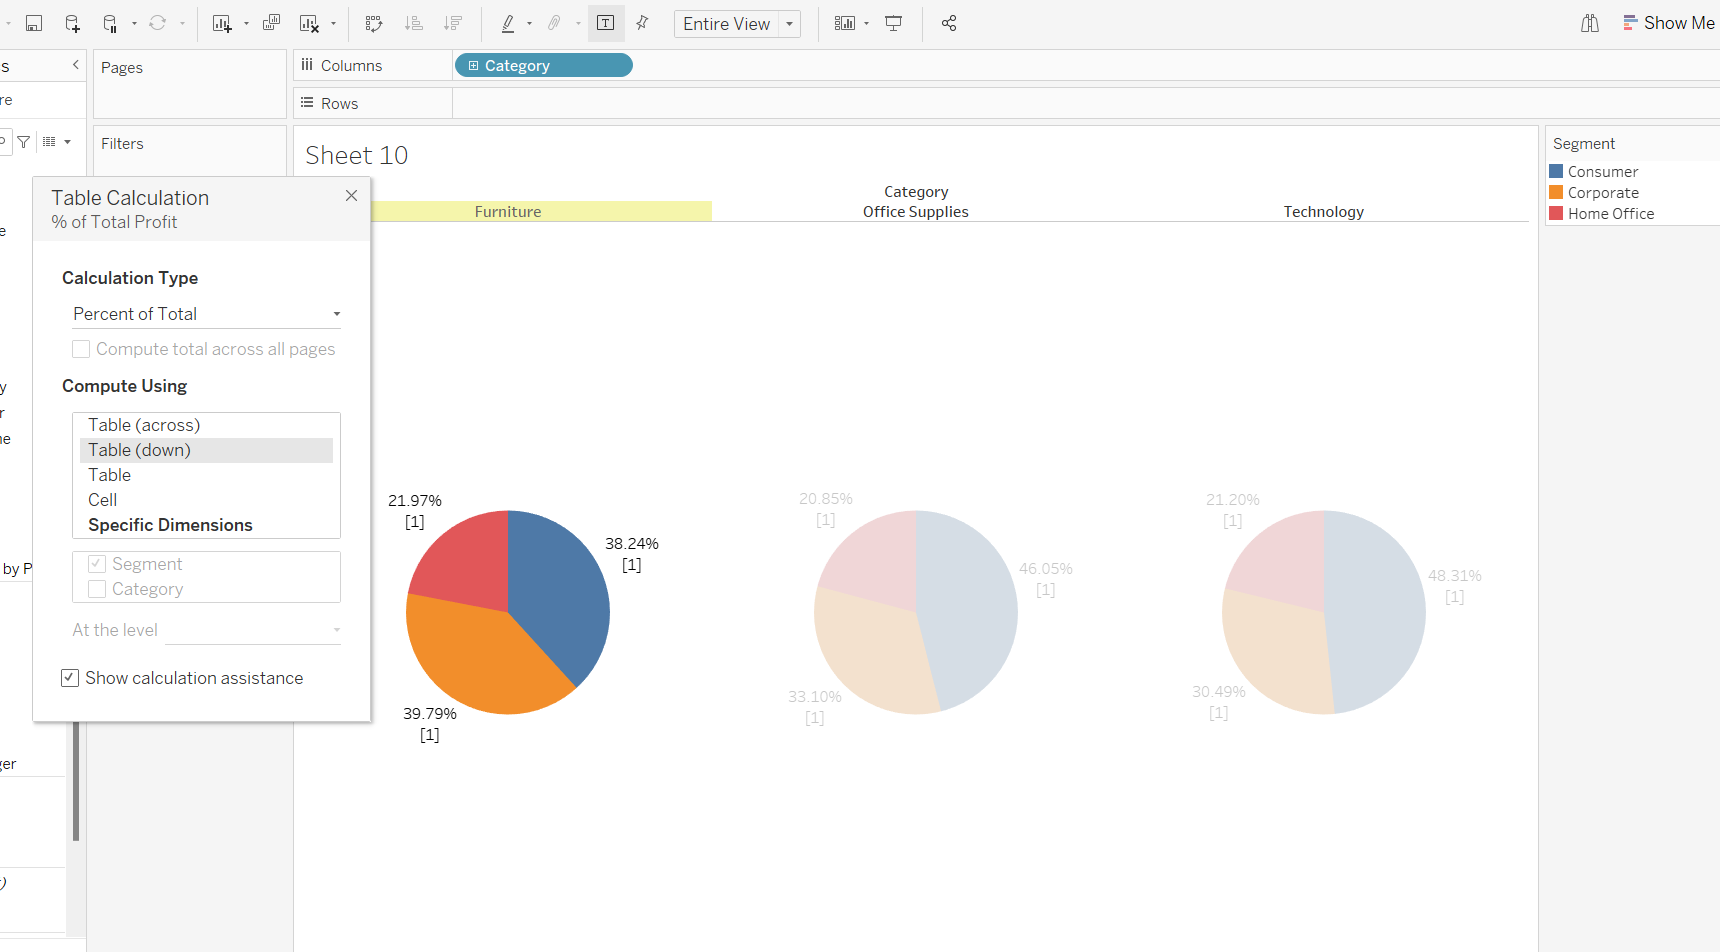
Tidy up your view by changing the colors, adding a title, and formatting the text, and you should be left with something like this:
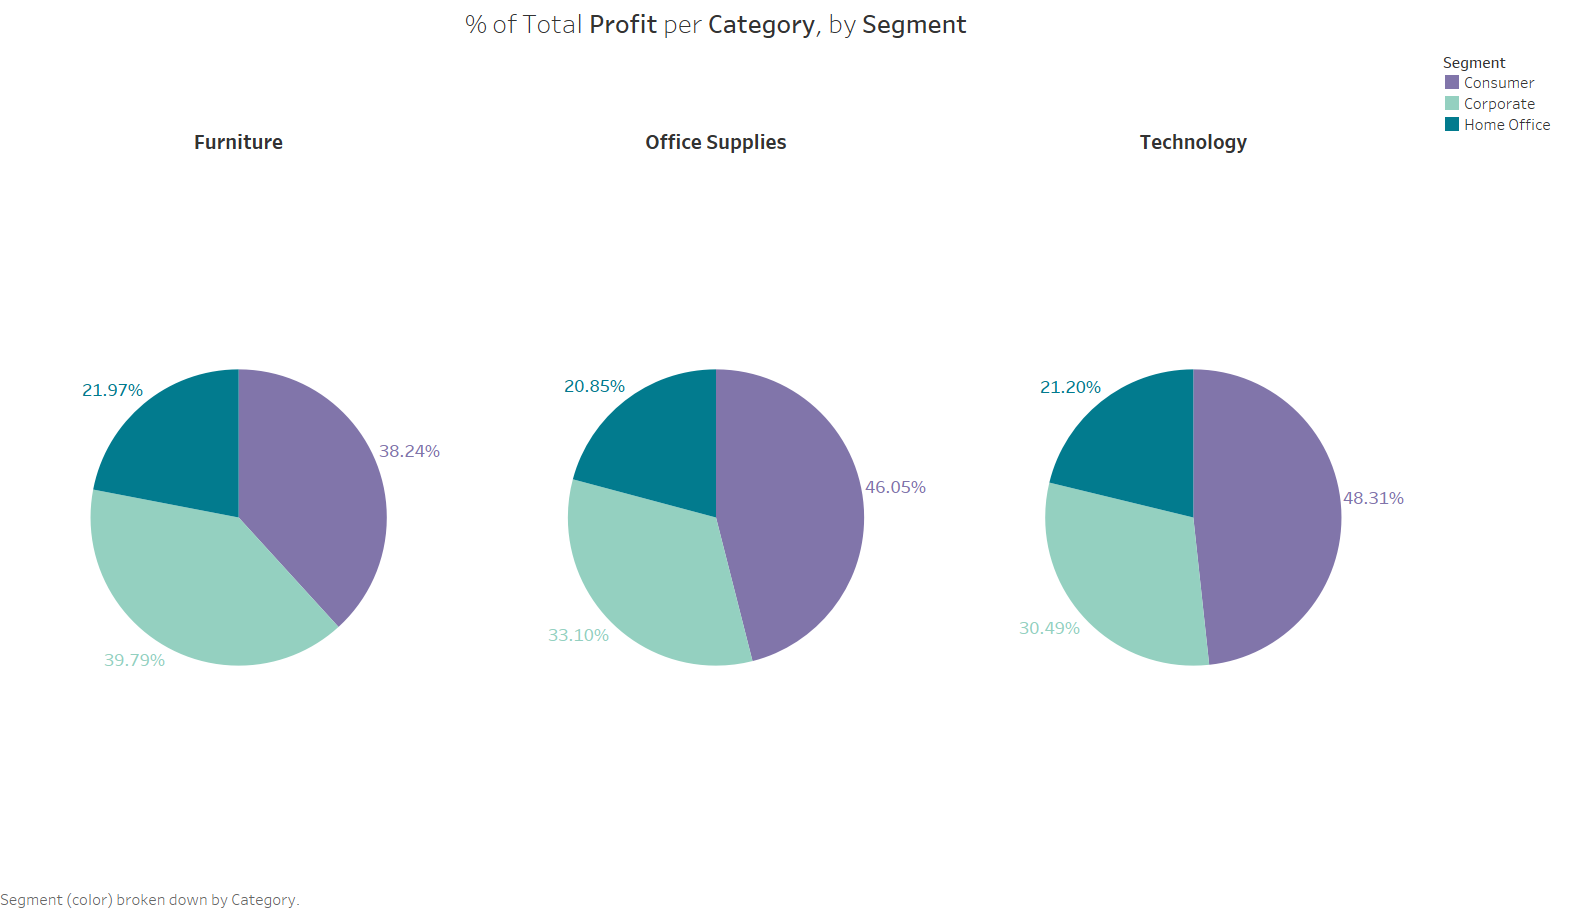
And that's it! You're learnt how to create a percent of total quick table calculation, and edit it using partitioning.
Stay tuned for my next blog on 'Rank' calculations!
