


This is the third blog in my series on Tableau Table Calculations. This time we will be going through Percent Difference. As in my previous blogs, the data I will be using is Tableau's Superstore dataset.
What is a Percent Difference calculation?
In a Percent Difference (from) calculation, Tableau works out the percentage difference from a specified value B compared to another specified value A. For example, say value A was 2, and value B was 5. The difference between value A and B is 3, which is 150% greater than Value A - 2. This means that the percent difference from Value A to Value B would be 150%.
Let's look at this in action!
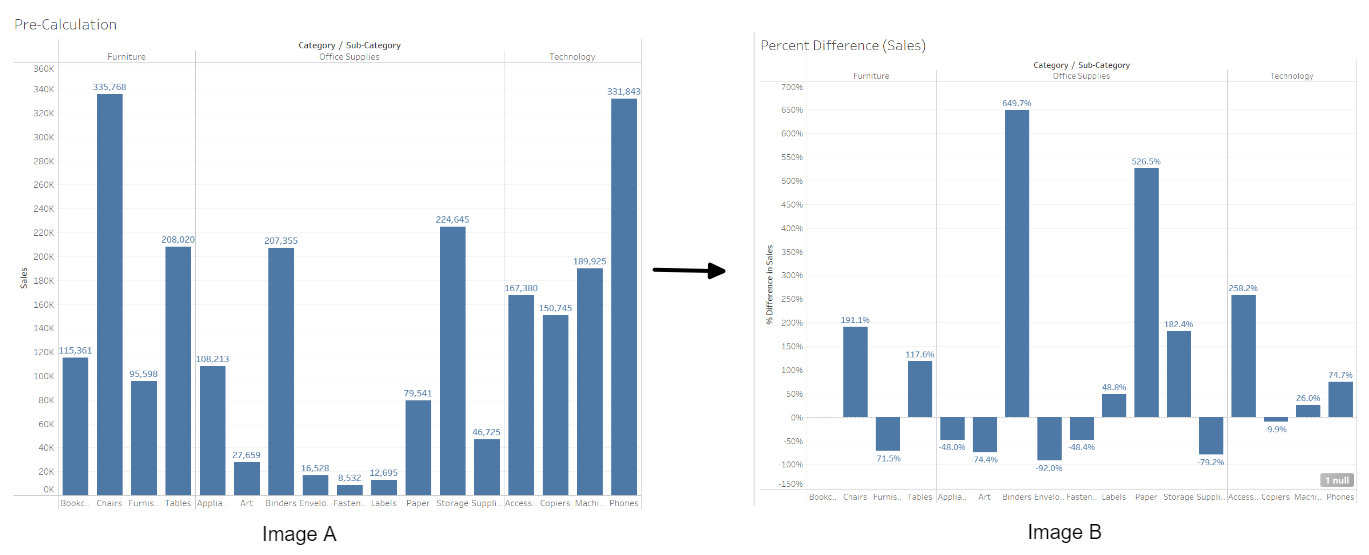
In the example above, a percent difference calculation is applied to the sum of sales, which is split by category and subcategory. In Image A, each bar shows the sub of sales for each subcategory. Once the calculation has been applied in Image B, each bar now shows the percent difference of total sales, between each subcategory and the one that came before it.
Let's break this down to understand what this really means.
Looking at Table A we see the sum of sales for 'Paper' is 79,541, and the sum of sales for 'Labels' is 12,695. To visualize the difference between these values, let's look the same view with a Difference calculation applied to it:
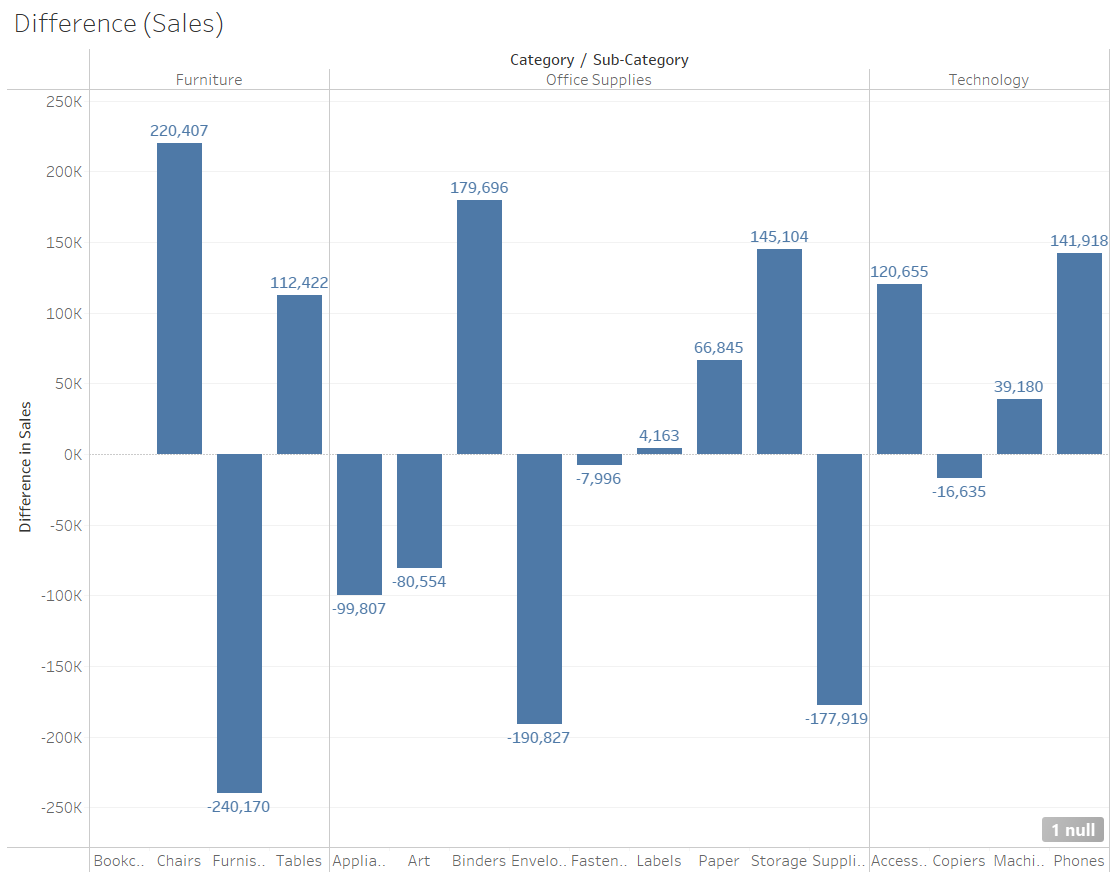
So, we can see that the difference between the sum of sales for 'Paper' and 'labels' is 66,845. The percent difference table calculation basically takes this number, and works it out as a percentage difference relative to the sum of sales value for 'Labels' in Table A, which was 12,695. This calculation looks as follows:
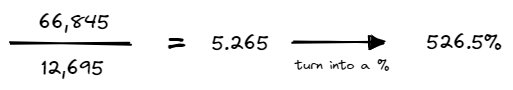
Looking at Table B we see that the percent difference in total sales between 'Paper' compared to 'Labels' is 526.5%, the same figure we have just worked out using the difference in sales!
Percent Difference - Basic Quick Table Calc
Now we've got an understanding of what a percent difference quick table calculation does, let's move on to creating one.
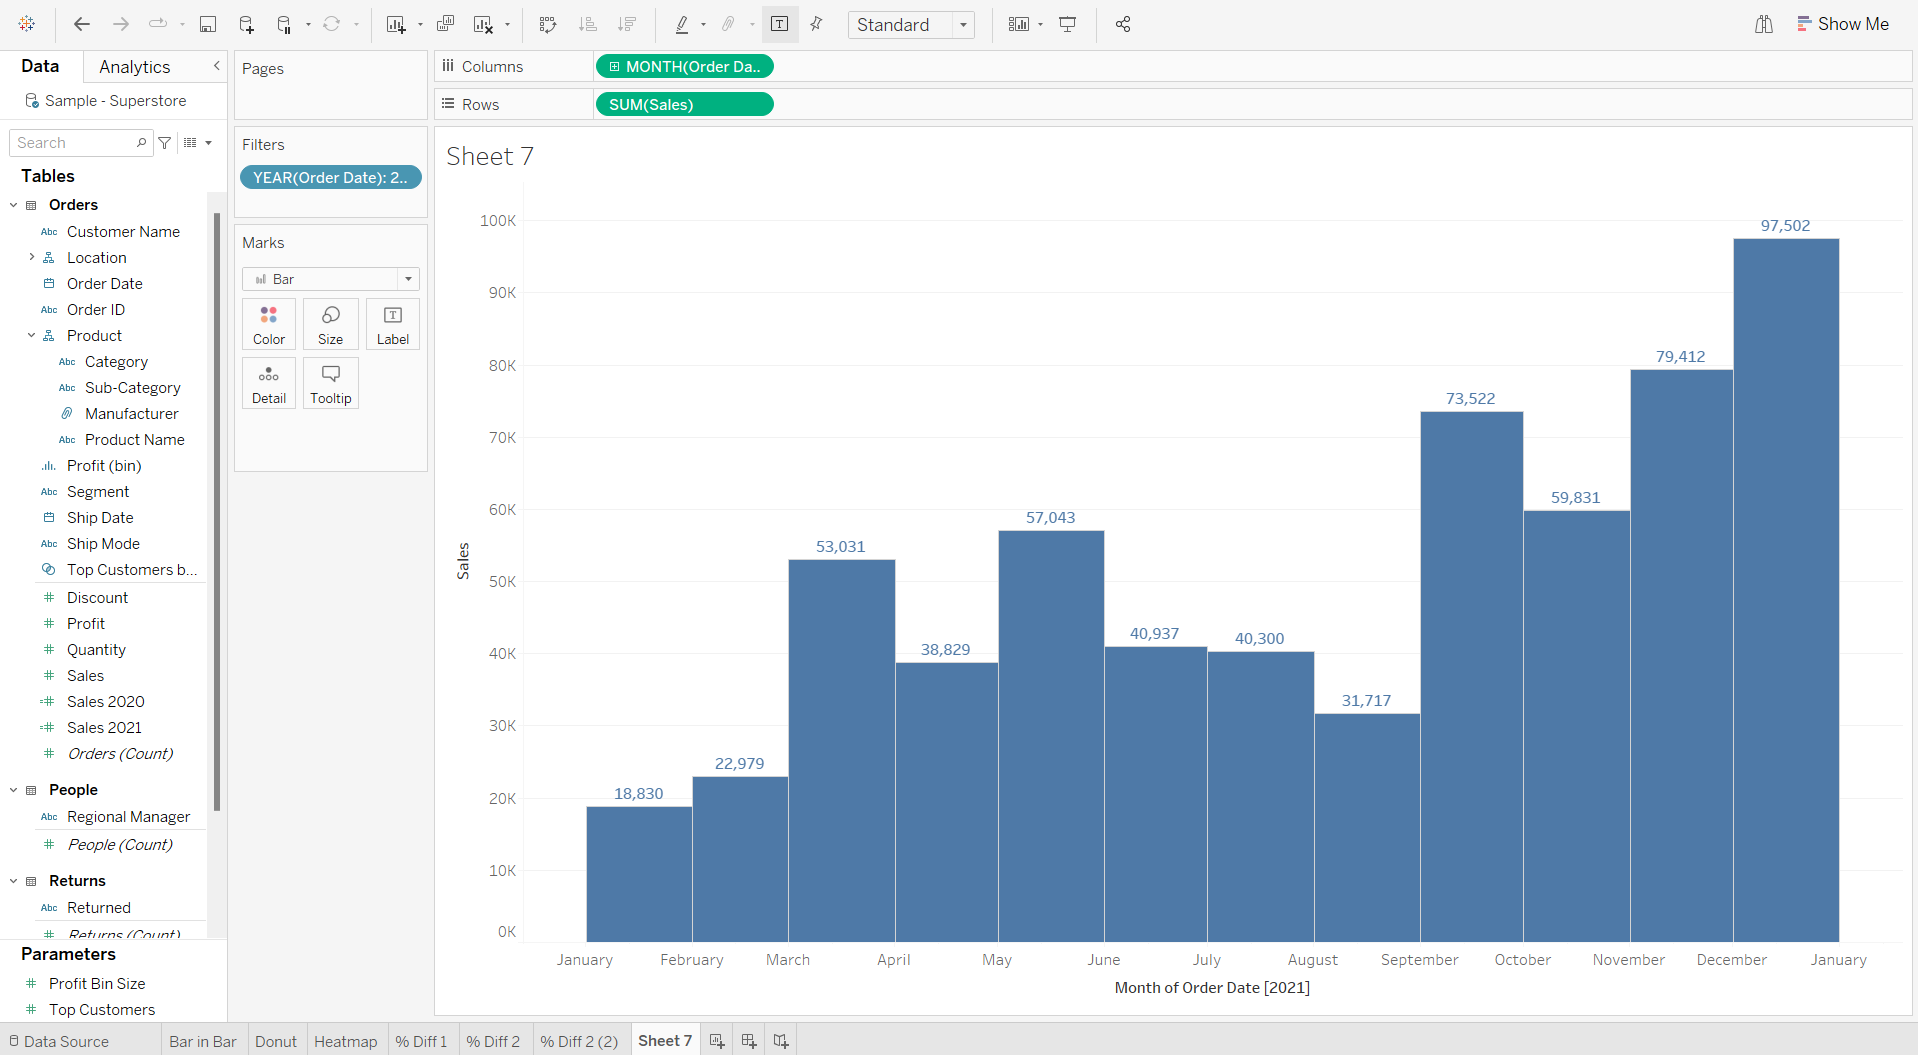
Let's say we want to look at the percent difference in sales by month, for 2021.
First we need to right drag 'Order Date' into the column bar, selecting continuous months. Drag 'Order Date' into the filters tab, select 'Years' and select '2021'. Next, drag 'Sales' into the rows bar, and make sure it's set to SUM(Sales). Change the graph type to 'Bar' in the marks card, and turn on mark labels for the columns. You should have a chart that looks as follows:
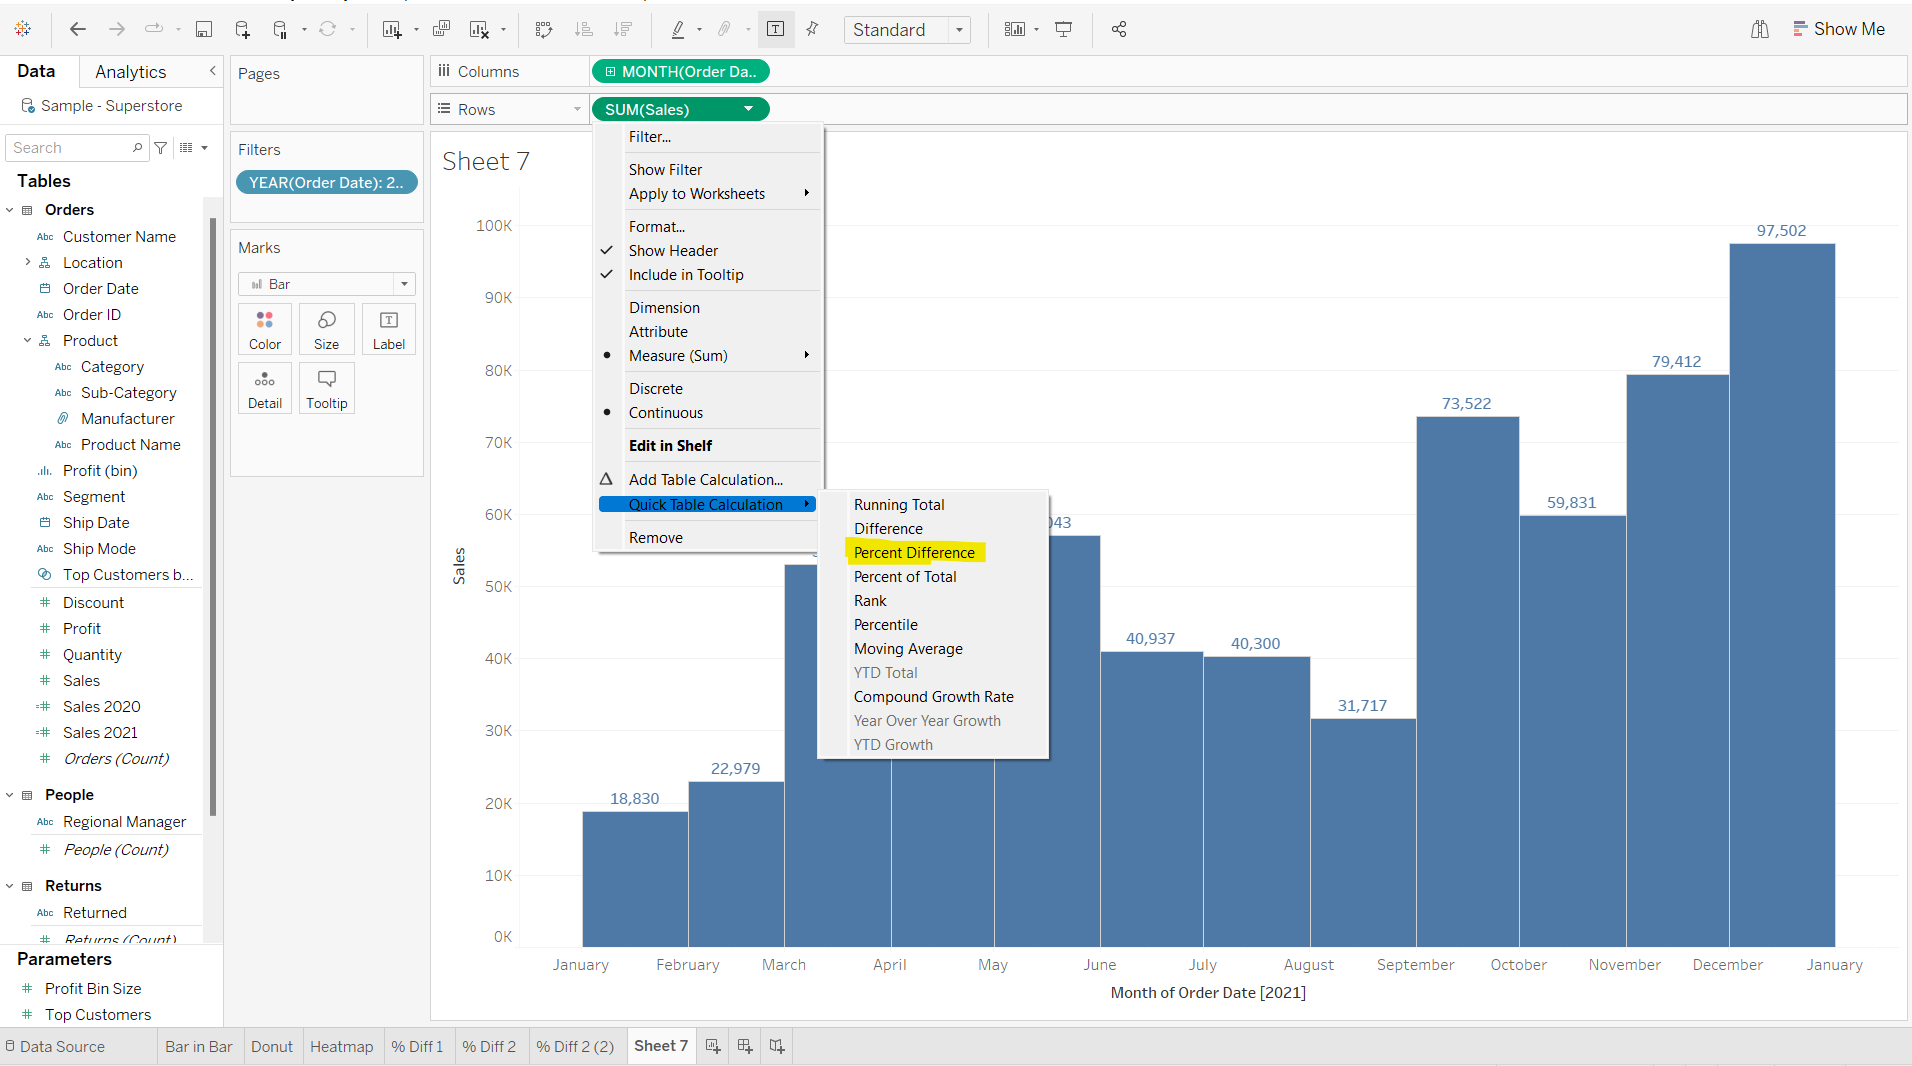
We now want to add in our quick table calculation, by right clicking on the SUM(Sales) pill, selecting 'Quick Table Calculation' and then select 'Percent Difference'.
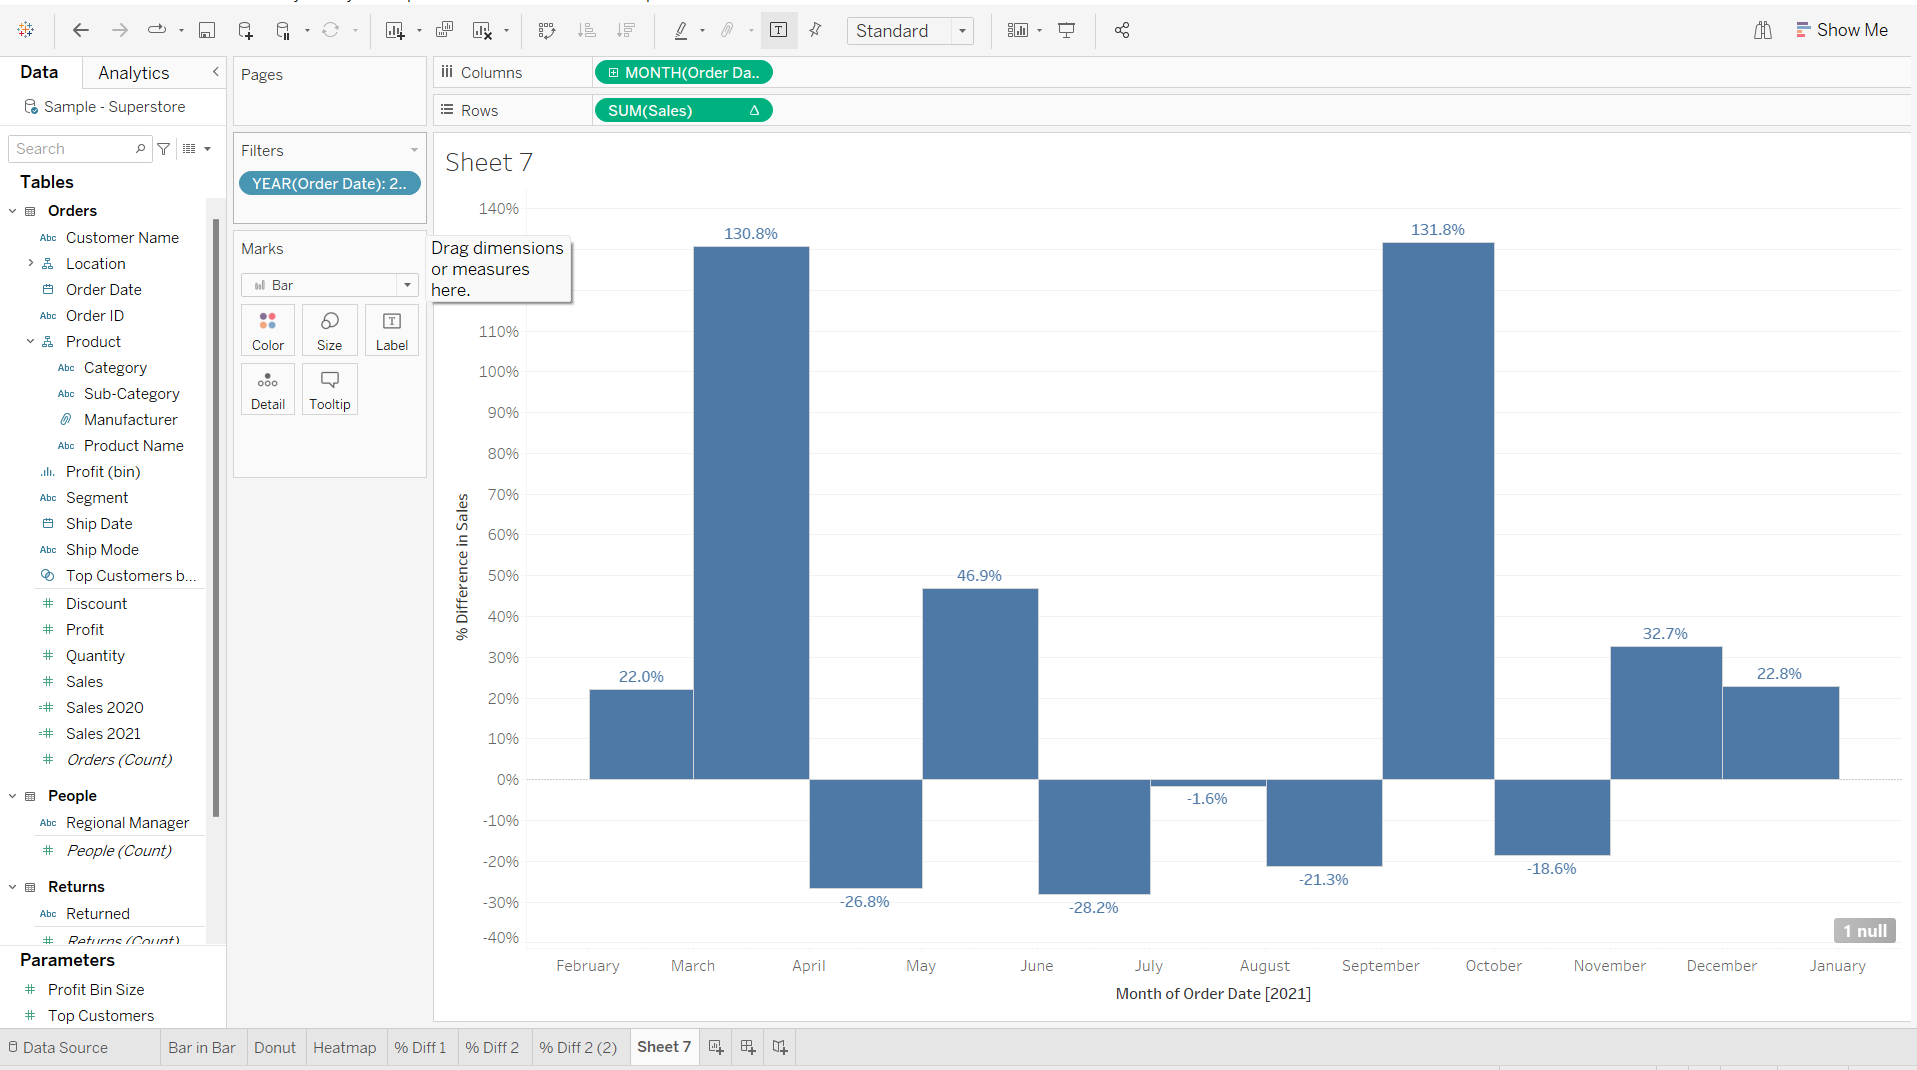
And that is all you need to do! You should be left with the following chart, which shows the monthly percent difference in total sales, for 2021.
Percent Difference - Advanced Table Calc
The default way that Tableau calculates the percent difference calculation, is relative to the previous value. In the example we just created, the percent difference in sales is relative to the previous month. In some cases you may want to change the way that Tableau works out this calculation, instead creating a percent difference relative to the first value for example.
Let's take a look at how we can edit our table calculation, depending on how we want the calculation to function, using the example we have just built by changing the percent difference from relative to the previous month, to relative to the first month.
Relative to:
The first way we can edit our table calculation is by selecting the drop down menu on SUM(Sales), and select 'Relative to':
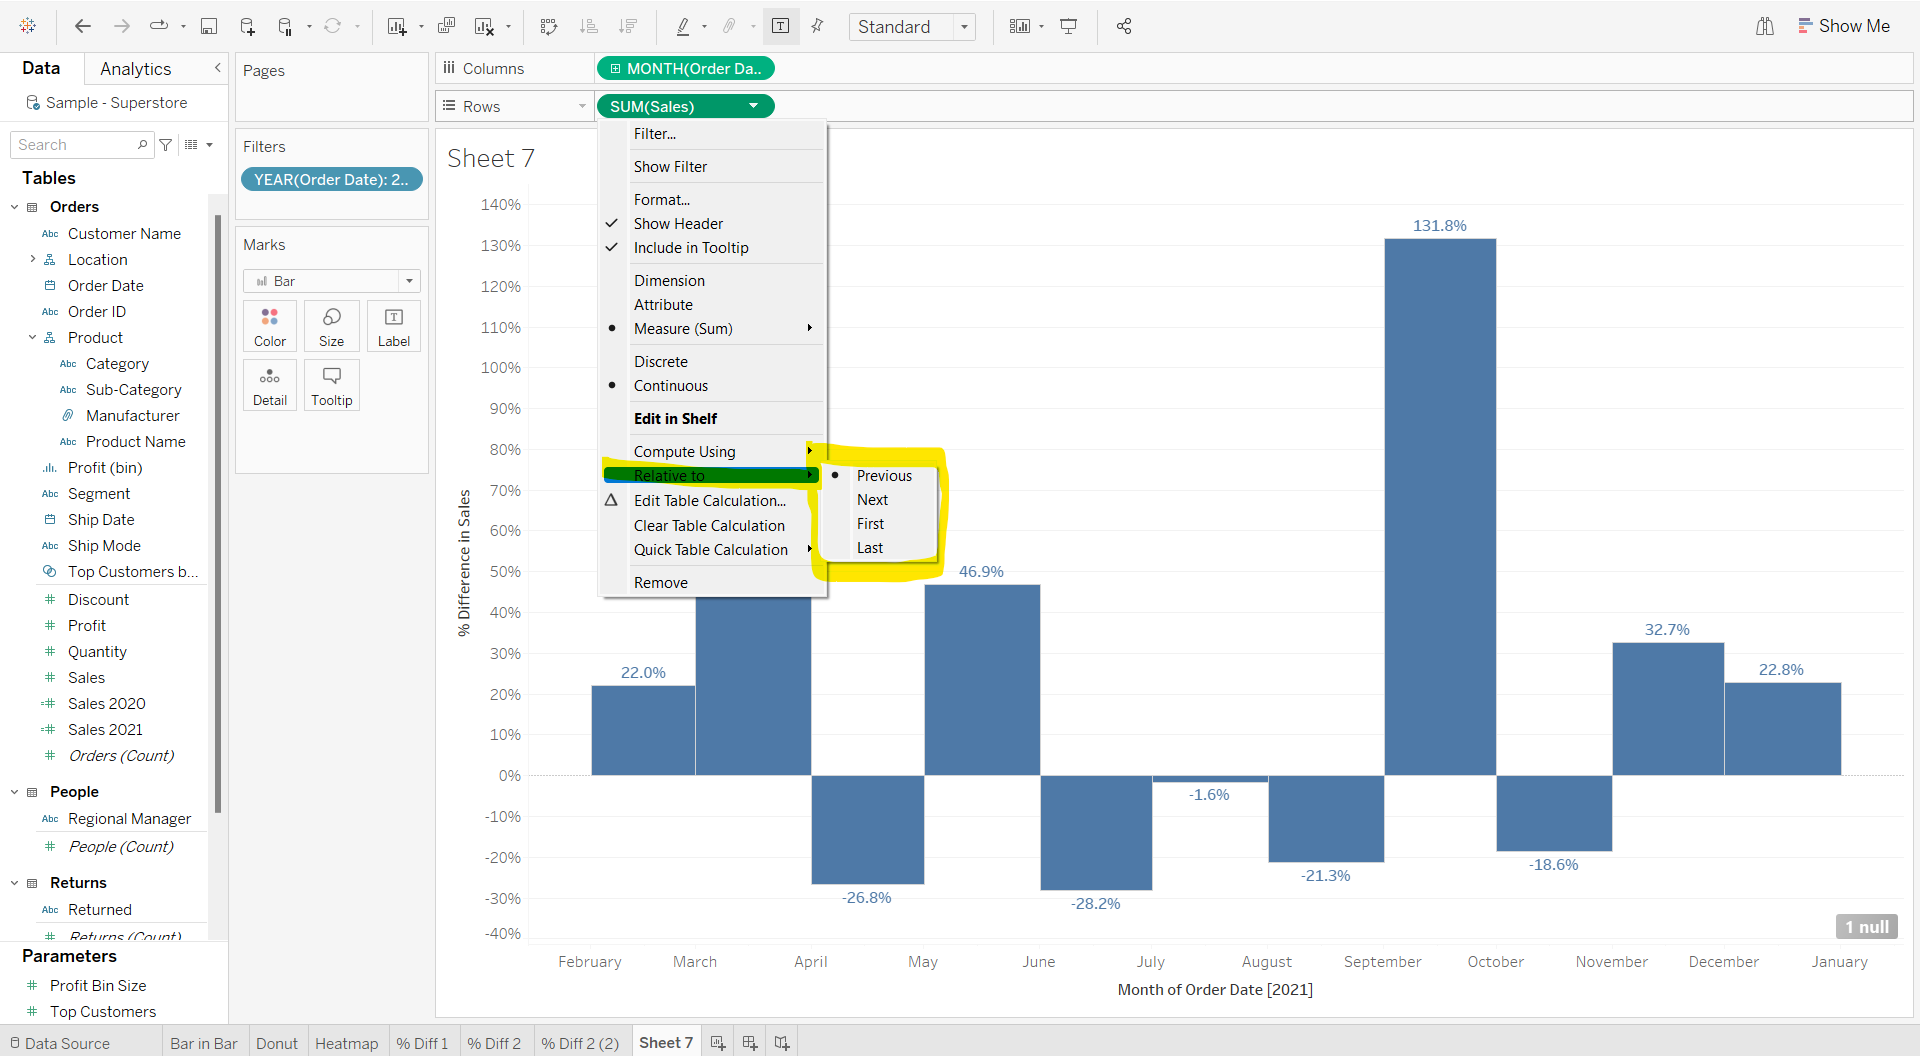
The four different options allow you to change the quick table calculation in the following ways:
- Previous (i.e. the default) - Tableau calculates the percent difference between the current value and the previous value.
- Next - Tableau calculates the percent difference between our current value and the value after.
- First - Tableau calculates the percent difference between our current value and the first value.
- Last - Tableau calculates the percent difference between our current value and the last value.
Given that we want to compare the difference in total sales month by month, with the first month (January) of 2021 as opposed to the previous month, we need to choose the 'First' option, which will give us the following view:
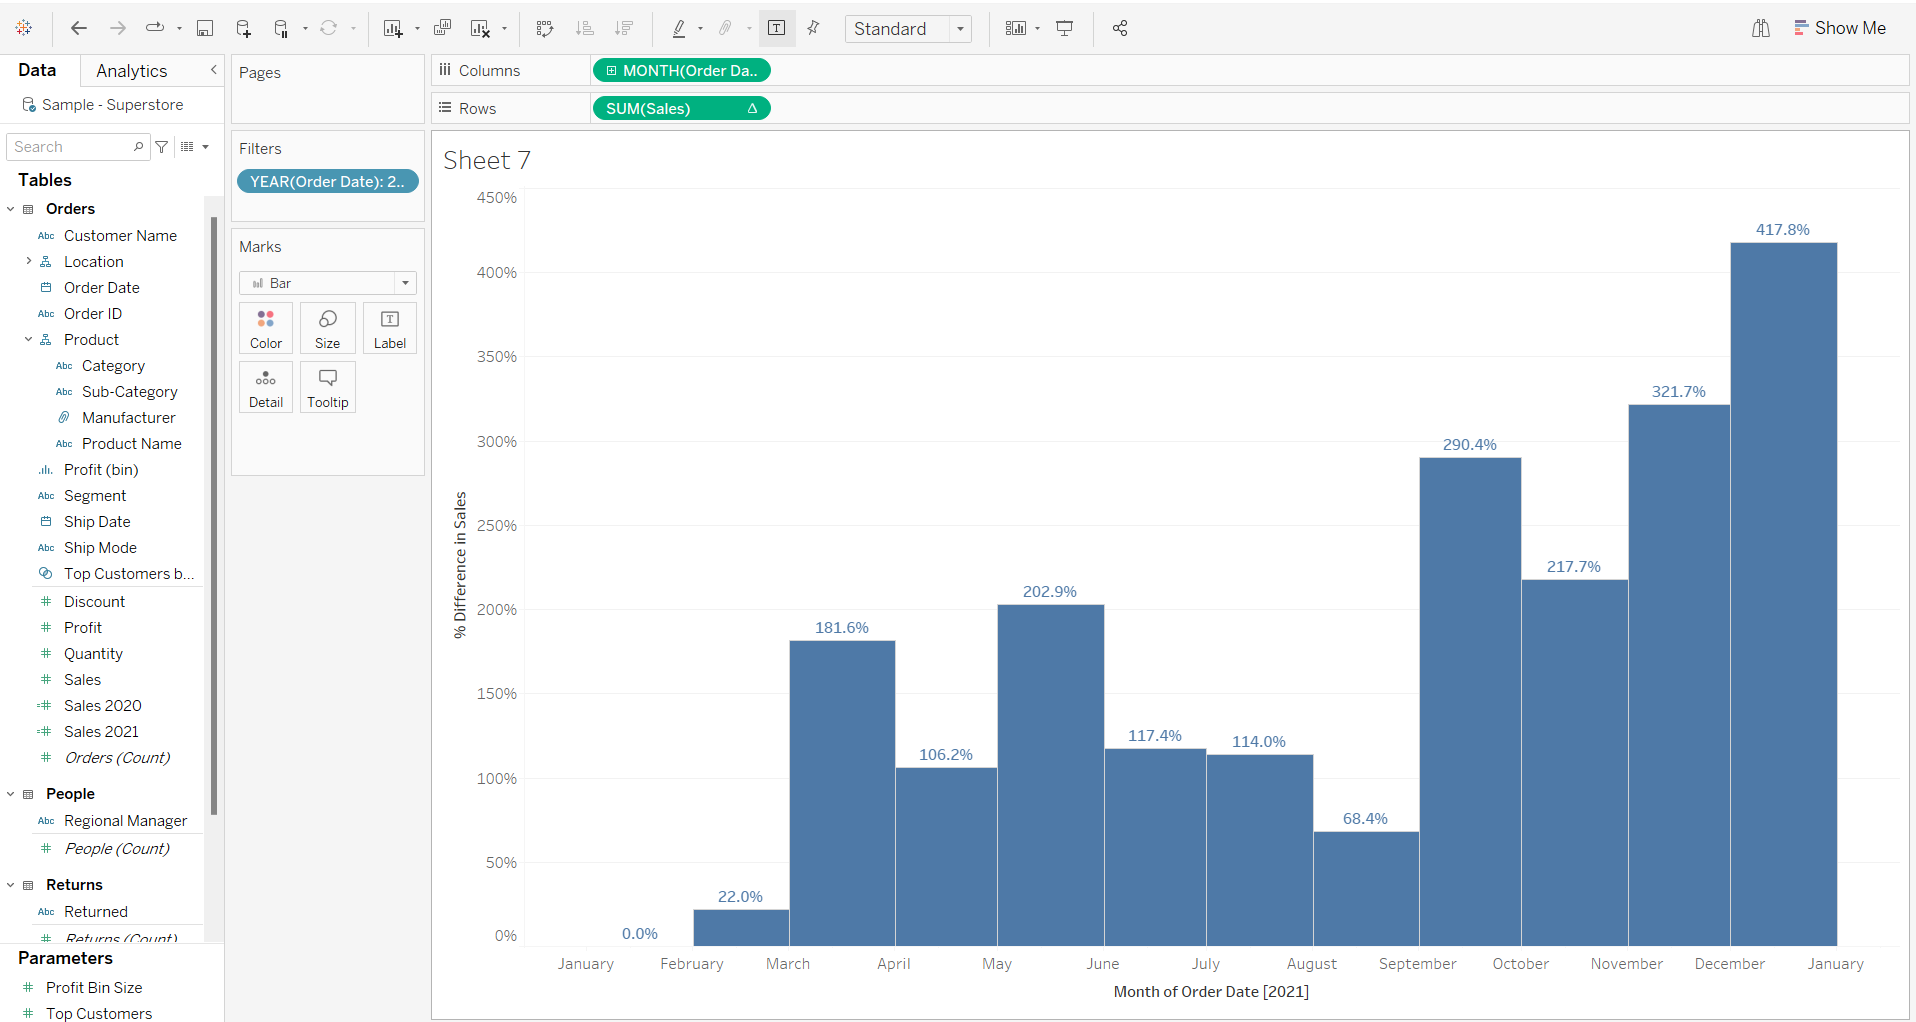
As the percent difference of sales is being compared to the first month, January has a value of 0% as it is being compared to itself.
Edit Quick Table Calculation
The second way we can change the way in which Tableau calculates the percent difference calculation, is by editing our quick table calculation.
Select the drop down menu on SUM(Sales) and select 'Edit Quick Table Calculation'. The following table should pop up:
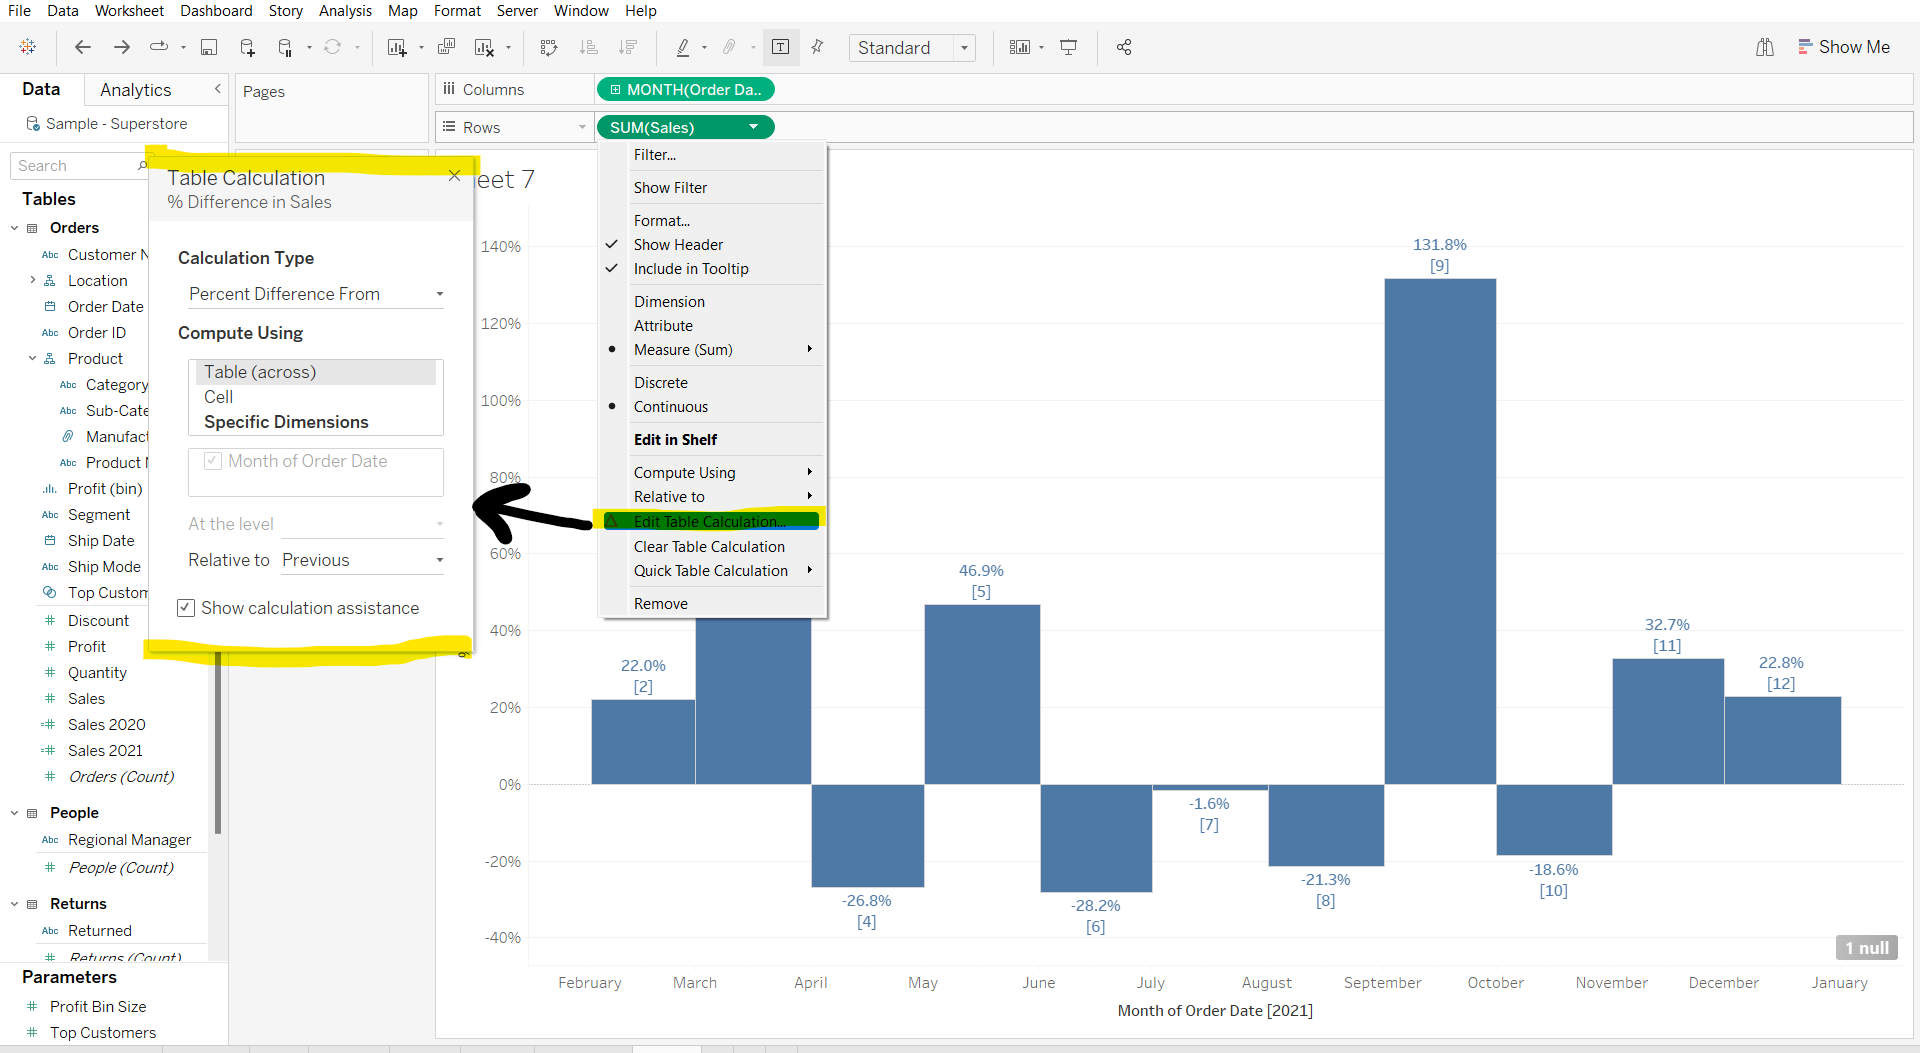
We want to select 'Compute Using', and 'Specific Dimensions' . As before, we can select 'Relative to', allowing us to say which value we want Tableau to compute the percent difference calculation relative to. As before, we have the options of 'Previous', 'Next', 'First' and 'Last', but we also have the option of choosing specific months by which to calculate the percent difference, which gives us an extra level of control over the calculation.

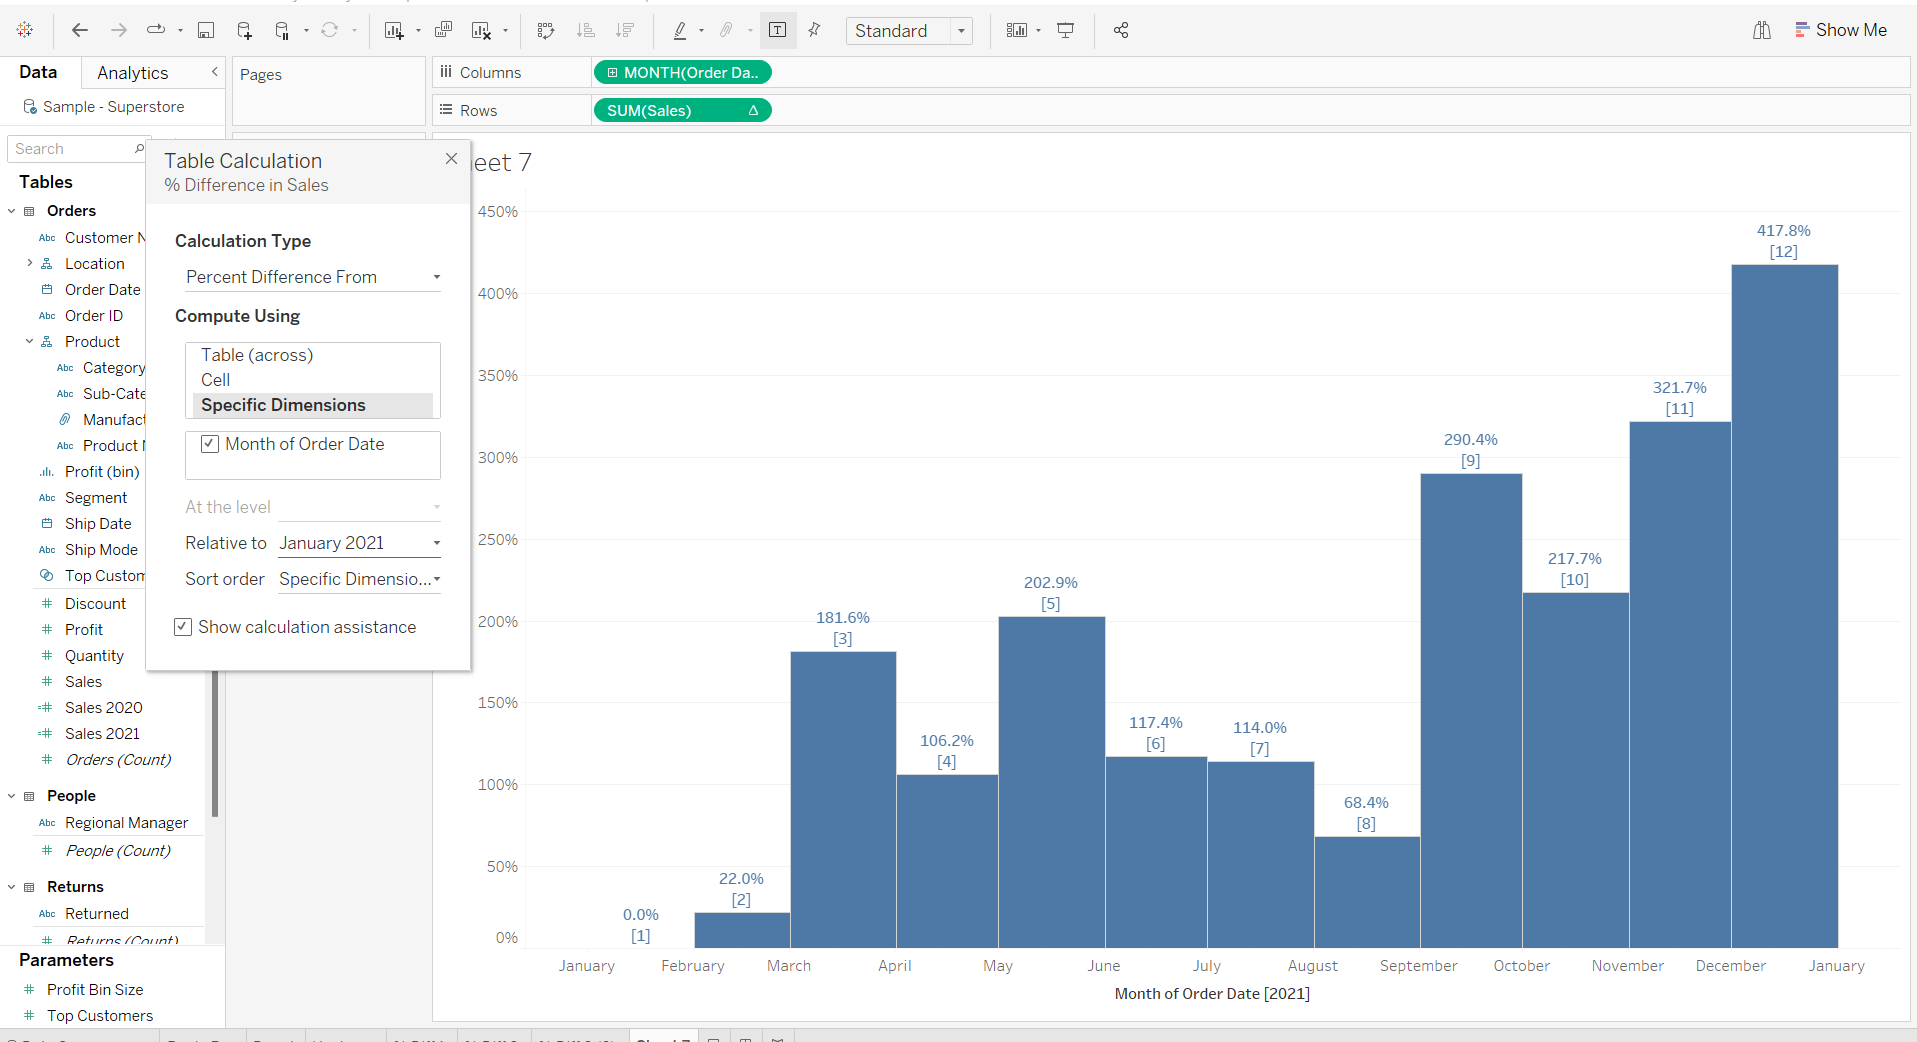
We wanted to calculate the difference in sales from January 2021. To do this, we can either choose relative to 'First' or 'January 2021', both will give us the following output:
And there you go - you've learnt how to create a percent difference calculation using a quick table calculation, and how to edit your calculation depending on how you want your calculation to run.
Stay tuned for my next blog on 'Percent of Total' calculations!