


Kicking off Dashboard Week with a blast!
Today, our project consisted of:
- Choosing a dataset of our choice
- Creating a Excalidraw Sketch
- Cleaning the Data/ Uploading into Snowflake with DDL/DML
- Connect to Snowflake using Tableau Desktop and building our logical data source
- Creating a Published Data Source to be used on Tableau Server.
Whew! That was a lot.
Let's go step by step.
The first thing I did today, was choose my dataset, as I felt I could plan around my data, as well and get a schedule set up based on how much I thought I could tackle.
After exploring Kaggle for 30 minutes, I came to the conclusion that the vast majority of the datasets available were too small, as they did not have enough columns available to make a meaningful schema.
As such, I made sure to filter the datasets to only give me choices that were larger than 100 MBs, as I felt that those datasets would be big enough to have enough columns/rows.
This gave me my dataset: Steam Games
https://www.kaggle.com/datasets/hubertsidorowicz/steam-games-dataset-daily-updates?resource=download
This dataset came with 42 columns and 7,253 rows, more than enough for my project today!
After spending some time exploring my data, I drew up a quick plan and schedule, which included getting all my data into snowflake and ready before 12:30. That way, I would have enough time to bring the data back into Tableau Desktop, create the logical model, and publish it as a data source. This would also give me ample time for documentation and writing this blog.
While exploring my data, I created a user story in order to drive the data and structure it in a way that my fictional user could come up with insights. The story is as follows:
"As a market/pricing analyst, I want to be able to see the specific games, along with the various metrics that determine each game's success, such as price, positive/negative ratings, recommendations, playtime, etc."
As I explored this data, I created my Excalidraw Sketch, detailing my schema with its fact and dimension tables.
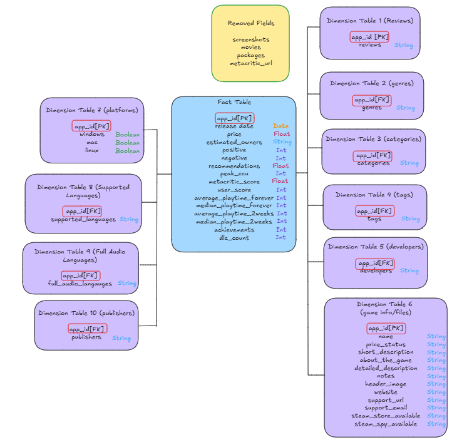
From here, I realized that splitting up some of this data in Snowflake using SQL would take far too long, so I pivoted and went into Alteryx in order to break my data apart quicker.
While working in Alteryx, I faced my first blocker, where fields such as genre, tags, or categories were stored in arrays, and if left as is, would be very difficult to provide any meaningful analysis.
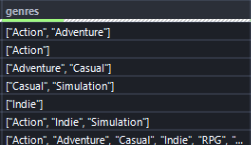
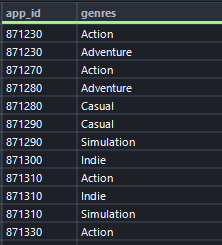
After asking other consultants, the consensus was to create a dimension table containing the genres, and using app_id (the unique identifier) as my foreign key. In this case, the app_id can have many genres, so the value is duplicated.
After cleaning all the data and formatting it in a way that would make sense, I output all my data as CSV files, and uploaded them to Snowflake. From here, I attempted to connect Snowflake to Tableau Desktop, but was facing issues with the ODBC connector. After spending some time troubleshooting, the solution was downloading an older version of the connector, which allowed me to connect.
After building my logical model, I ran into another issue, where my version of Tableau was not compatible with uploading a published data source to Tableau Server.
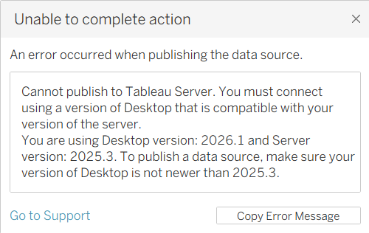
After finally downloading the right version of Desktop, I was finally able to upload my published data source to Tableau Server.