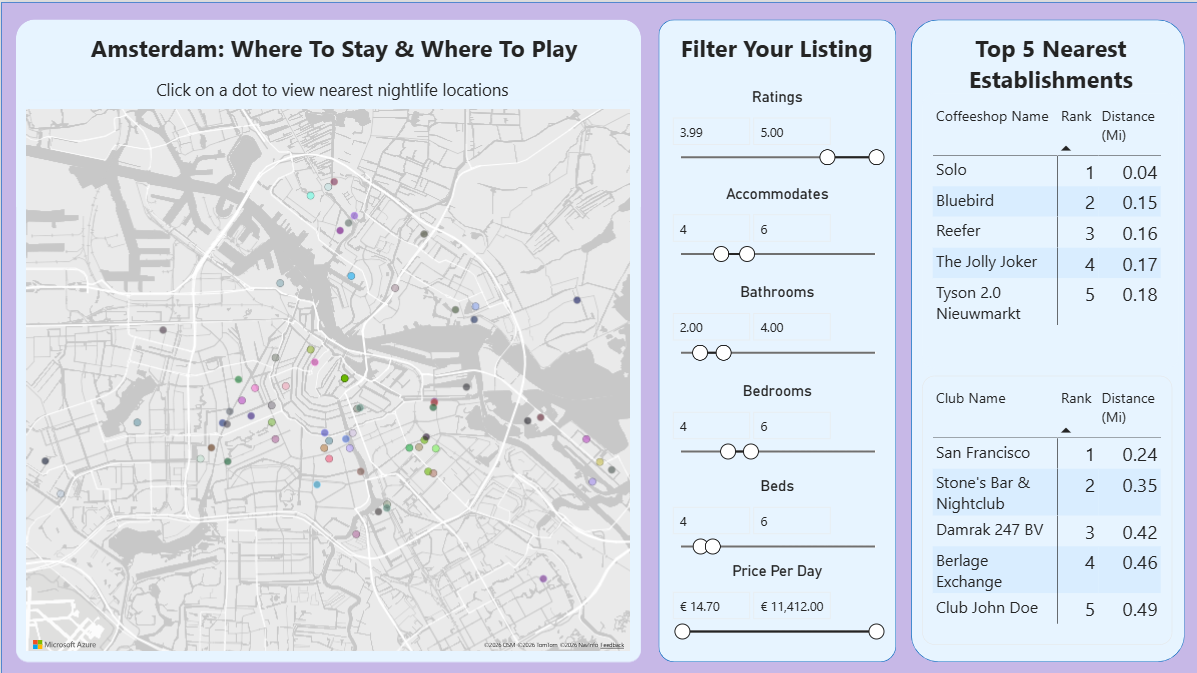
Today, we started working on the PowerBI Dashboard day!
Even though I love Tableau more, I will say I had fun in PowerBi today.
Starting off, we were given data regarding Airbnb listing in different locations around the world. I ended up choosing Amsterdam, especially taking an interest in the nightlife. I wanted to build a dashboard that not only let me find the best Airbnb location, but also the nearest Nightlife.
As such, here was my initial Excalidraw Sketch:
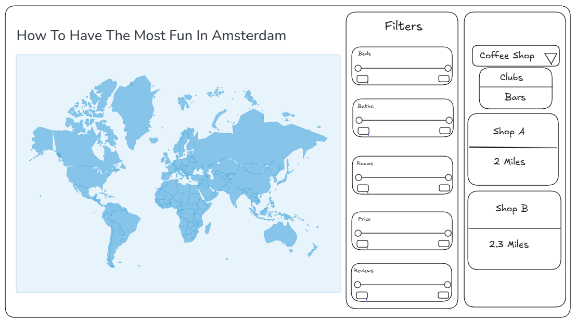
From here, I came to the realization that I did not have enough data in order to actually find the nightlife. This is where some of my troubles began.
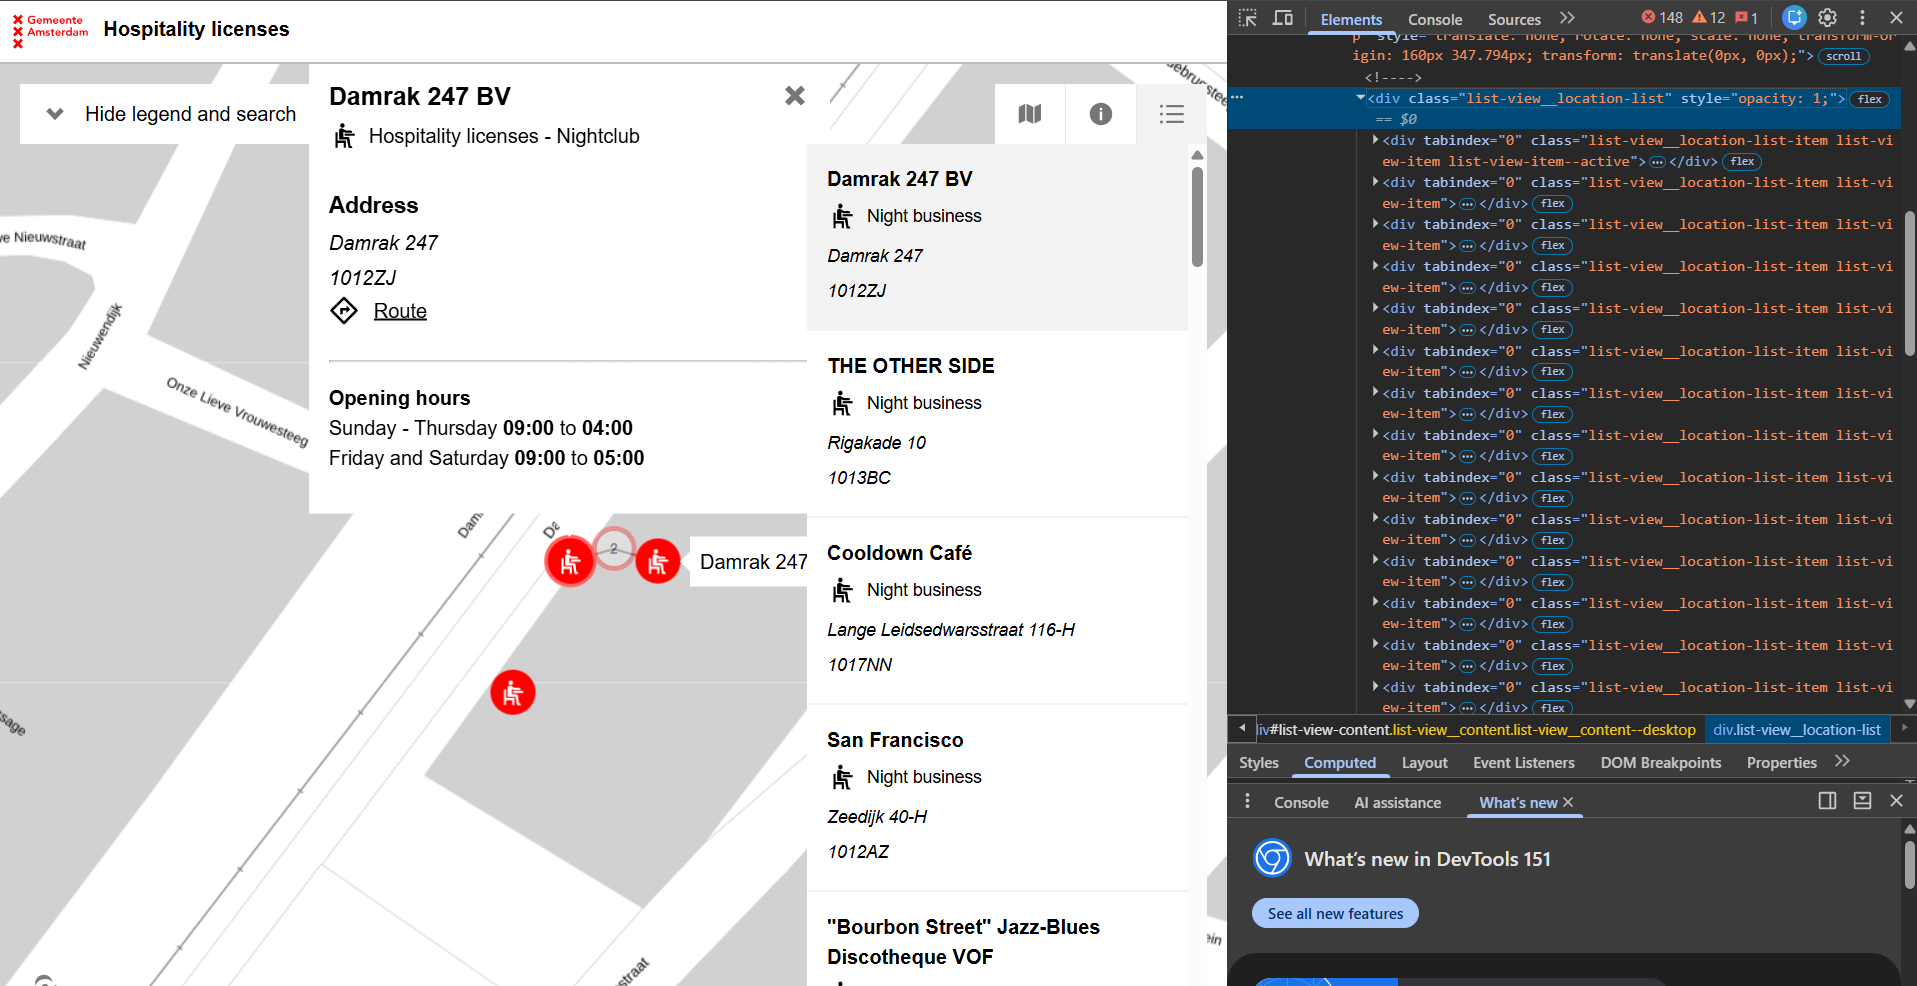
I was lucky enough to find local Coffeeshop geospatial data, which gave me longitude and latitude. However, I also wanted to find data regarding the different types of clubs in the area. This was proving to be quite difficult, so I ended up viewing the Netherlands hospitality licenses, filtering to nightlife clubs, and extracting the page HTML in order to find the longitude and latitude.
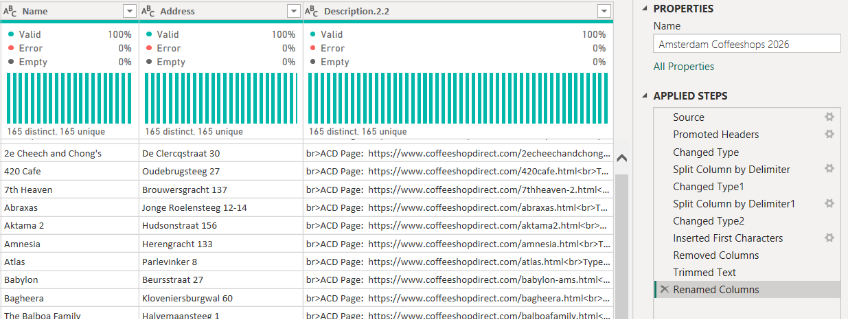
From here, I was able to import everything into PowerBI, and clean it in PowerQuery. This mostly revolved around splitting data in order to get addresses cleanly.
I then created calculated tables in order to find the distance dynamically from each Airbnb listing to the nearest nightlife (Coffeeshop or Club)
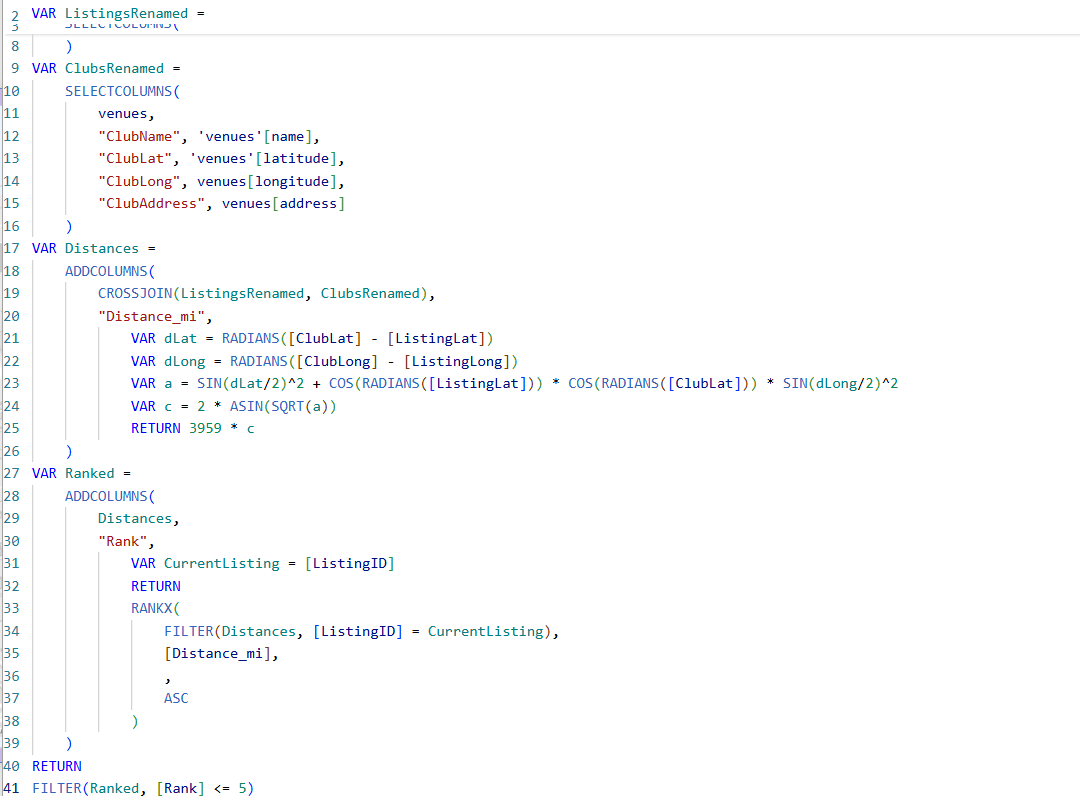
I was able to input this data into my dashboard, as well as figuring out how to get some viz in tooltips thanks to fellow Data School blogs.
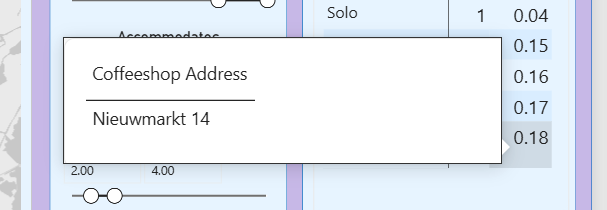
This left me with my finished dashboard, which while small, I am still rather proud of!