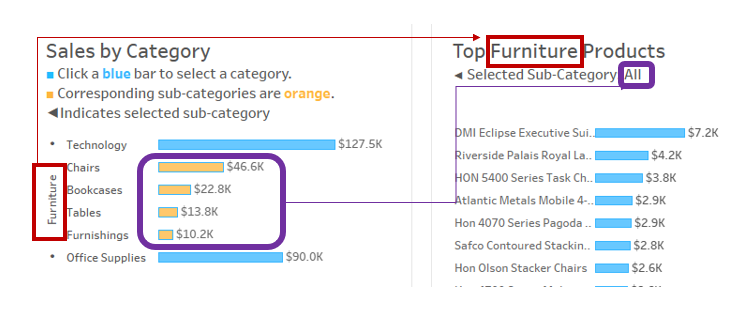
In Part I of this blog, I outlined the steps needed to build a multi-level selection into a drilldown bar chart with set action highlight. In this blog, I will outline the steps needed to use category/sub-category drilldown bar chart to filter to the product level in another bar chart.
Step 1: Create a bar chart of sales (drag to columns) of product names (drag to rows).
Step 2: Drag the Category field to rows, and place it to the left of Product Name.

Step 3: Drag the sub-category level set to the right of product name. For more information about the sub-category level set, please see Part I of this blog.
Step 4: Create a calculated field with a "Sub-Category If Statement."
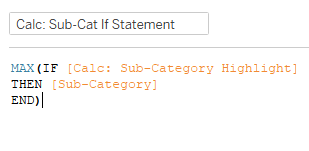
- What it means: If the sub-category from the Category Bar chart is highlighted, then show the items within those sub-categories in the Products Bar Chart. The result of this if statement is shown below. Since the If statement inside the parentheses is a mix of aggregate/non-aggregates, the entire calculation is wrapped in an aggregate function.
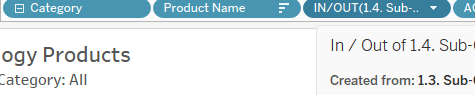
Step 5: Drag the Sub-Category If Statement to the right of all the other pills on rows.

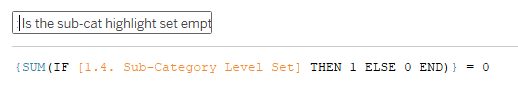
Step 6: Create a boolean calculated field: "Is the sub-category set highlight empty?"
Step 7: Drag the Sub-Category field to Detail on the marks card

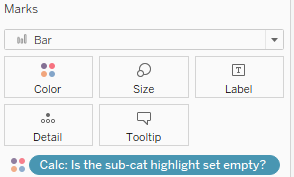
Step 8: Drag the boolean calculated field: "Is the sub-category set highlight empty?" to the right of the sub-cat if statement

AND to color on the marks card.
What it means: If the Sub-Category Level Set is empty, then 1 (True):

Otherwise: 0 (False).
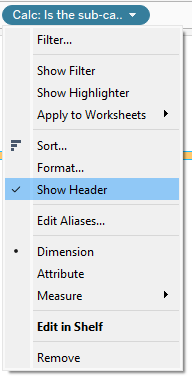
Step 9: Click on the blue pill for "Is the sub-category set highlight empty?" and un-tick "Show Header."
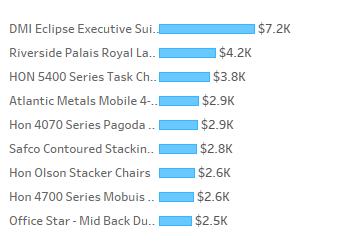
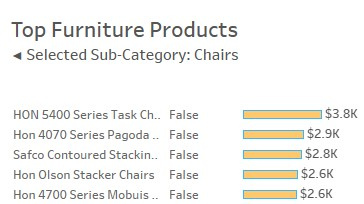
You should now be left with this final result: