Last week, for our client project we had monthly target data. However, we needed to compare values at a daily or weekly level. This meant that we had to take this monthly target value and show how that translates into a daily targets throughout the month.
Doing this was actually not too complicated. Given that we had the monthly target at a row level we could divide that number by the number of days in the month and then multiply by the number of days passed to get a target value for every month.
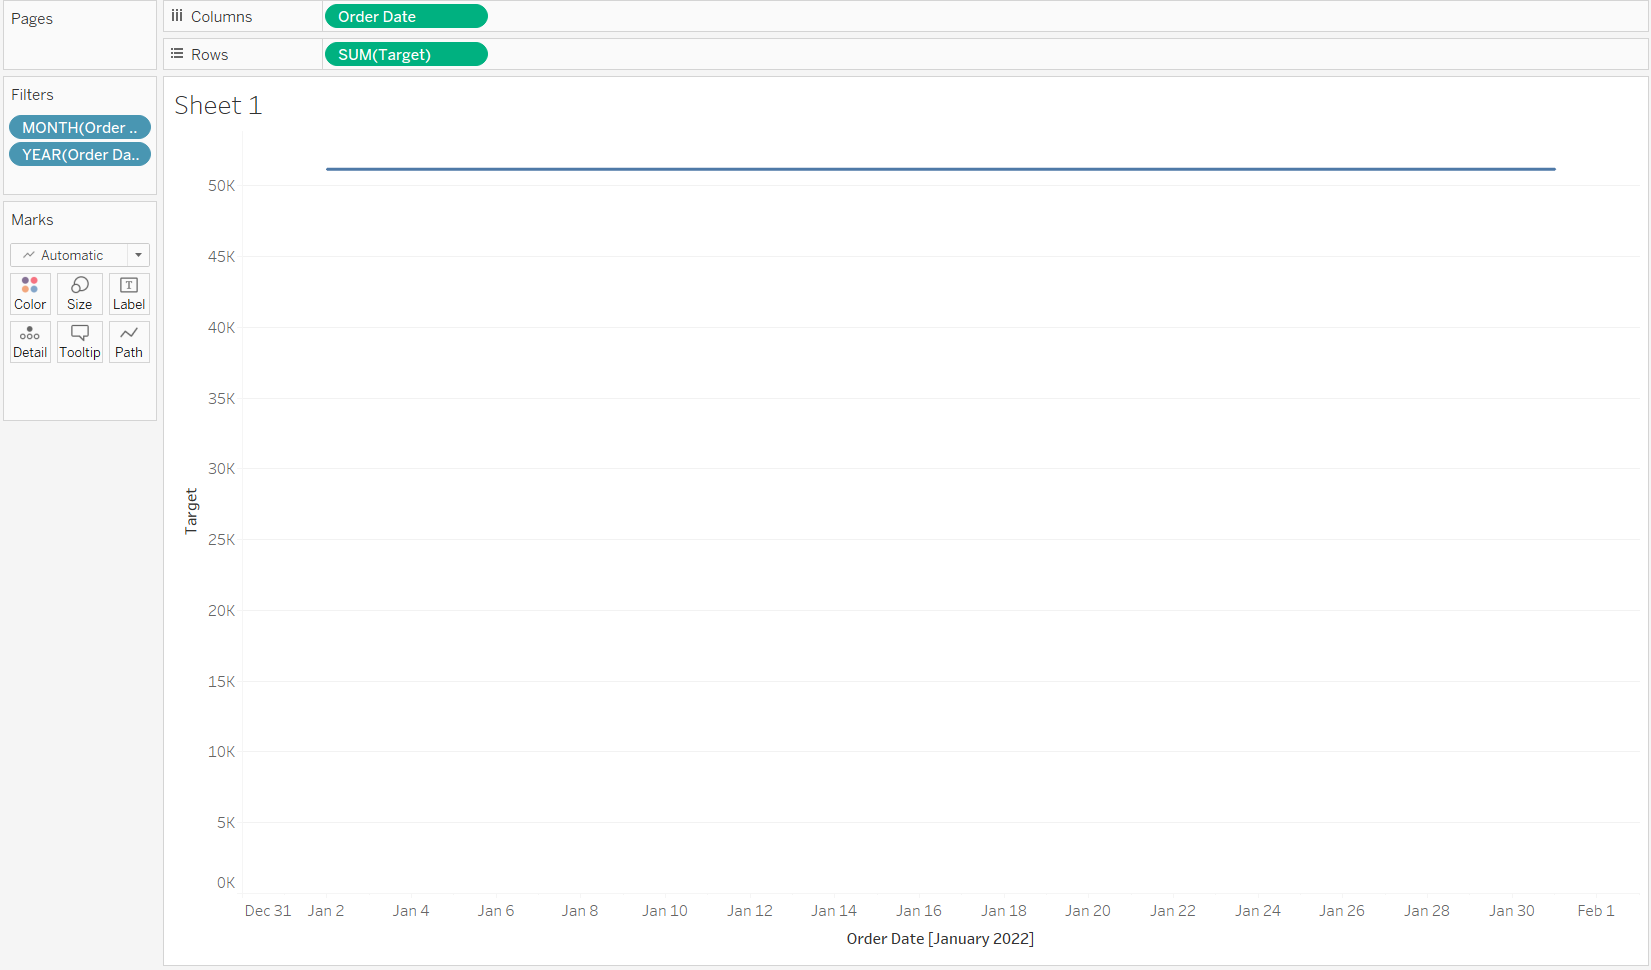
We start with the monthly goal given:

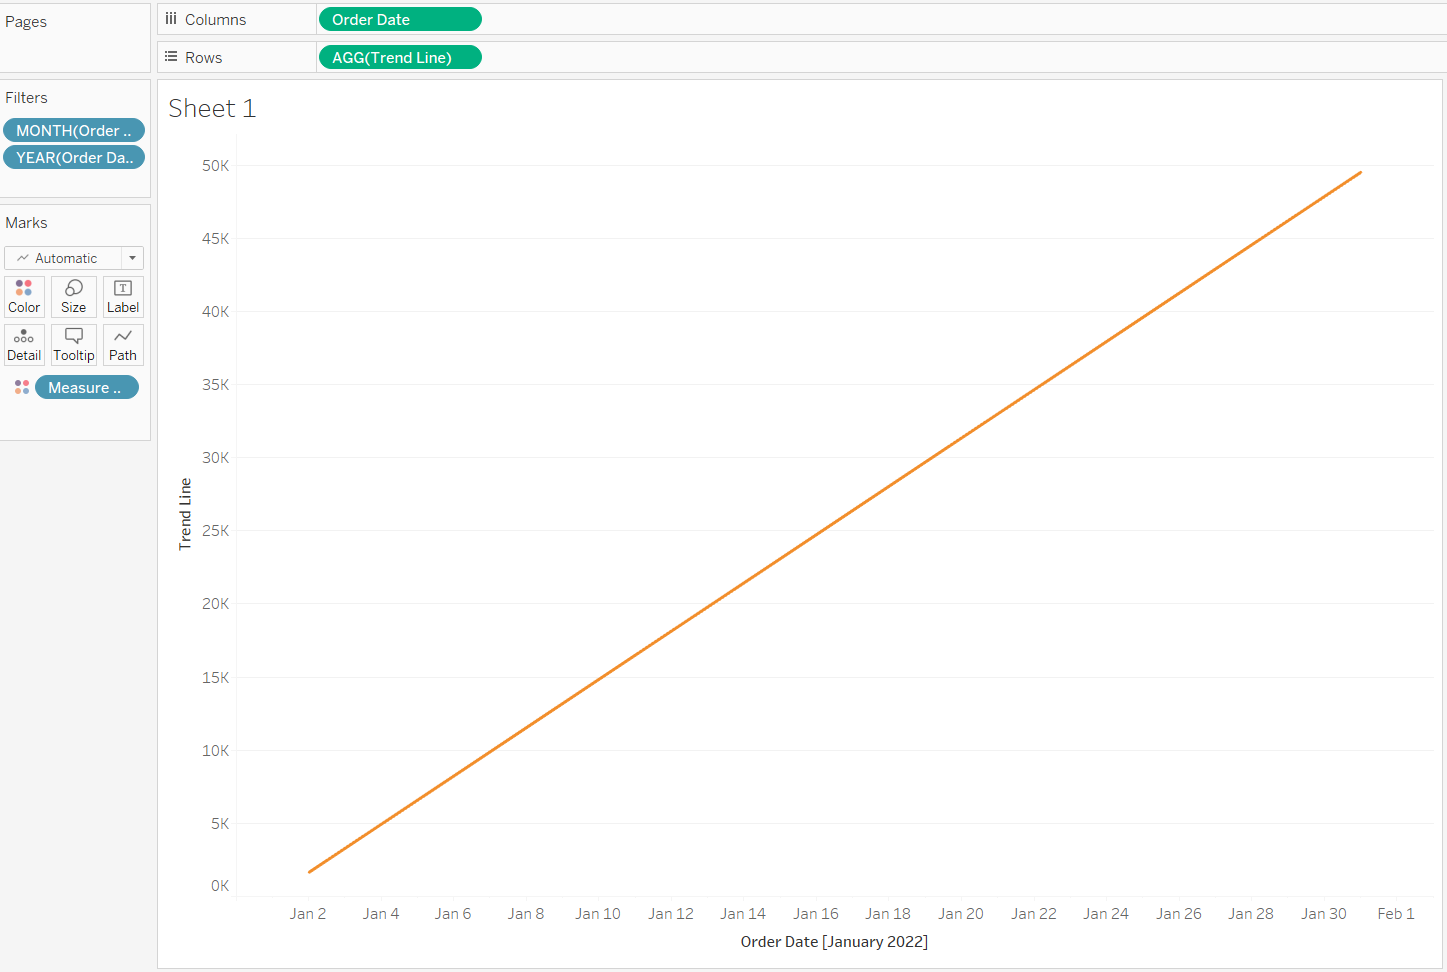
And then we have to convert that into the daily goals:

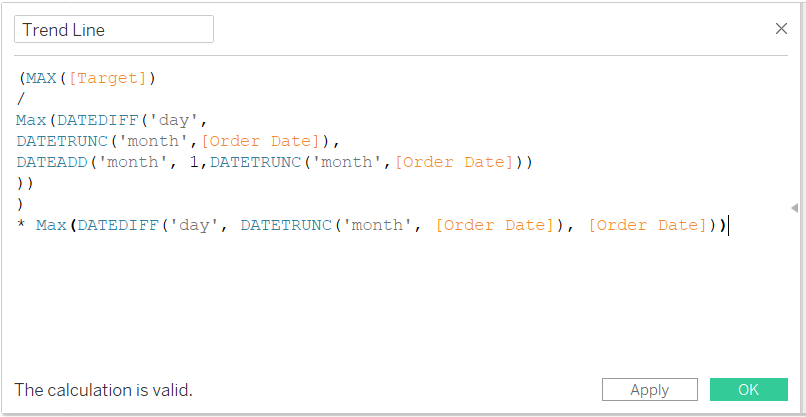
This means we need to find the number of days in the month with the DATEDIFF function. This works by finding the number of days in between the start of this current month and the start of the following month. After dividing the target by the number of days, you have the daily target instead.
Then you multiply that by the number of days passed within the current month. This means for every date, multiply by the difference in days from the start of the month to the current day.

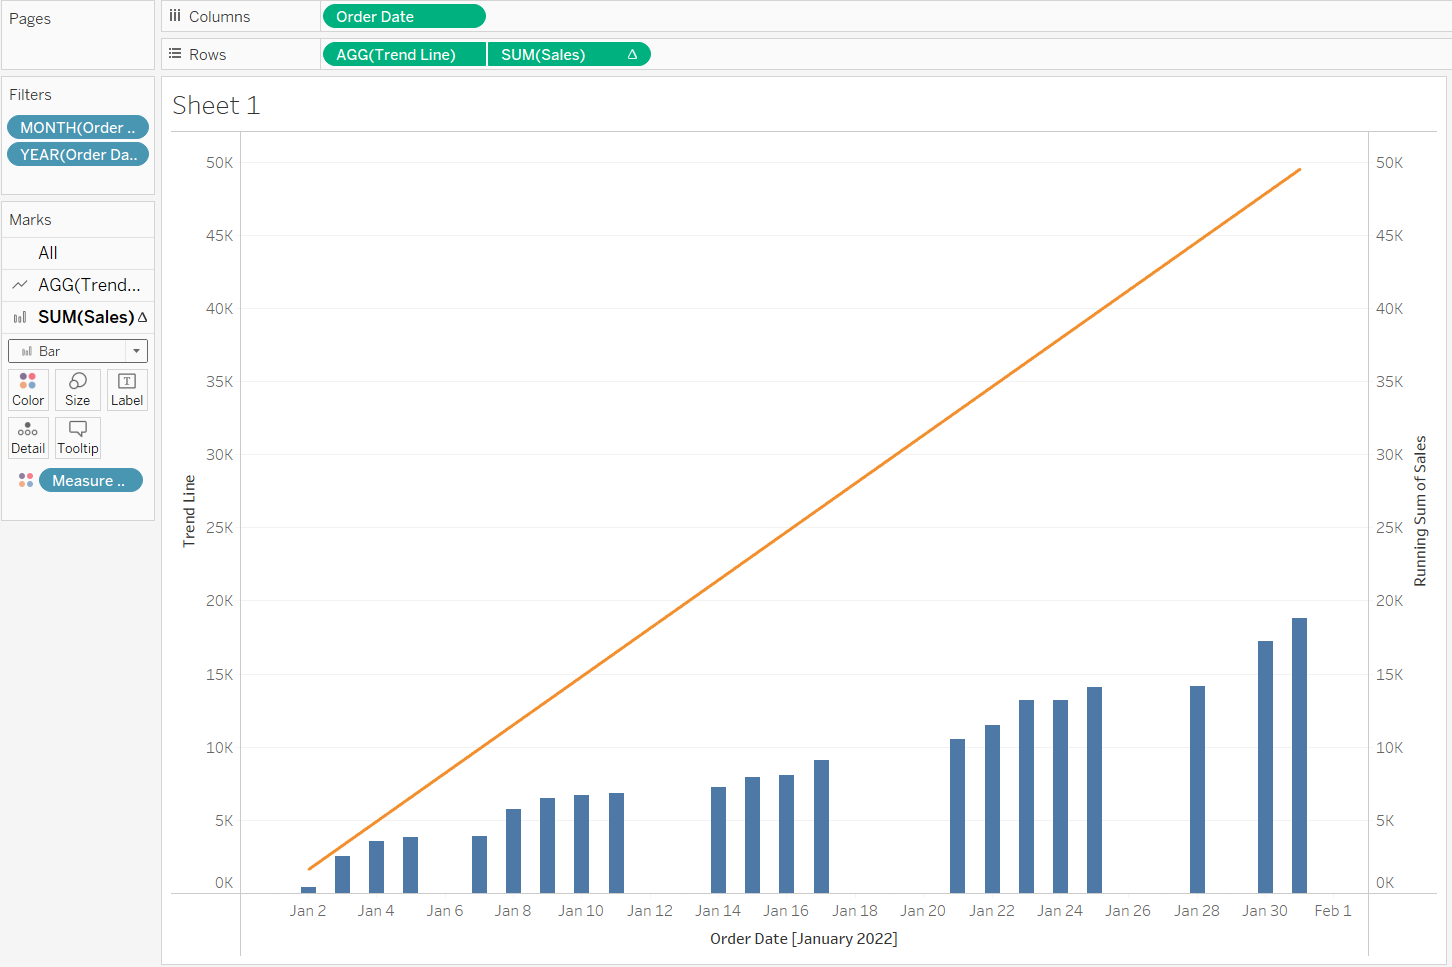
Plotting this, we get a smooth trend line. In this case, it describes the cumulative target for sales throughout the month. We can now use this to show how the company (superstore) is doing throughout the month by overlaying the actual sales with this trend line.

This format makes it quite easy to see where we fell behind in sales and how far from the target we are.
