A major benefit of using Tableau for data visualization is how easy making a dashboard interactive is. Having an interactive dashboard can allow the user to view data in a more efficient way by hiding what is unnecessary and potentially tell a better story by highlighting relevant information.
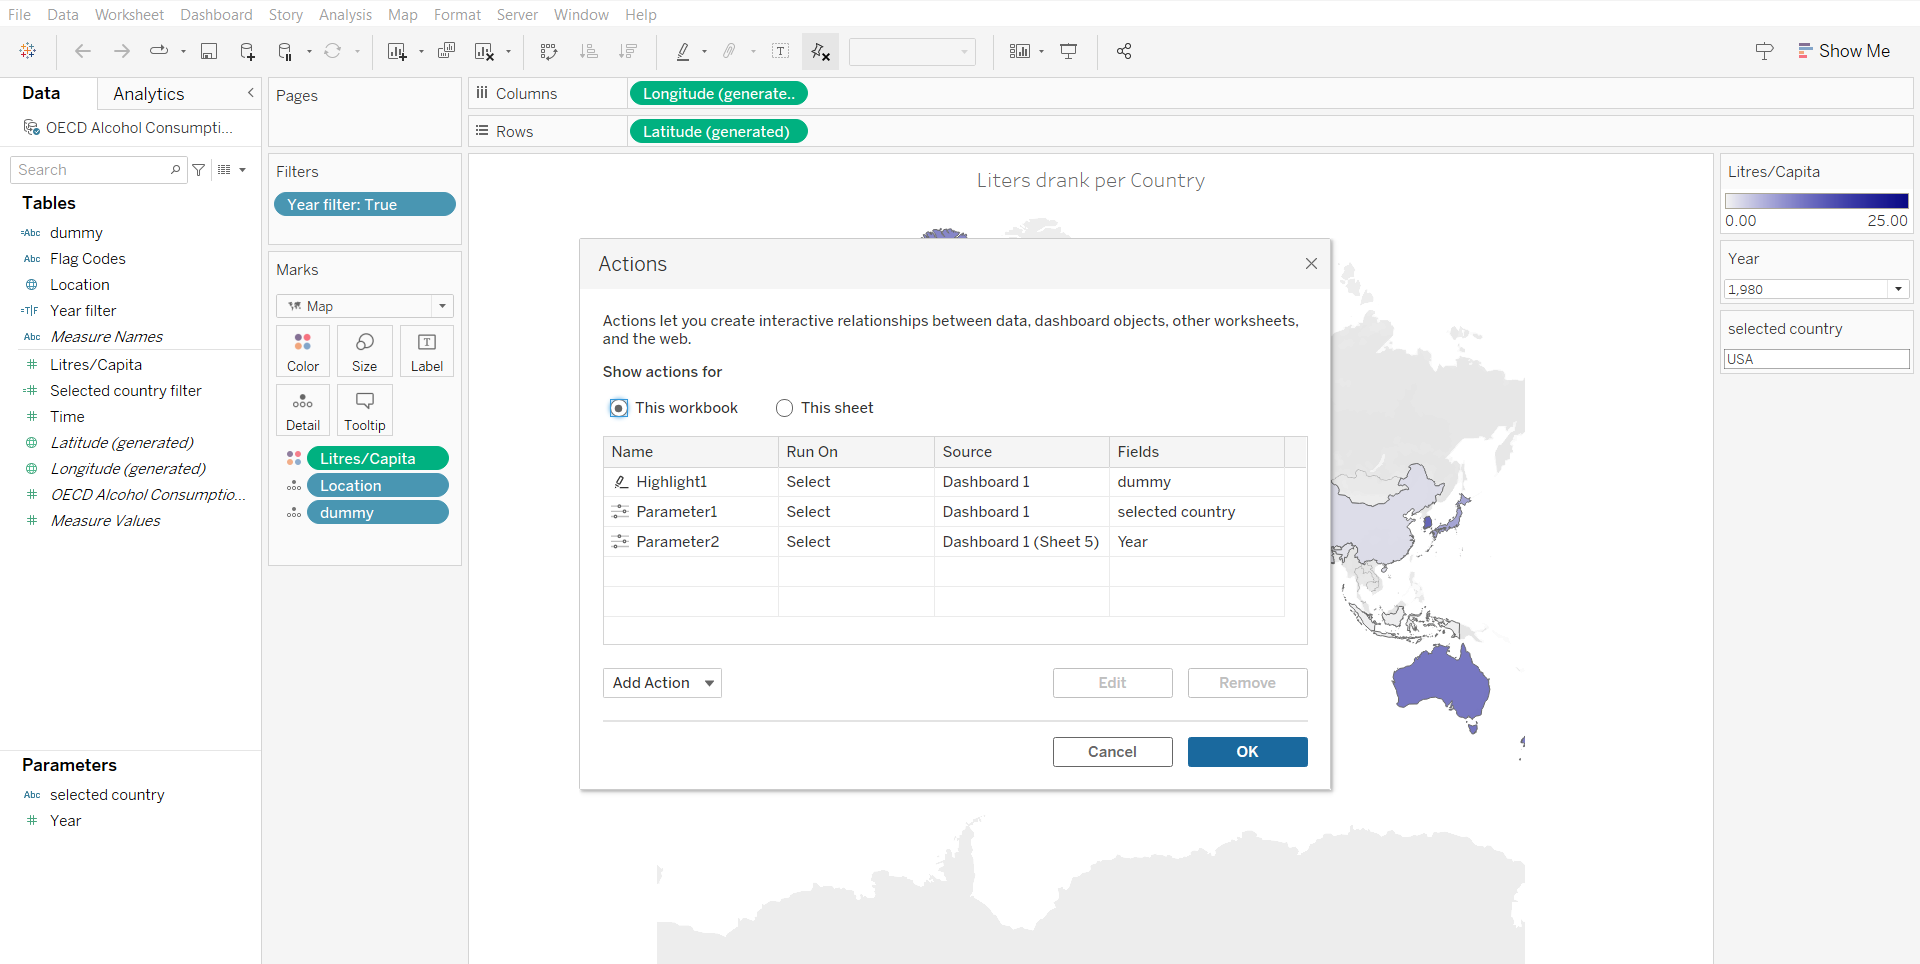
It is very easy to add these interactive elements in Tableau with simple dashboard/worksheet actions. We can add an "action" that does something whenever you click on specific parts of a dashboard.

Here we can give Tableau instructions for different actions. These instructions can include changing parameters, changing sets, redirecting with a link, highlighting, or filtering. With these actions, we can use a simple click to edit the data that goes into the viz in different ways.
For example, in this Makeover Monday, I used an action that allows you to click on the map to select a country. This would filter the data in another chart to only show data from that country.
This is only one example of what we can do with actions. The feature is very robust and allows us to create many different interactive elements.
