


Think of finding your suitcase at the airport baggage carousel. You don’t carefully inspect every case; instead, your eyes immediately pick out the orange tag on your handle or its unique patterned pattern. You spot it almost straight away because those visual features stand out before you consciously examine the other bags.
Pre-attentive attributes are the data visualisation equivalent of that brightly colored tag or bold pattern, they grab your attention without you having to think about it. They act like a sign saying, "Look here first!"
In data visualisation, pre-attentive attributes are key to helping people digest information and grasp the main takeaways instantly, without forcing them to decipher every bar on a chart or get lost in a sea of lines and dots.
Take these two graphs, for example:
In the first graph, what do you notice right away?
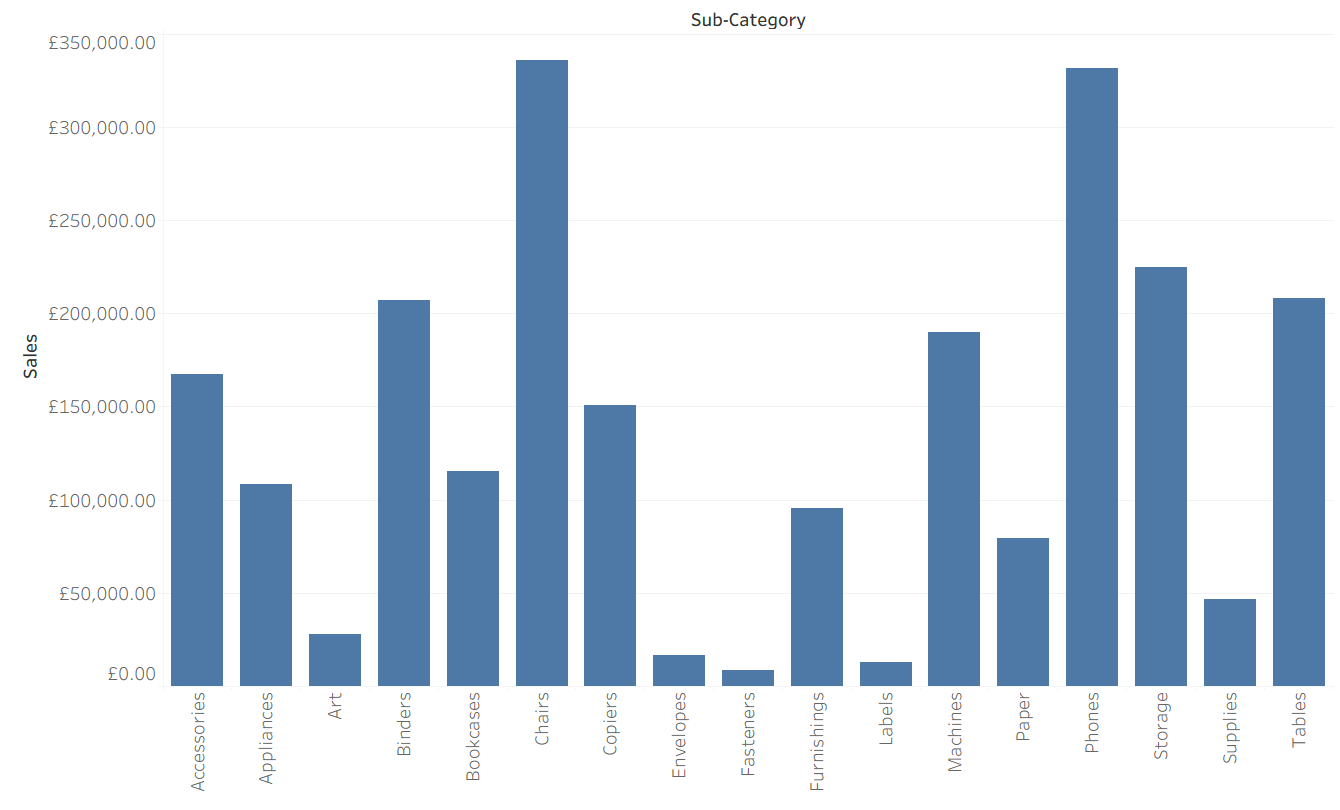
You might notice that Chairs has the highest bar, but finding the next highest sellers (like Phones) requires scanning back and forth across the unsorted categories. Beyond the tallest peak, it takes conscious effort to figure out which items are performing well.
Now look at the same data using pre-attentive attributes. What stands out now?
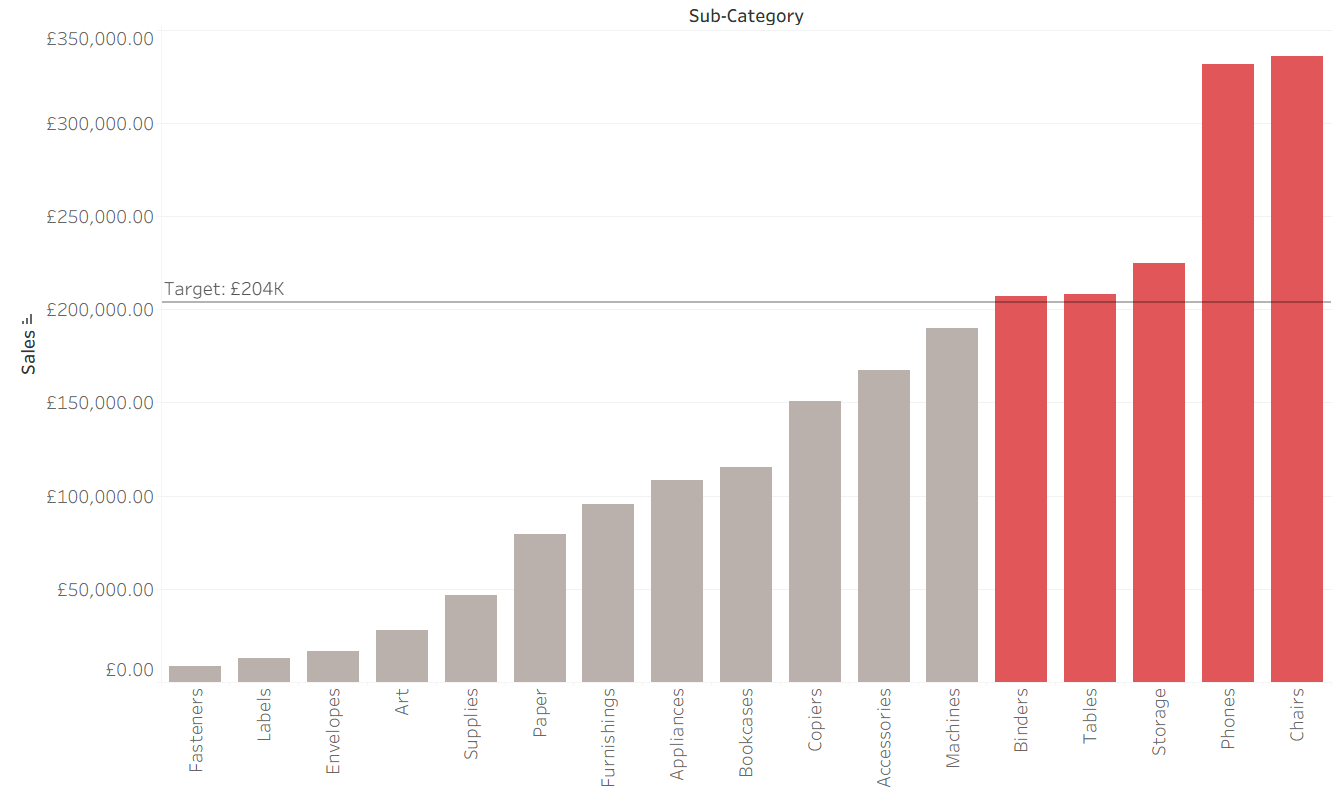
Immediately, you know that there are 5 sub-categories that reach the target of Immediately, you know two things: exactly five sub-categories reached the £204K target, and Chairs is the top-selling sub-category.
We interpret this instantly and subconsciously thanks to three main pre-attentive attributes:
- Color: The bars are split into two distinct colors: neutral grey for items below the £204K target, and vibrant red for items above it. Your brain automatically groups the data into two distinct categories (met target vs. missed target) before you even read a label.
- Length / Height: The height of each vertical bar encodes the total sales amount. Viewers process relative values instantly and recognise the overall trend.
- Position (Spatial Location):
- Vertical: The reference line at £204K provides a clear visual threshold.
- Horizontal: Sorting the sub-categories in ascending order transforms chaotic data into an intuitive gradient, making bar-to-bar comparisons effortless.
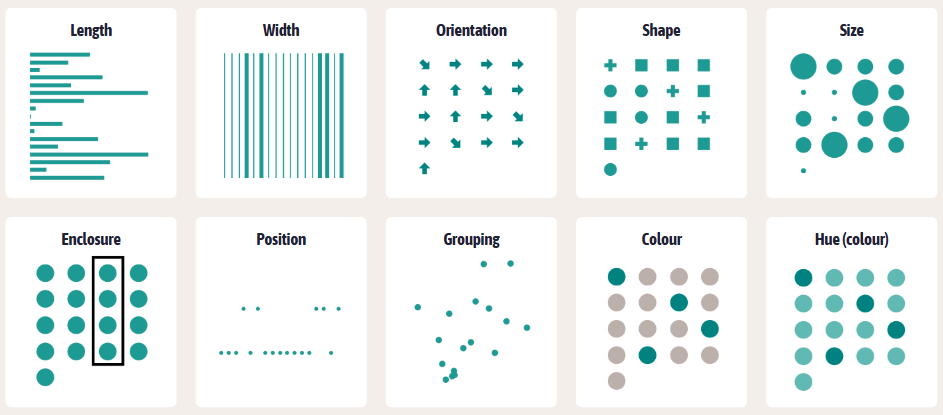
Pre-attentive attributes cover a wide range of techniques, including shape, size, orientation, enclosure, and hue:
While these attributes are powerful tools when building dashboards and reports, use them sparingly! Applying too many pre-attentive attributes at once creates visual clutter, overwhelms the reader, and defeats the purpose of guiding their attention.