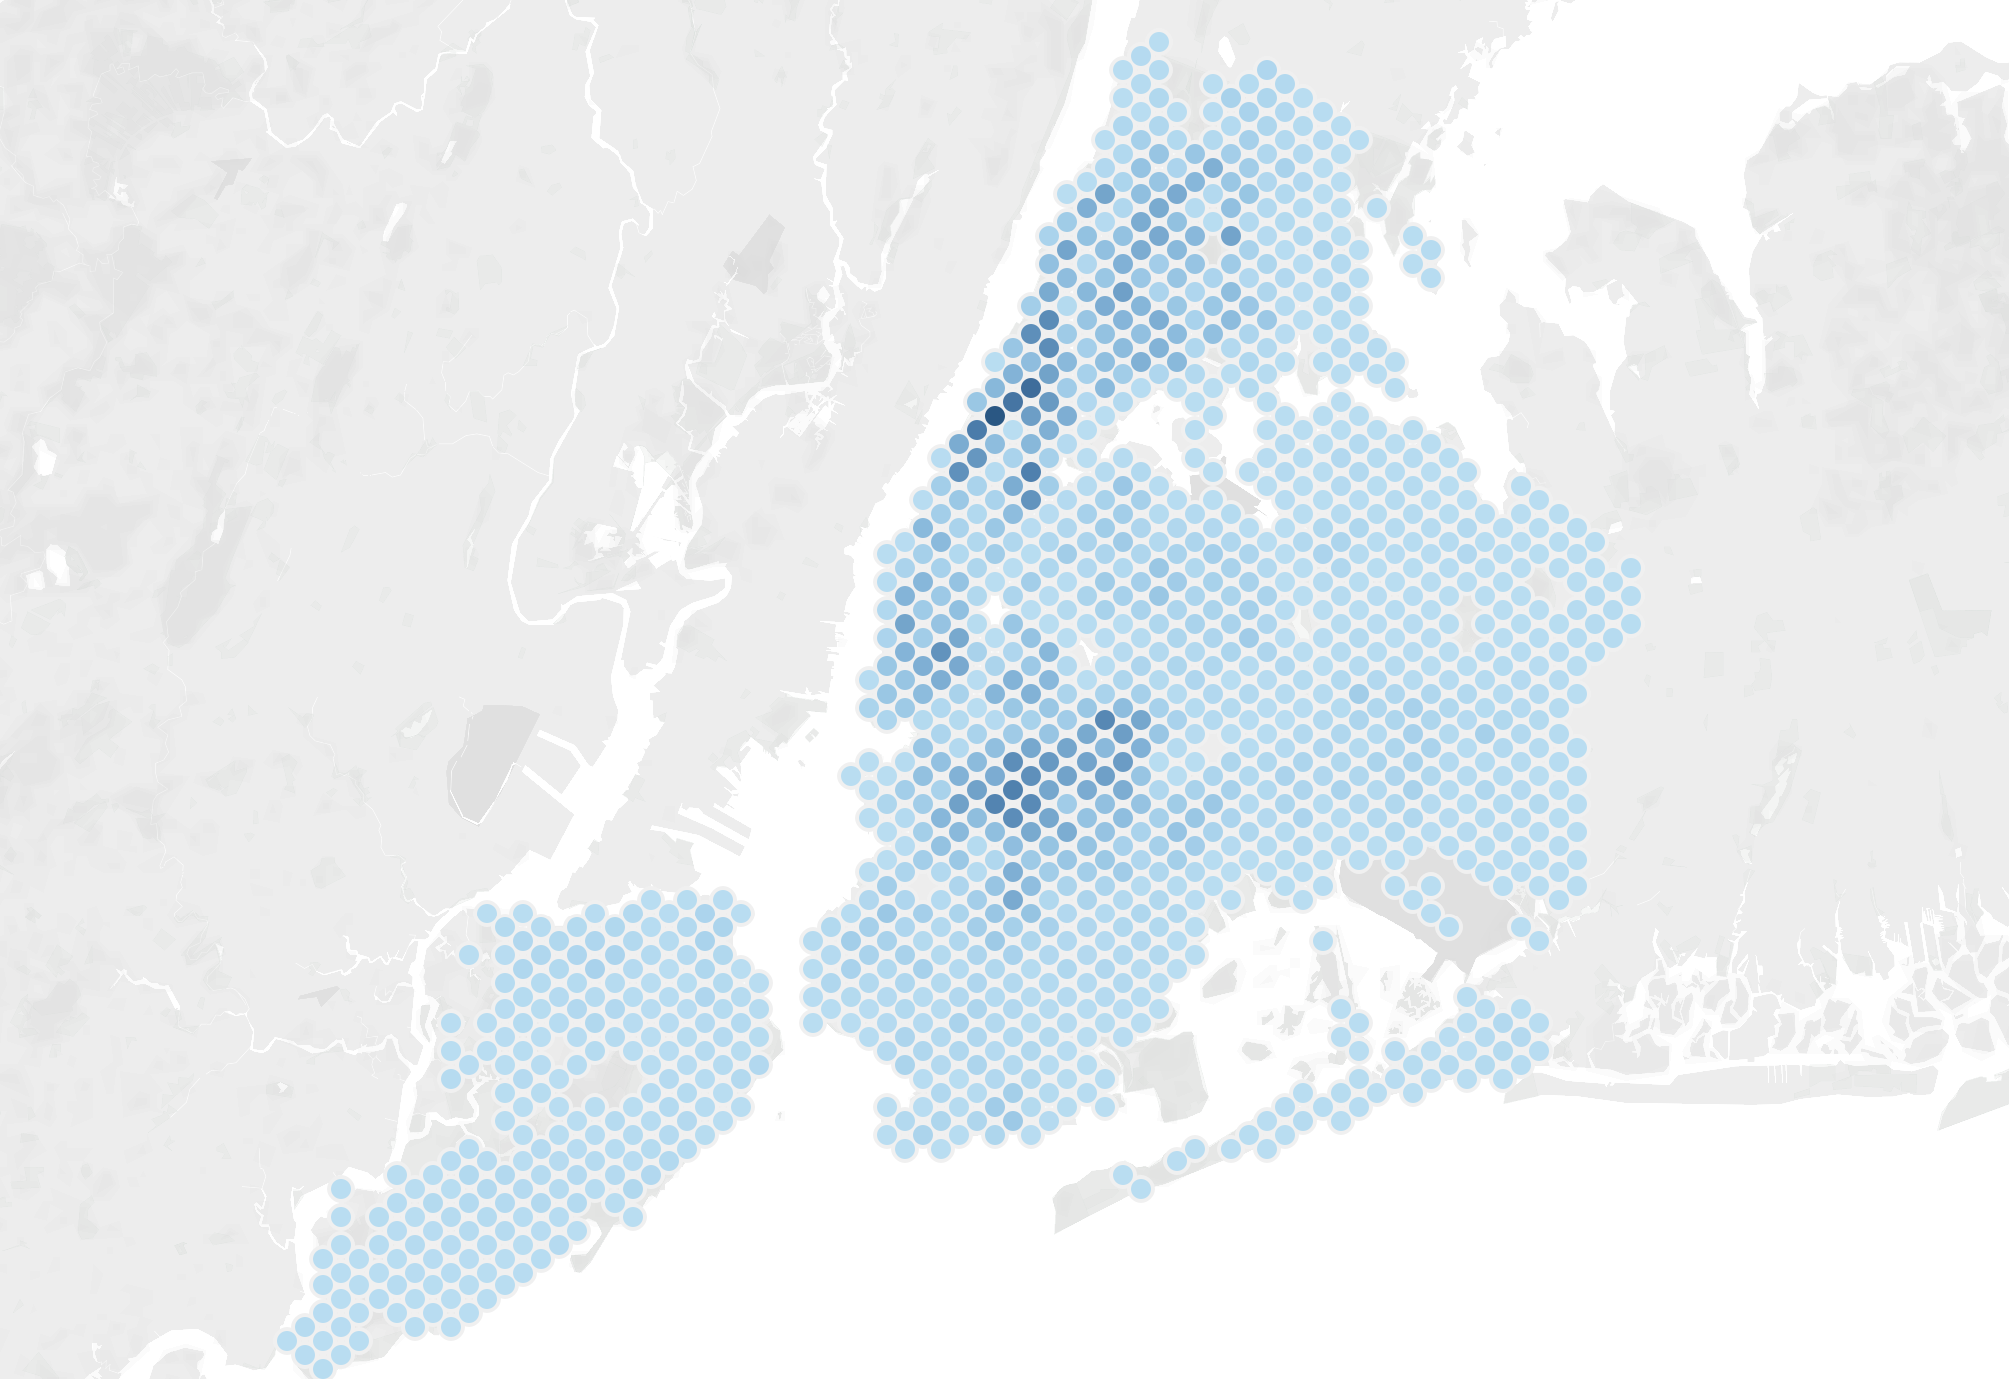
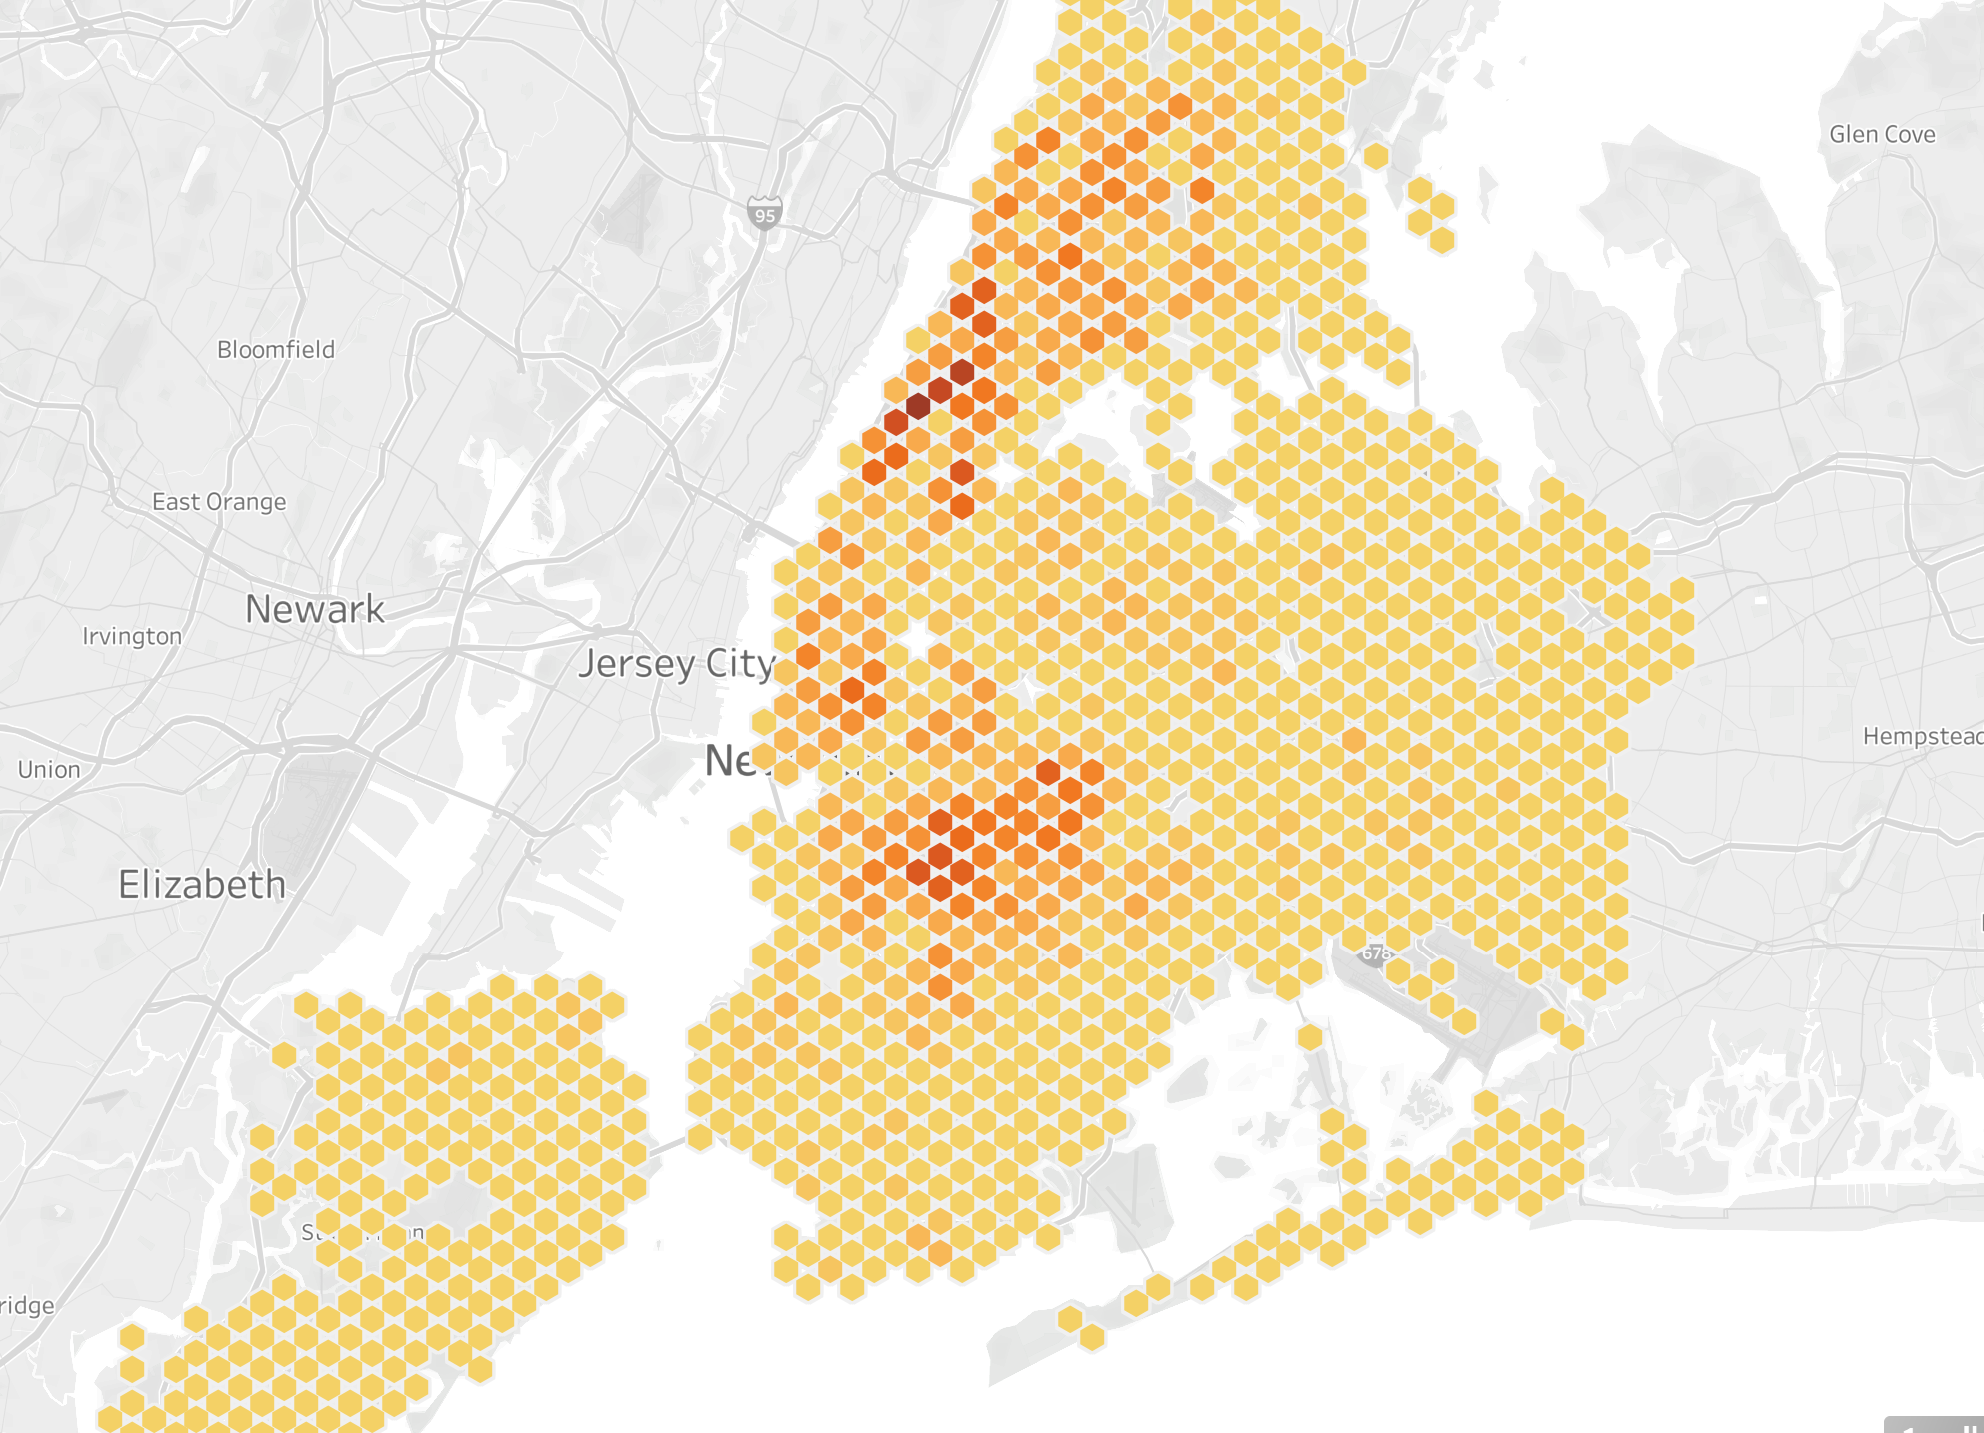
In this blog I will be teaching you step by step how to produce the following Hexbin map using data for rat sightings in New York:
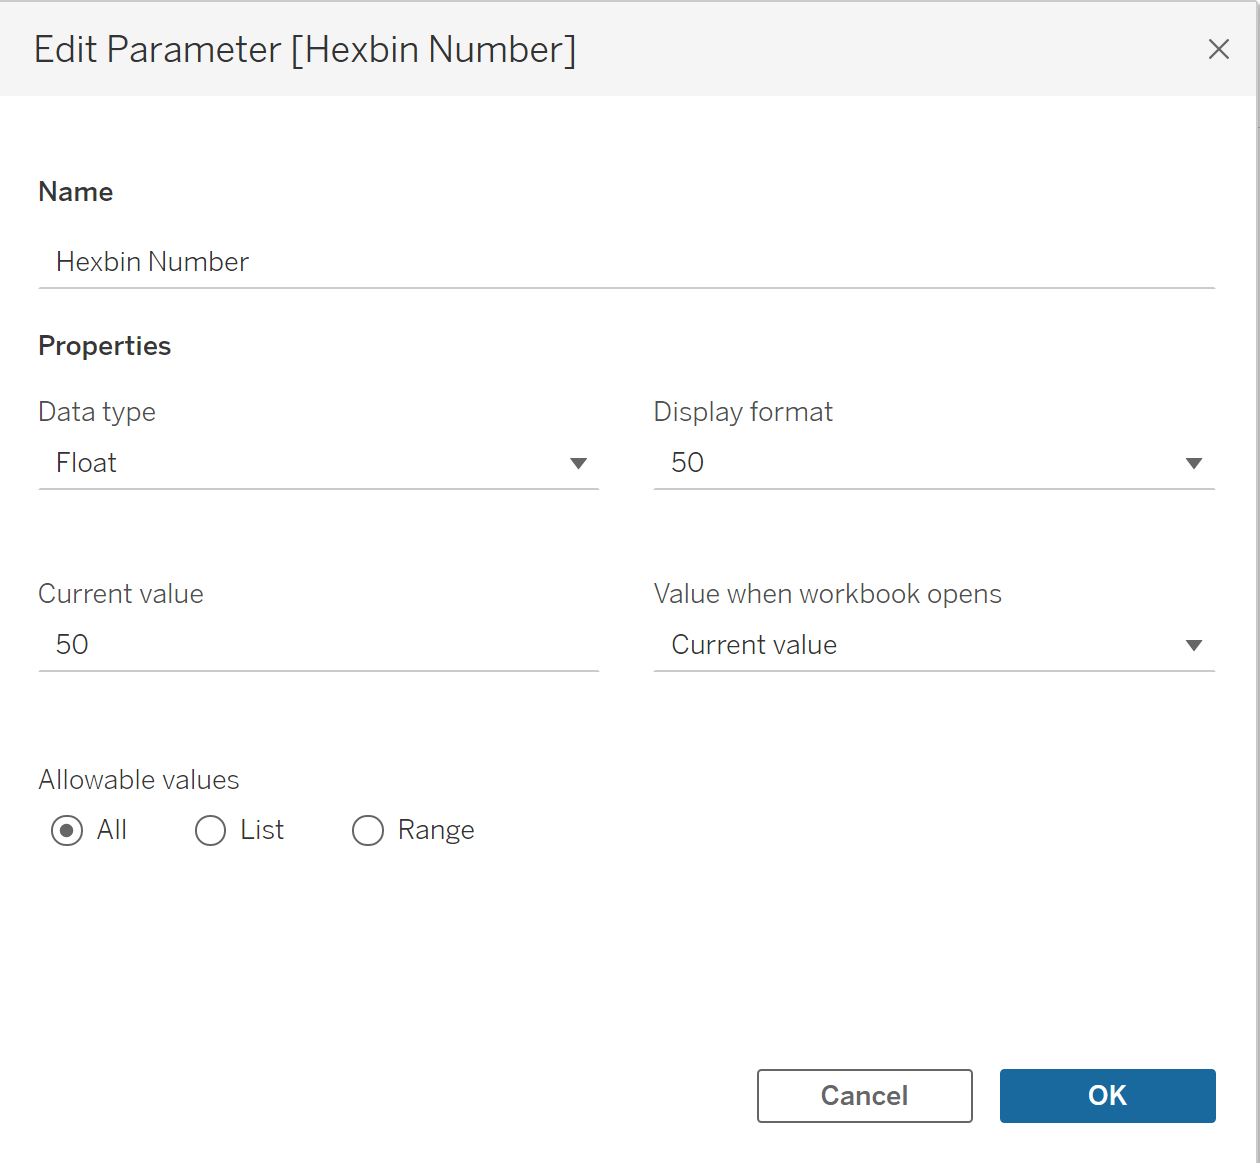
The first thing you should do is create a parameter. I say "should" because you can just put a fixed number in the Hexbin calculations but it will mean you won't be able to change the number of Hexbins on the map without editing the calculation.
Set the initial parameter at around 50.
Now you need to create your Hexbin coordinates using the coordinates from the dataset. Create 2 calculated fields using the following formulae:


The only difference between the two formulae is the initial function name:
- HexbinX for longitude
- HexbinY for latitude
Your 2 Hexbin coordinates have now been created but they have automatically been created as measures. you need to drag them up into the dimensions section of the data pane. You'll know you've done this correctly if they change from green to blue in colour.

Now change the data type to their respective geographic roles of latitude and longitude.
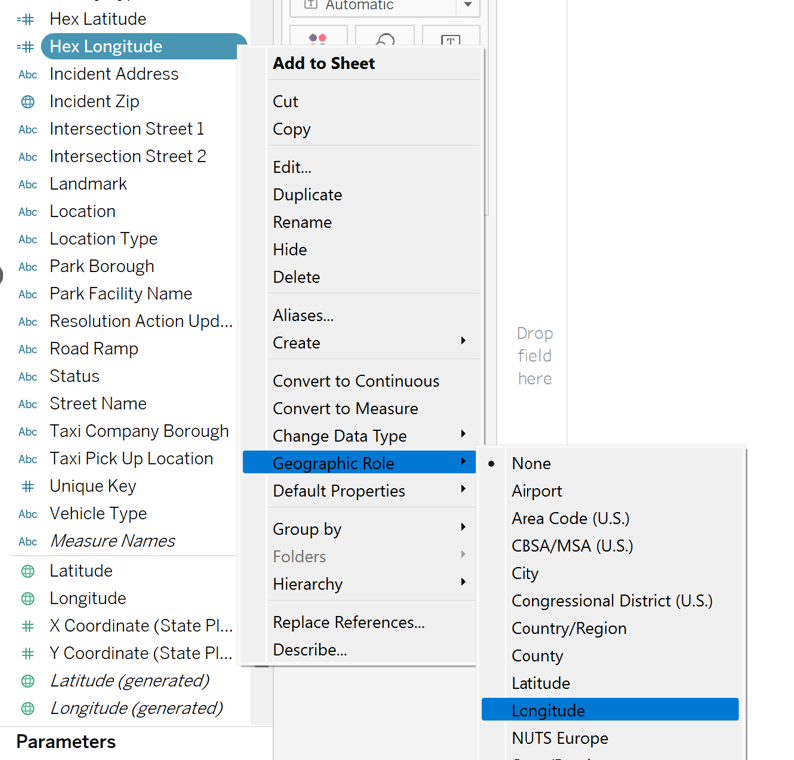
They should now display green globes next to their titles.

Now drag Hex Longitude onto Columns, Hex latitude onto Rows and the rat sightings count measure onto colour to get a basic hexbin density map:
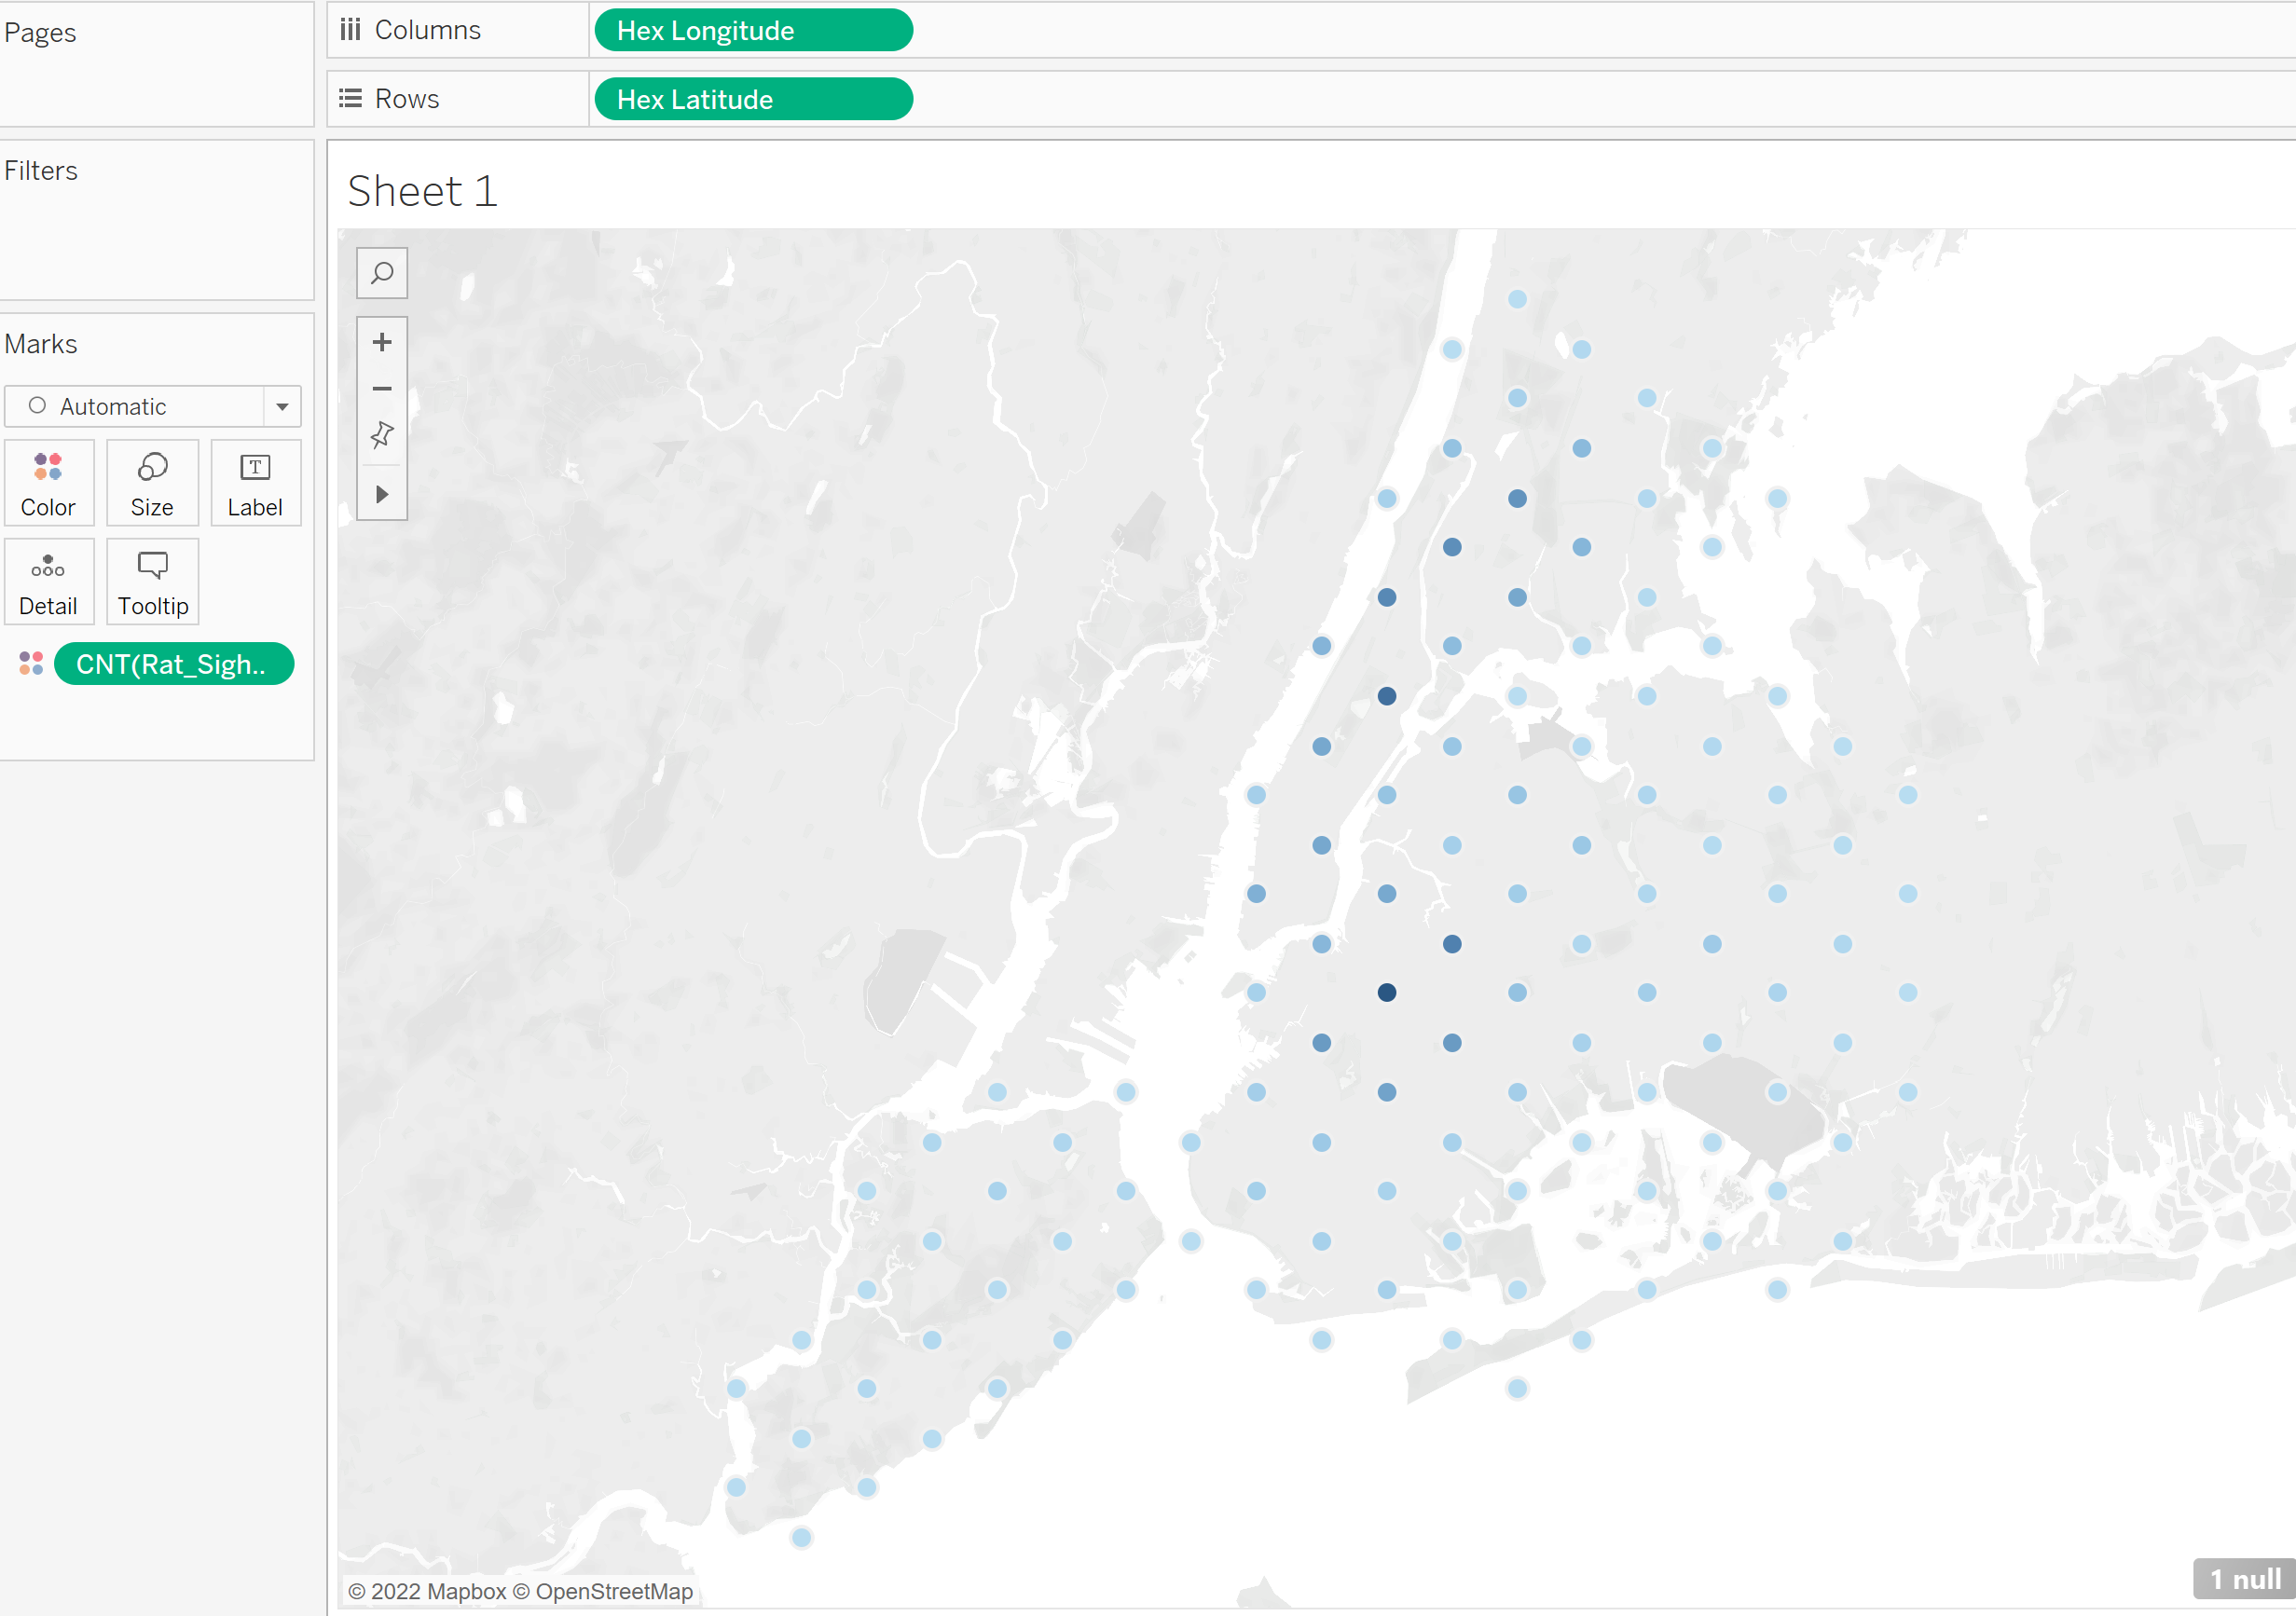
Right click on your parameter and selct show parameter, you can now change the number to adjust how many hexbins you want to display in the map. This is down to personal taste and varies map to map but in this case I feel 200 works very well.

You can now adjust colurs and map layers to taste.
I hope this blog was useful to you, thank you for reading!
