


In this blog I'm going to demonstrate how to make a basic density map using spatial data in Tableau. For this example I will be using rat sighting data based in New York.
My goal is to make a density map showing where rat sightings are the most frequent in New York. The Key pieces of information I have in this set are Latitude & Longitude for locating the sightings and Unique Key for distinguishing each individual sighting.
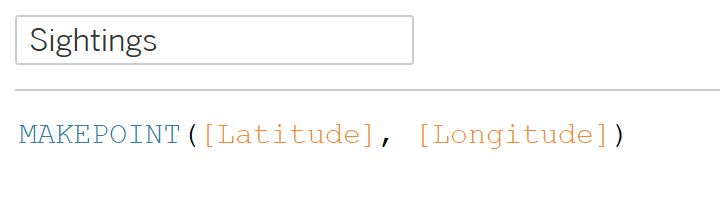
The first step is to use Longitude and Latitude data to create your sighting points for use in the map. To do this create a calculated field with the following formula:
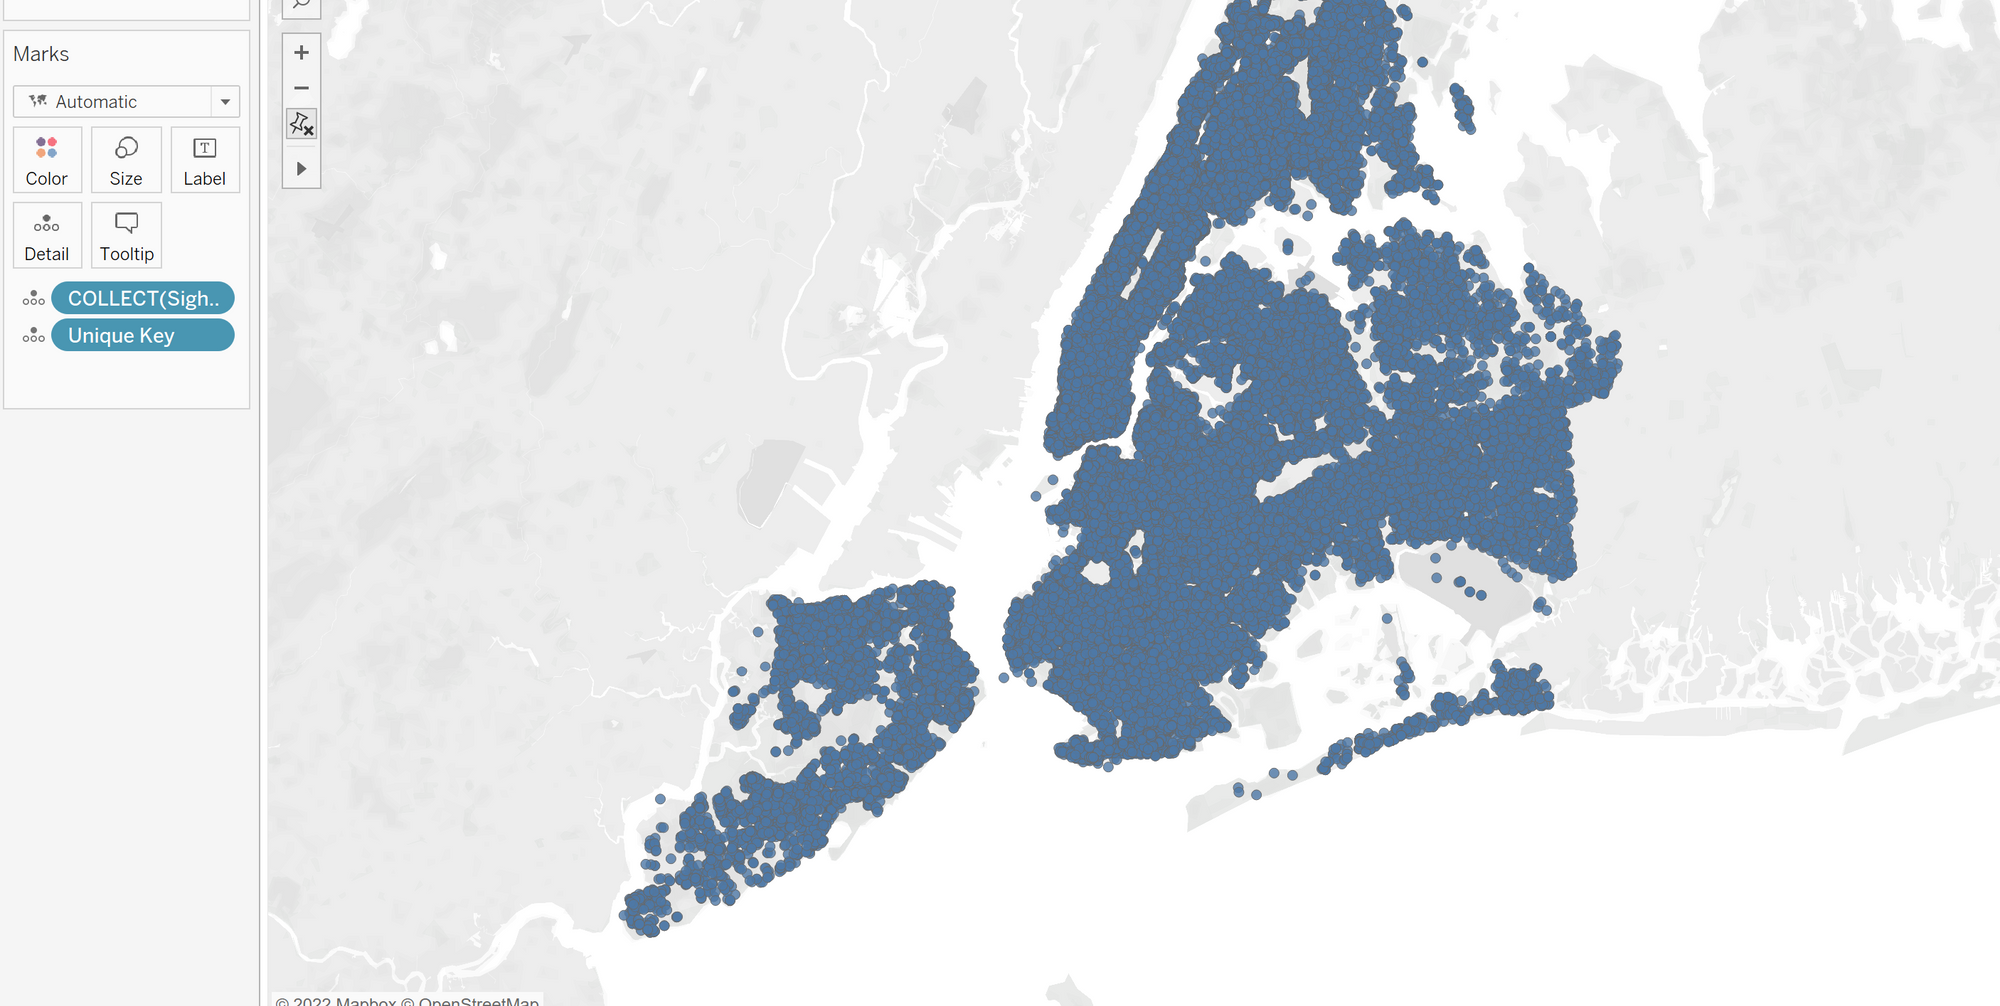
The next step is to add the newly created sightings field to the detail mark, followed by the unique ID, resulting in the following:
Now change the chart type in the marks card from Automatic to Density and voila, you have a density map!
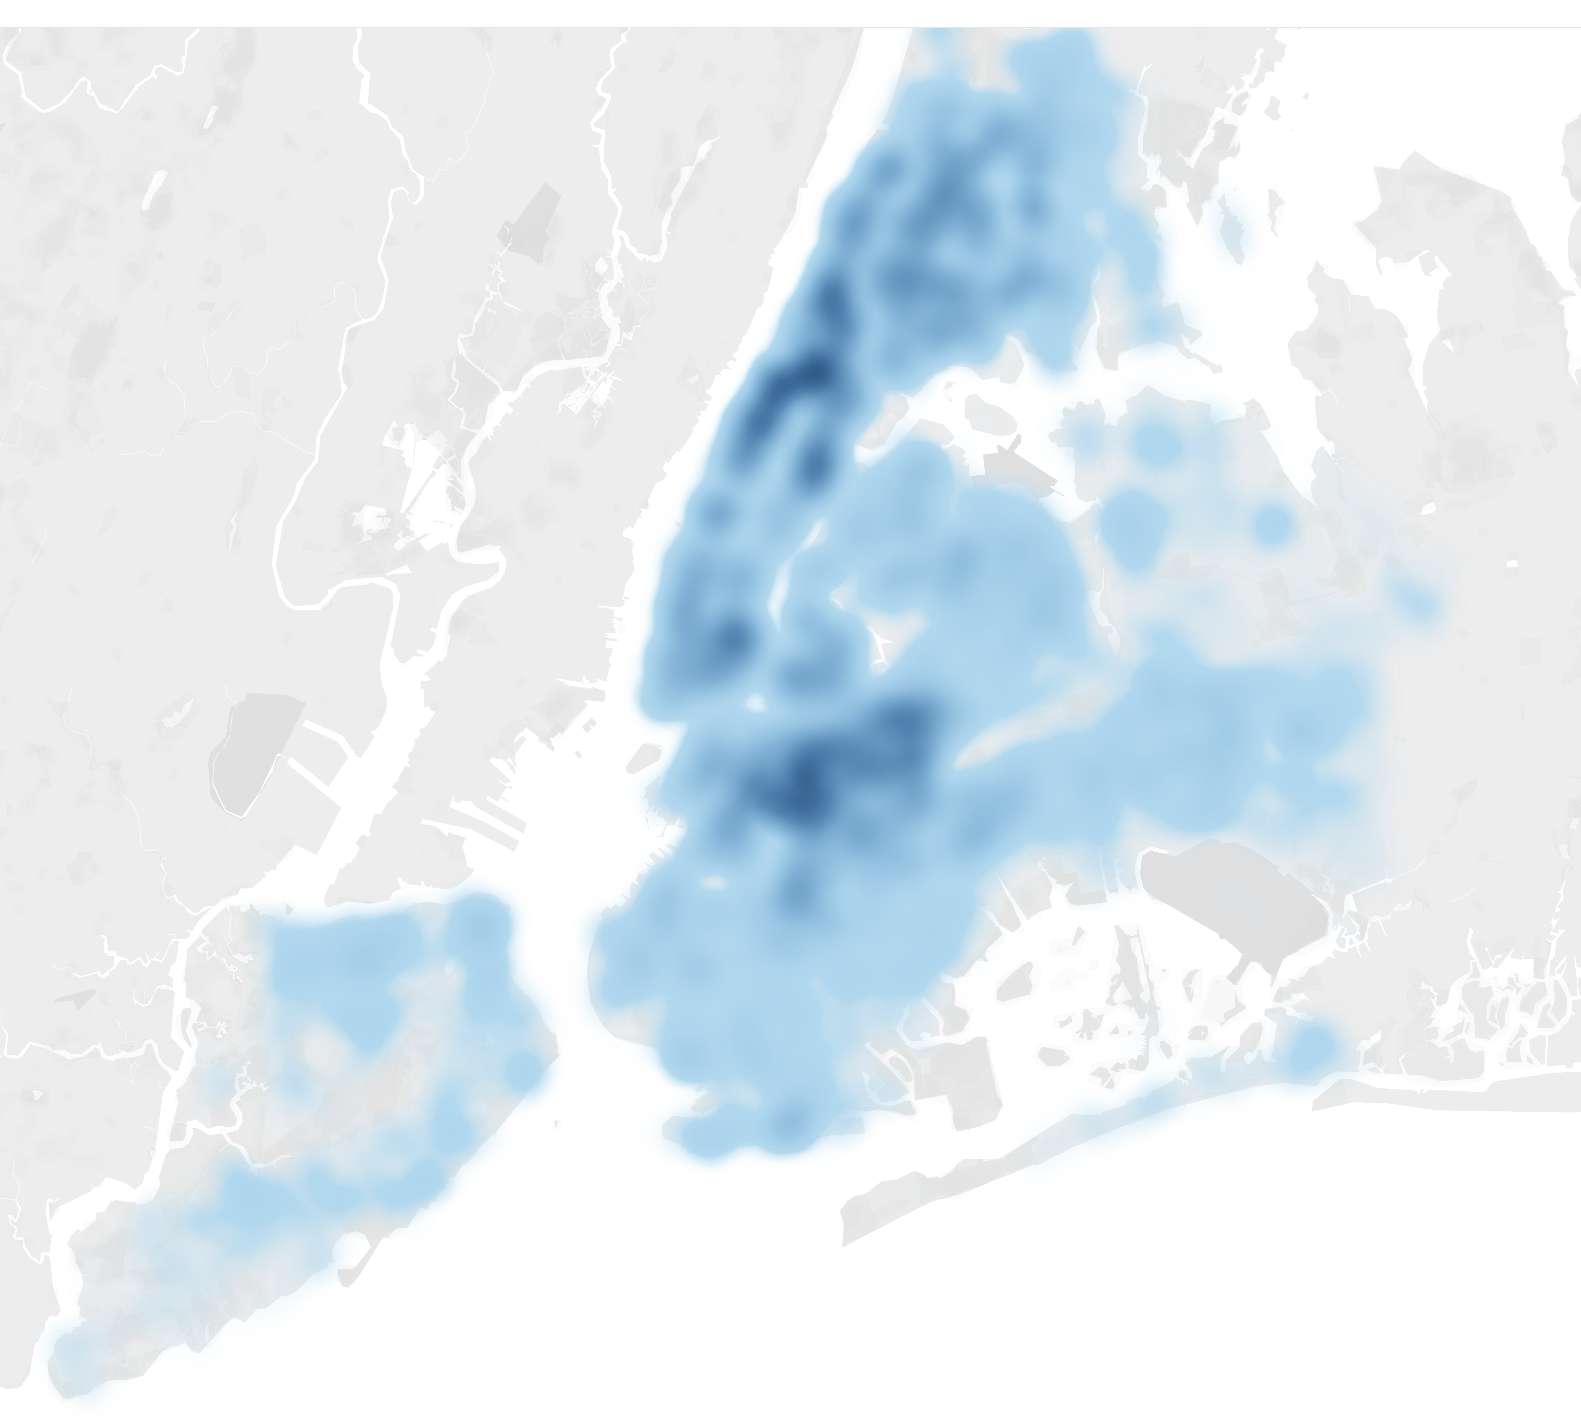
Feel free to mess around with the colour palette to change the colour of the density map according to your taste.
I hope this was helpful!