


When you start working with a dataset, you quickly realise that the most useful insights aren’t always there from the start. A lot of the time, they’re things you have to build yourself from the data you already have. That’s where calculated fields in Tableau really come to hand.
Calculated fields let you reshape your data in whatever way you need, creating new metrics, applying conditions, or just making the analysis clearer and more useful for whoever’s looking at it. They give you the freedom to go beyond the raw data and start answering the questions.
To create a calculated field, you write a function. This is how you tell Tableau what to do with the data. Tableau groups its functions into nine categories, including categories such as: Number, String, Date, Aggregate, and Logical functions, each designed for a different kind of task.
This post focuses on Logical Functions, which is one of the most useful categories when you want your analysis to think conditionally.
Logical Functions:
Logical functions in Tableau are all about adding decision-making into your analysis. They let you set conditions and check whether those conditions are met, essentially asking “is this true or false?”.
While that is the foundation, logical functions become much more useful when you decide what should happen as a result of that condition being met.
Because of this, logical functions are especially powerful for categorising data, applying rules, and shaping how information is displayed, or, filtering. They help turn raw numbers into insights by letting your data follow the same kind of logic you’d use when making decisions in the real world.
The logical functions below have been grouped together to explain them easily. These groups are not how they will always form, and the functions within these specified groups are not constricted to only working with the functions mentioned within their explanation group.
IF/AND/END Explanation:
This example shows a calculated field with three functions: IF, AND, END.
IF: IF is the foundation of conditional logic in Tableau. It tells Tableau what to check by looking at specific fields and evaluating whether a condition is true or false.
AND: AND lets you combine multiple conditions within the same IF statement. It ensures that all conditions must be true before Tableau returns a result – eg. ‘Home Office’ AND ‘Houston’.
END: END simply closes the calculation. It tells Tableau that the conditional logic is finished and the expression can be evaluated.
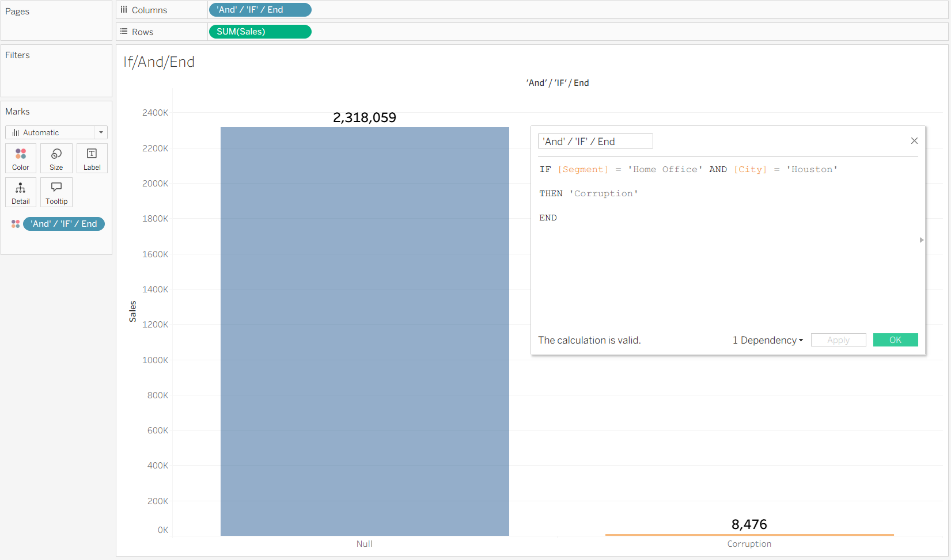
In the example:
IF [Segment] = 'Home Office' AND [City] = 'Houston' - IF looks into the specific field before you define your conditional calc.
AND is used to add multiple measures.
THEN 'Corruption' - THEN defines what you are looking for
END – end the calc
CASE, WHEN, THEN, ELSE Explanation:
CASE: CASE is used to categorise values within a single field. It’s especially useful when you want to group or relabel multiple values in a clear, structured way.
WHEN: WHEN is required in ‘CASE’ expressions. It tells tableau to find the values that match the expression.
- When ‘Home Office’ then ‘Corruption’
THEN: THEN is required in ‘IF’ /‘ELSEIF’ /‘CASE’ as whatever you write after THEN is the value Tableau returns when a condition is met.
- THEN ‘Corruption’
ElSE: Optional part of ‘IF’ or ‘CASE’ statement used to return a value when the expressions in your criteria are not returned.
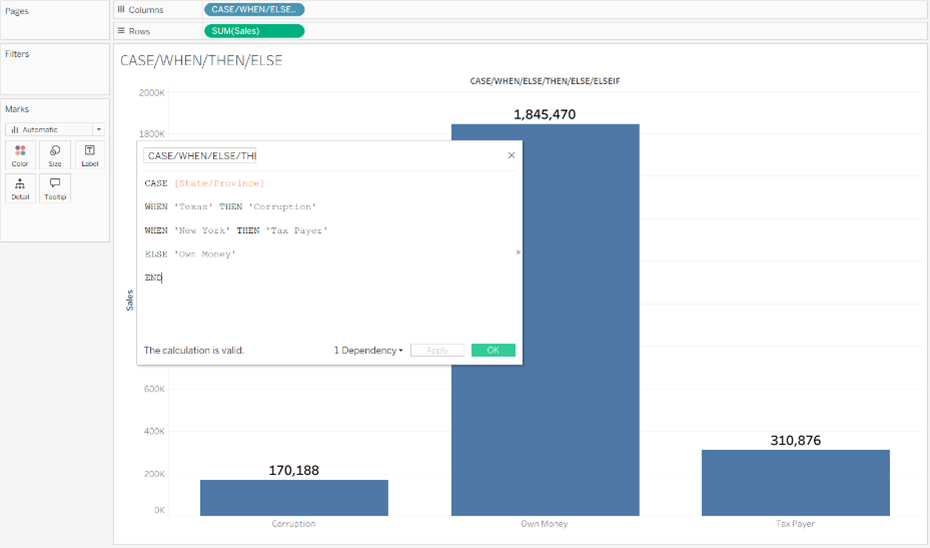
In the example:
CASE [State/Province] - look at the category of state.
WHEN 'Texas' THEN 'Corruption' - WHEN the category is state THEN return corruption.
WHEN 'New York' THEN 'Tax Payer' - WHEN the category is New York THEN return ‘tax payer’.
ELSE 'Own Money' - ELSE (if none of the conditions are satisfied) – return ‘own money’.
END
ELSEIF Explanation:
ELSEIF: ELSEIF lets you check additional conditions once the initial IF has been tested. It’s useful when your logic needs to handle more than one scenario, beyond the initial IF.
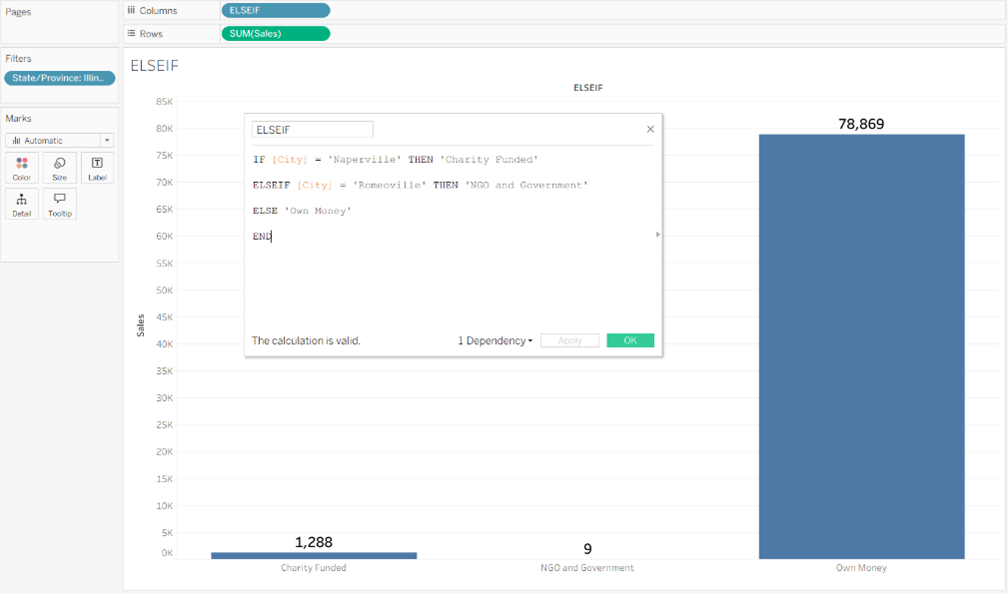
IF [City] = 'Naperville' THEN 'Charity Funded' – define the category with IF and THEN choose what you change it to.
ELSEIF [City] = 'Romeoville' THEN 'NGO and Government' – used to specify a different condition which isn’t the original IF.
ELSE 'Own Money' – ELSE used to define the rest of the category.
END – end of expression.
IFNULL, ZN, ISNULL Explanation:
IFNULL: – If there are null records in your data, then you can use IFNULL to replace them.
- If you have a field where people tick yes to running in the last week and tick no to not running, people may not tick no – this will leave your data null.
IFNULL ([Weekly Running], ‘NO’) – the IFNULL expression returns ‘NO’
ZN: Returns an expression if the record isn’t null
- If they ticked they did run, return its value (which would be 1), otherwise, return a 0.
ZN([Weekly Running])
ISNULL: Returns true if the expression is null.
ISNULL([Weekly Running]) - is the weekly running field null? If so, true will return.
OR, NOT Explanation:
OR: allows you to link two conditions which are separate
IF <exprs1> or <expres2> THEN ‘xxxxx’ END
- Meet either of those conditions
NOT: Used as a Boolean output
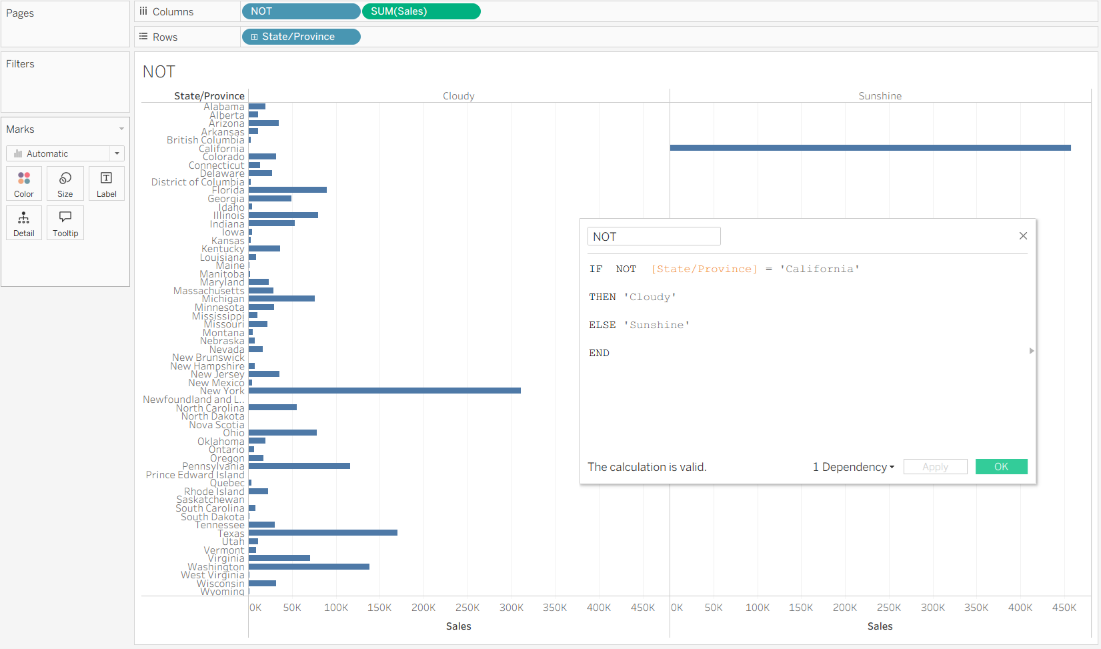
IF NOT [State/Province] = 'California' - true or false output (Boolean)
THEN 'Cloudy' – stipulate what the expression will be
ELSE 'Sunshine'
END
IN Explanation:
IN: Boolean function
Returns true if any value matches the expression
‘Houston’ in ‘Texas’ = True
- Used as a tool to double check data
Immediate IIF Explanation:
IIF: Checks whether a condition is met in the data. Similar to an IF statement and you do not need to use ELSE, THEN, END.
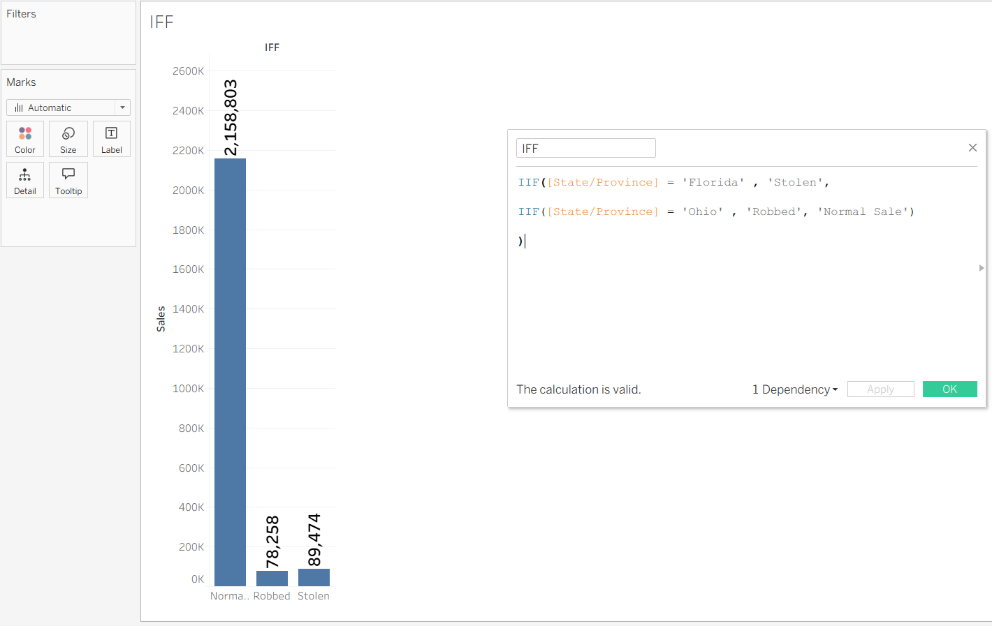
IIF ([state] = ‘Florida’ , ‘Stolen’) – If this is true then return it, if not, look at the next expression.
IF THIS IS TRUE THEN RETURN THIS, IF NOT LOOK AT THE NEXT EXPRESSION
IIF (‘State’ = ‘Ohio’ , ‘Robbed’ , ‘Normal Sale’)) - Otherwise look to see if state is Ohio then it is defined as ‘Robbed’, otherwise define as ‘Normal Sale’.
Overall, Logical Functions are a simple but powerful way to make your dashboards feel smarter and more intentional. They help bring structure and clarity to the stories your data is telling.