


In the morning we participated in an in-depth training session focused on accessibility in Tableau. We covered WCAG guidelines, colour contrast, and how assistive technologies like screen readers interact with data visualisations. For today's Dashboard Week challenge, our objective was to immediately apply these principles to a highly constrained, real-world scenario.
The Brief: Designing for Keyboard-Only Navigation
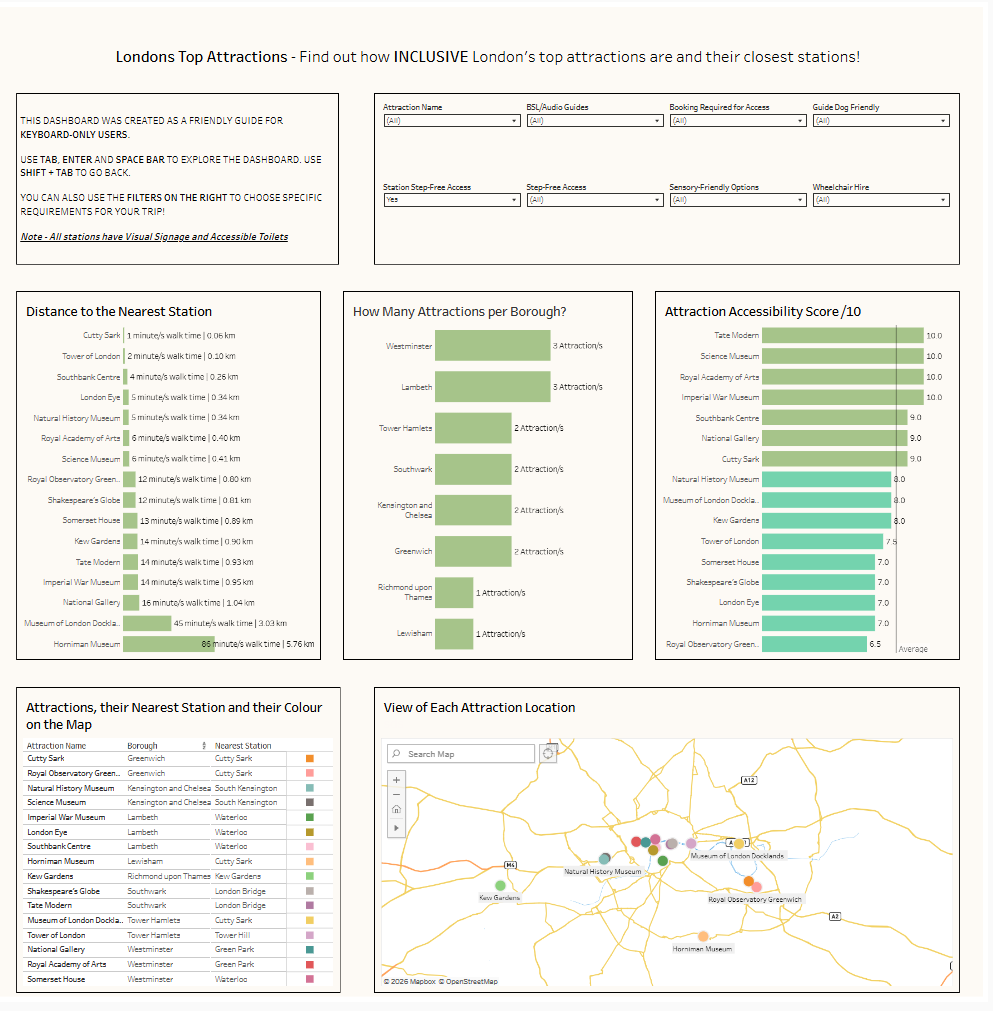
Our client required a dashboard to assess the inclusivity of the city's top attractions and Transport for London stations. The primary end-user is an expert consultant in accessible urban design. This user has a visual impairment and relies entirely on keyboard navigation - using Tab, Shift + Tab, Enter, and Space.
The core requirement: the dashboard had to be fully navigable, efficient, and insightful without any mouse interaction.
Rethinking Tableau Development
When you remove mouse interactivity, standard Tableau dashboarding techniques have to be fundamentally re-evaluated. Every design choice must prioritize the "Z-order", the sequence in which a keyboard tabs through the dashboard elements.
Here are the technical strategies I implemented to meet the brief:
1. Strict Container Hierarchies for Tab Order Tableau defines tab order based on the underlying structure of layout containers, generally reading left-to-right and top-to-bottom. The dashboard was constructed using strict Horizontal and Vertical containers, ensuring the focus moved logically from the title, to the filters, and then through the visualizations.
2. Accessible Controls and Instructions Sliders are notoriously difficult to operate via keyboard. All interactive elements were restricted to Single or Multiple Value Dropdowns and Checkboxes.
3. Resolving the Spatial Data Dilemma (Map vs. Table) Maps present a significant barrier for accessibility; tabbing through scattered spatial marks is inefficient and provides no contextual grouping for a screen reader.
However, geographic context was vital for this dataset. To solve this, I placed a map directly next to a detailed text table. To bridge the two, I colour-coordinated the marks on the map with the corresponding rows in the table. This allows users to easily cross-reference a location, keyboard-only users can simply tab past the map and directly into the table to consume the underlying details without getting trapped in the spatial marks.
Engineering Data for a Better User Experience
I engineered several calculated fields to reduce their cognitive load and speed up the analysis:
- Composite Accessibility Score (out of 10): Rather than forcing the user to tab through ten separate boolean columns (e.g., Step-Free Access, BSL Guides, Wheelchair Hire), I created a calculated field that converted these 'Yes/No' text values into integers. This generated a clean score out of 10 for every attraction, which I visualised in a descending horizontal bar chart.
- Contextualizing Distance: The raw dataset provided the distance to the nearest station in kilometres. Distance is abstract, thus when planning accessible routes I created a calculation to convert this metric into an "Estimated Walk Time" (assuming 1km equals roughly a 15-minute walk).
- Dynamic Average Colouring: To highlight top performers instantly, I applied a WINDOW_AVG table calculation to the accessibility scores. This boolean calculation was dropped onto the colour mark, dynamically shading bars above the average a distinct colour from those below. (This was carefully mapped to a colourblind-friendly palette to maintain WCAG compliance).
The Final Dashboard
Feedback:
To ensure text uniformity without compromising accessibility, I should avoid using all-uppercase styling, as it actually reduces readability and creates accessibility barriers for users. Additionally, I should be using the bar graph as an interactive filter for the attractions, which could streamline the interface by replacing the standalone attraction filter entirely.
Final Thoughts
Designing for accessibility is not just a compliance exercise, it is an exercise in clarity. It forces you to strip away unnecessary visual clutter, rethink complex chart types, and focus entirely on how efficiently a user can extract insights. By prioritising keyboard navigation, the resulting dashboard is not only accessible for our specific user but functionally cleaner for everyone.