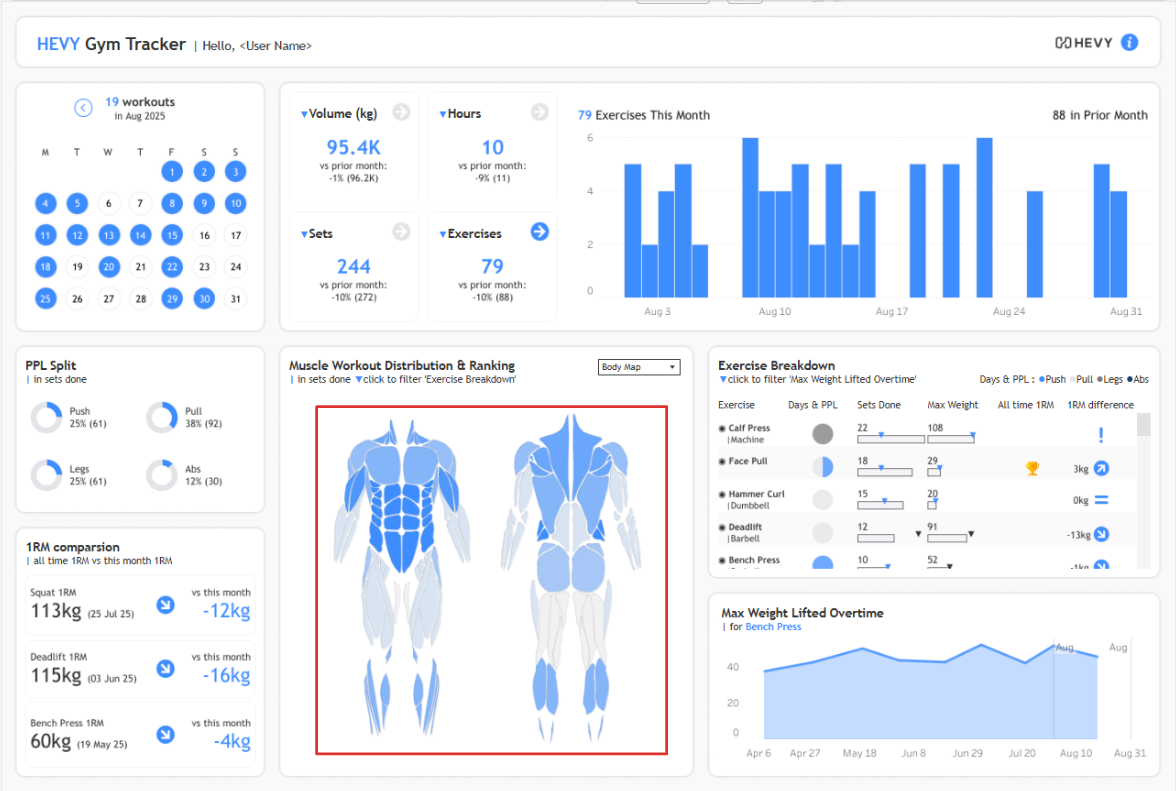
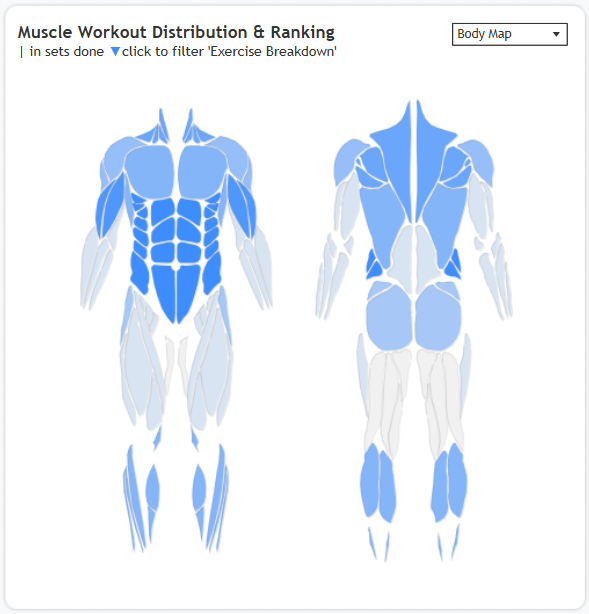
I recently built a Gym Tracker dashboard in Tableau using data from my gym app, Hevy, and created a body map to visualise muscle engagement.
A lot of people have asked how I did it, so this blog has one of two methods I evaluated. This method uses CBI Studio to create the body map and is the one I used for my dashboard. The second option, which I'll create another blog for after this, is using Inkscape and SVGs.
Quick comparison:
- CBI Studio : lower effort, but repetitive and a bit time-consuming
- Inkscape (SVGs) : more technical, but can be quicker depending on your reference image
Both options are completely free.
Step-by-step (CBI Studio method)
Step 1 : Find a reference image and upload it into CBI Studio
Step 2 : Select the polygon tool and trace over the areas you want
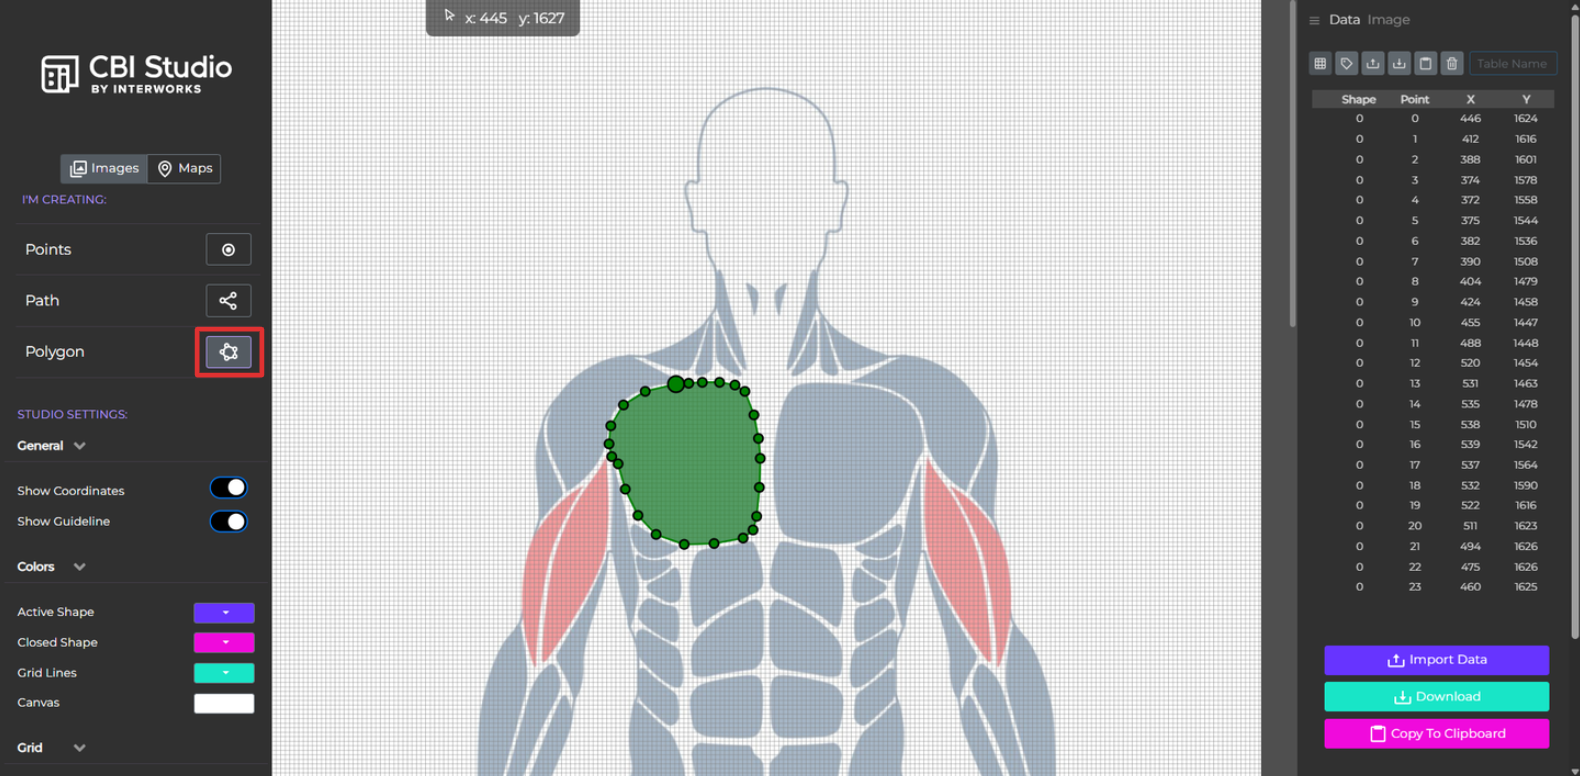
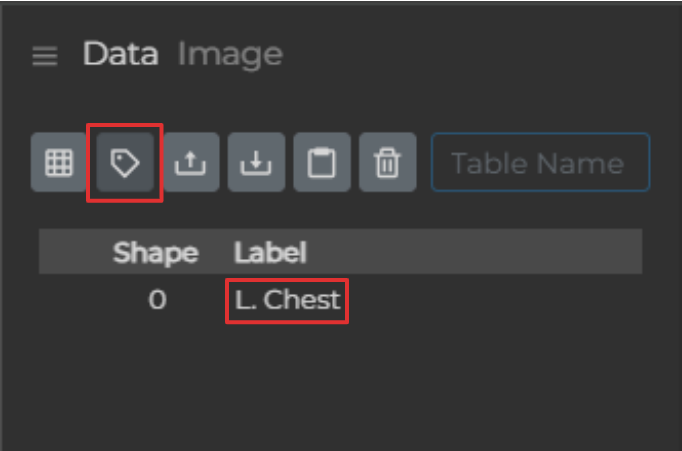
Tip : You can rename shapes using “Edit Shape Label”
Step 3 : Export the coordinates as a CSV and bring it into Tableau
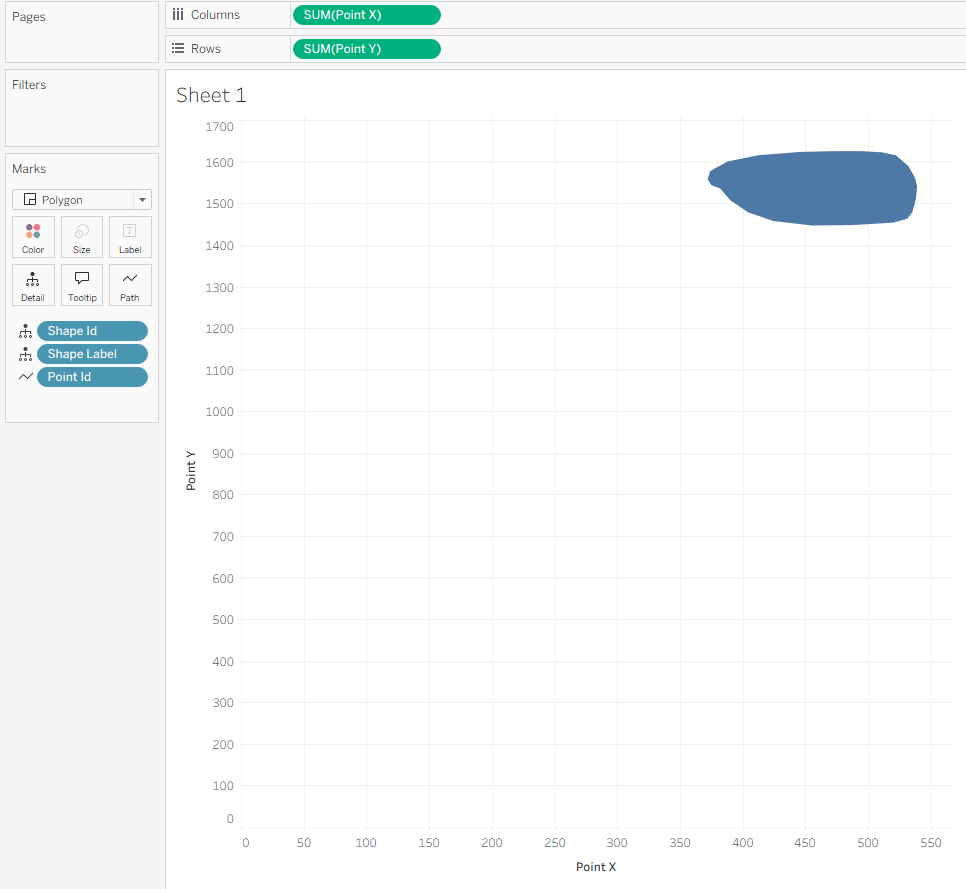
When you first plot this, it’ll probably look distorted. That’s expected. To fix it, match axes to the pixel dimensions of your original image:
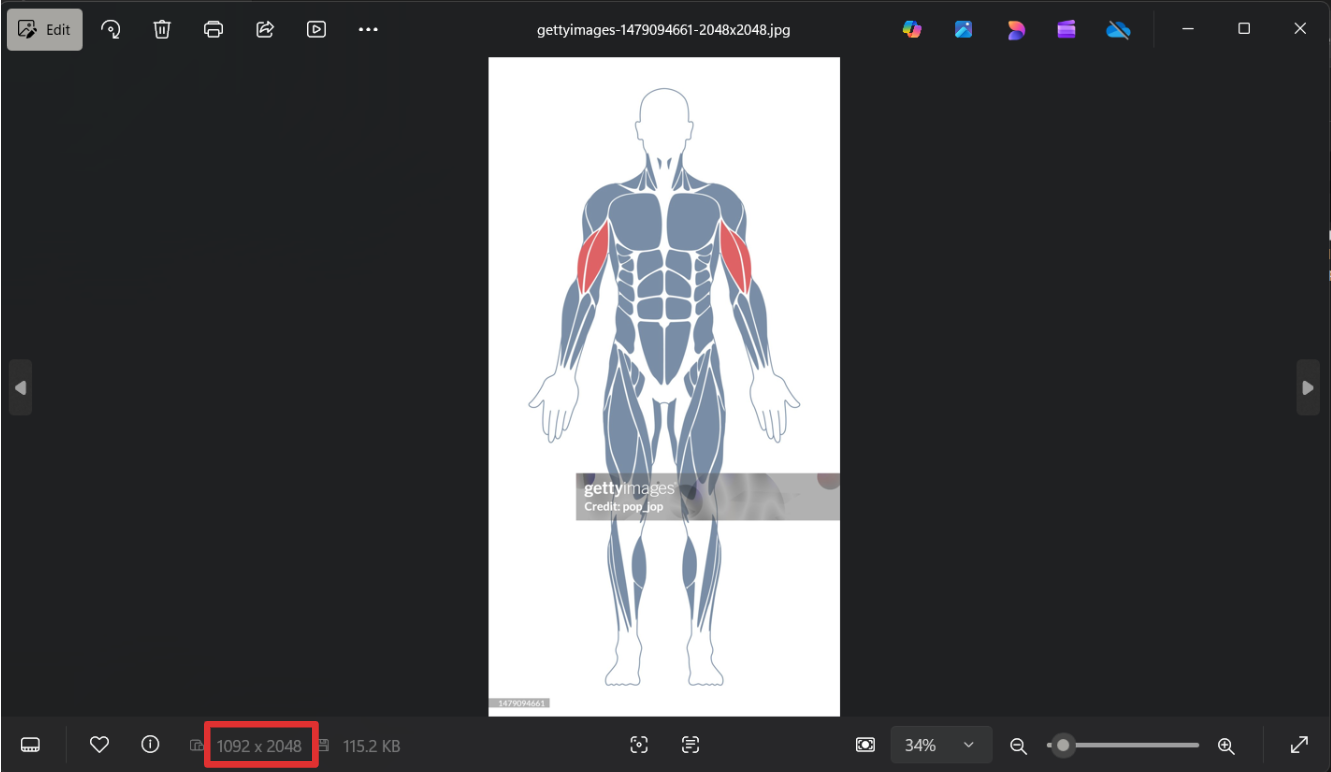
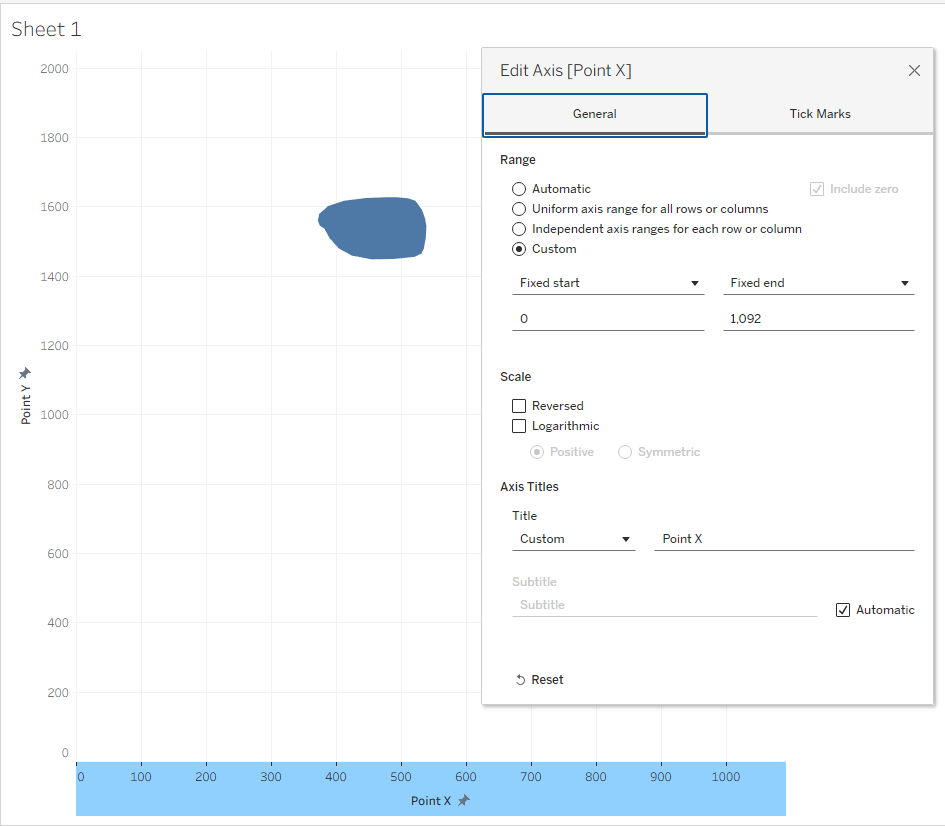
- Set your X and Y axis ranges to match the image resolution
- Example: my image was 1092 × 2048, so X = 1092 and Y = 2048
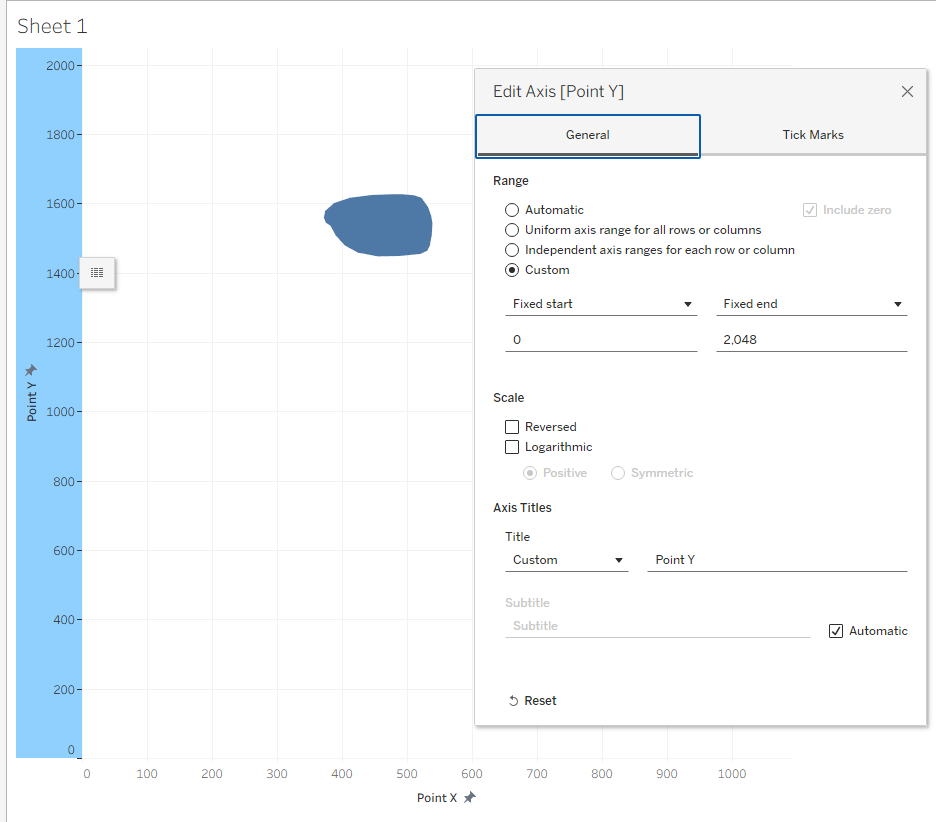
You may also need to tweak the axis starting points as needed. A quick way to do this is:
- Use tooltips to find the minimum X and Y values
- Adjust the axis ranges accordingly until everything lines up properly
Bonus step : Turn it into a map (more flexibility)
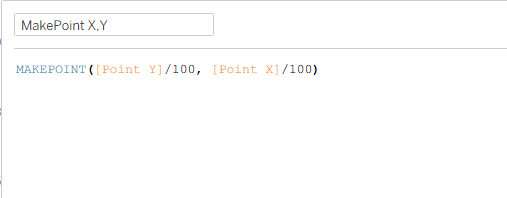
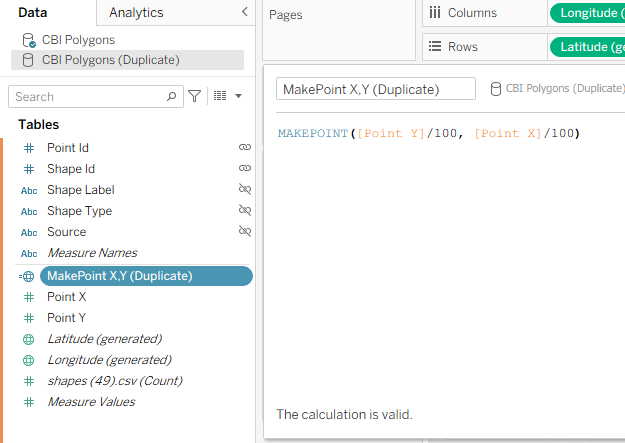
Create a MAEPOINT() calculated field that converts X and Y into latitude and longitude. Since lat/long values have a limited range, you’ll likely need to scale your values (I divided mine by 100).
Once that’s done:
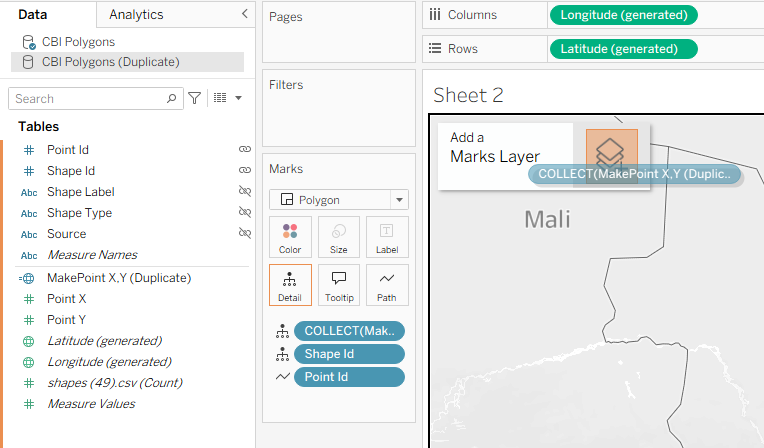
- Set the mark type to Polygon (same as before)
- You now have a “map”, which means you can use map layers and more advanced features
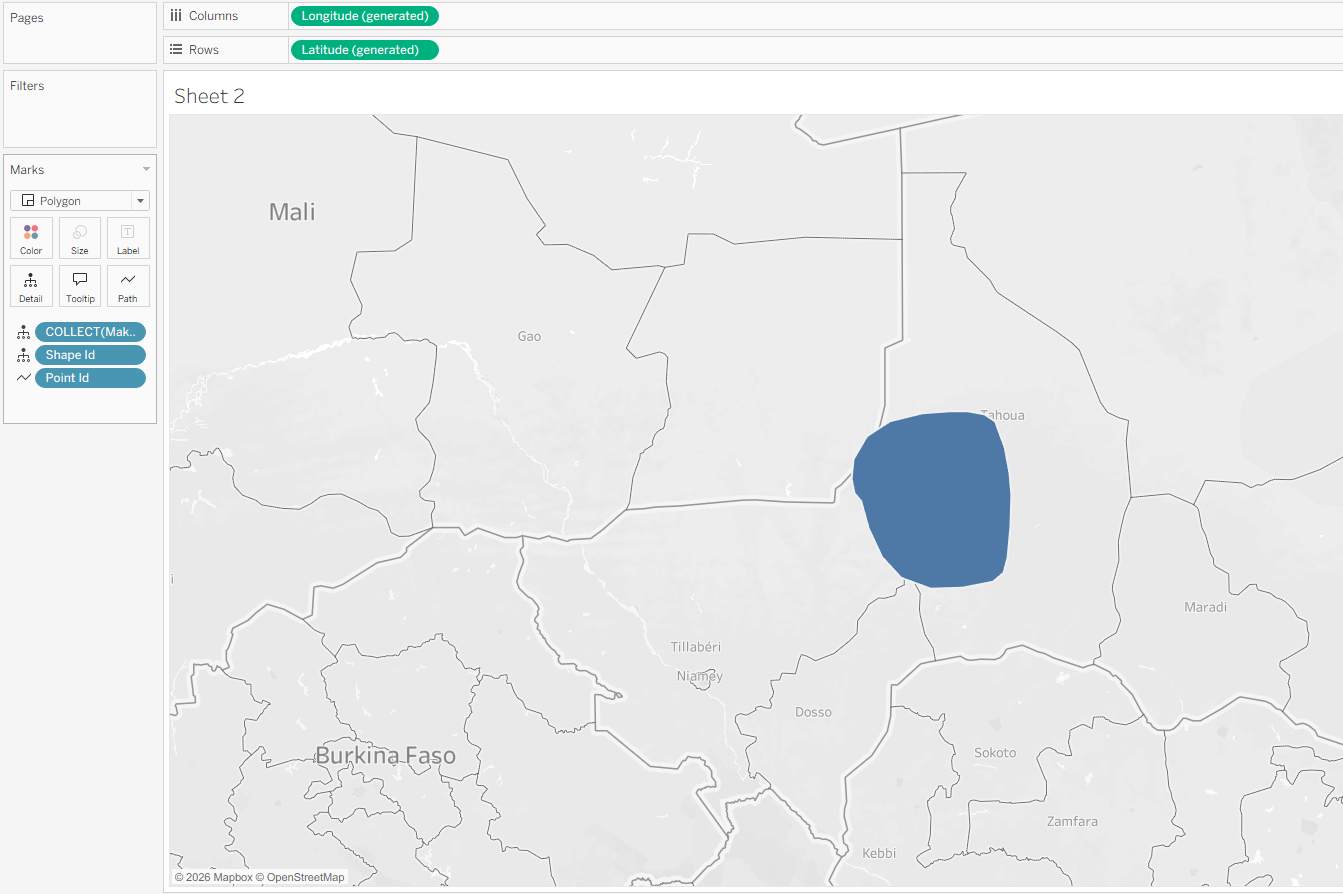
After all that polygon tracing in CBI Studio, you’ll end up with something fully interactive-filters, tooltips, highlights-just like any other Tableau visual.
Bonus step 2 : Handling filters
One issue you might run into: filters can make polygons disappear.
Example: if you filter to January and didn’t train abs, the abs polygon won’t show at all and you might want to keep the outline at least for visual purposes.
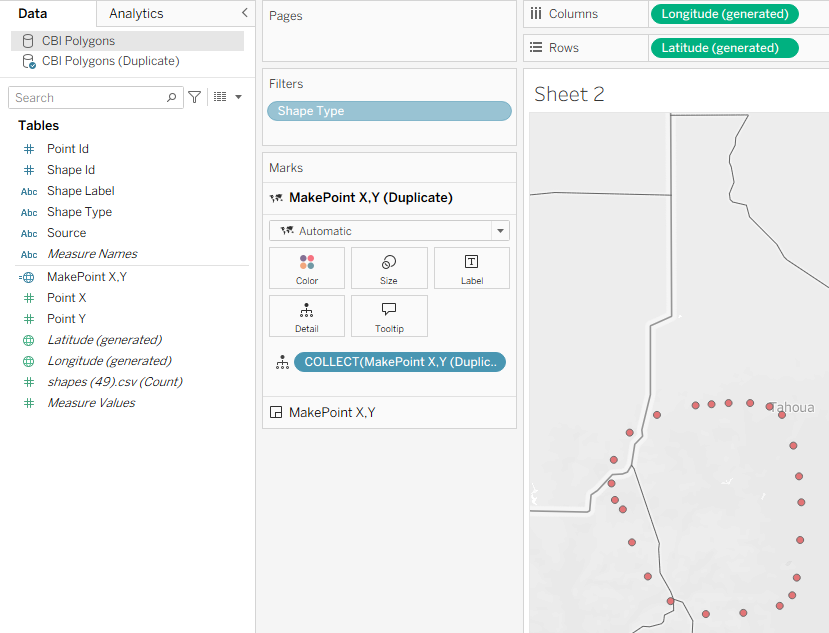
Workaround: duplicate your data source and use it as a background layer.
Here’s how:
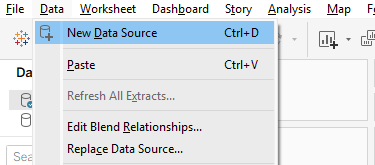
- Duplicate your original data source by connecting to the same one again
- Recreate the MAKEPOINT() calculation
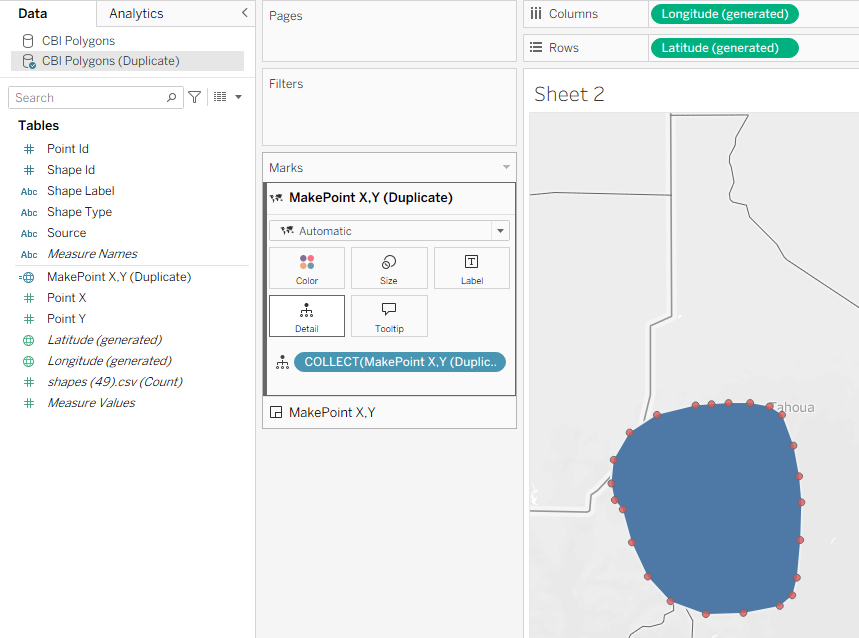
- Add this field as a second map layer on the same sheet
Here, the blue polygon is the original data source (CBI Polygons) and the red circles is the duplicated data source (CBI Polygons Duplicate)
Use fields from your main data source for filtering. Because they don't connect to the duplicated data source, the points on the duplicated data source won't be filtered. This keeps all body parts visible, even when there’s no data for them.