


Thinking through data transformations in your head can be tough and sometimes even overwhelming.
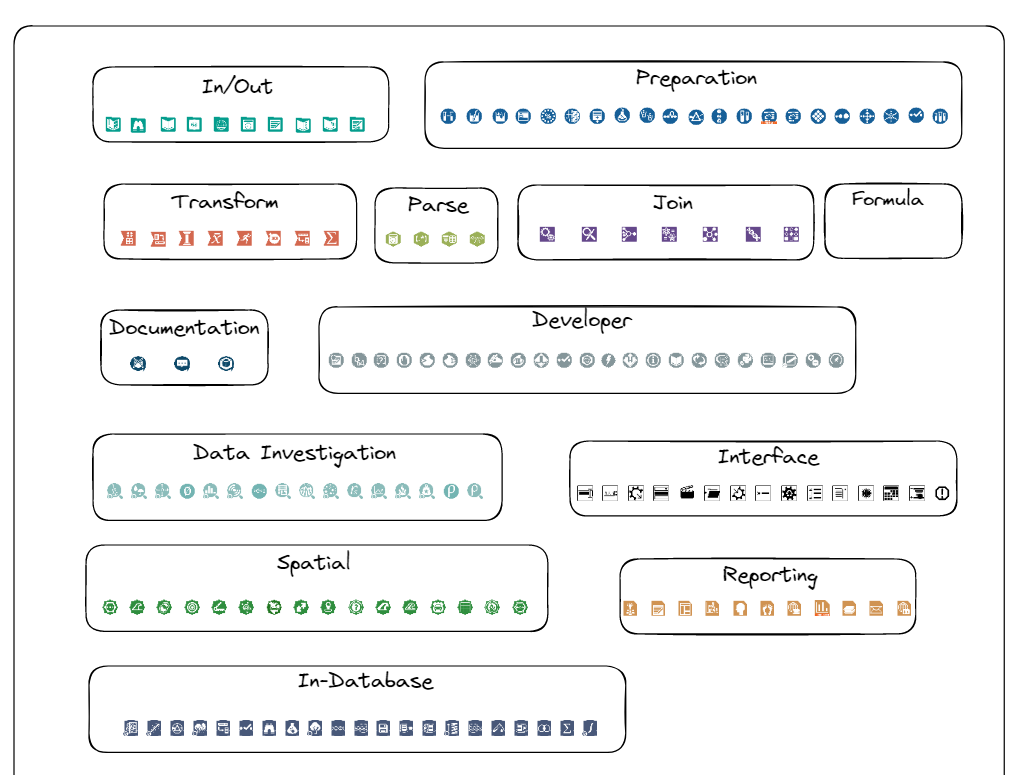
In order to help our consultants at the Data School think through transformations prior to building flows, we've made some data challenges for them in Excalidraw (a brilliant online whiteboard tool for collaboration) using the Alteryx Tools to outline their steps.
Let me showcase an example of a challenge below (feel free to skip to the end if you're after the content itself)
Question 1
Design a workflow using the images of the Alteryx tools and sketch a workflow that reshapes the data below into the desired output using Excalidraw.
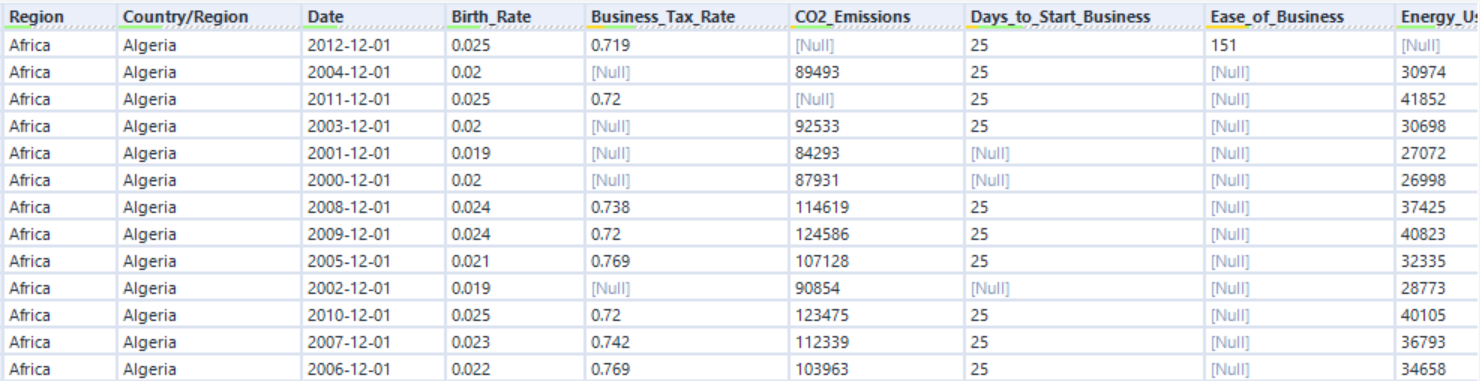
Input Data (only a small sample of the data is depicted)
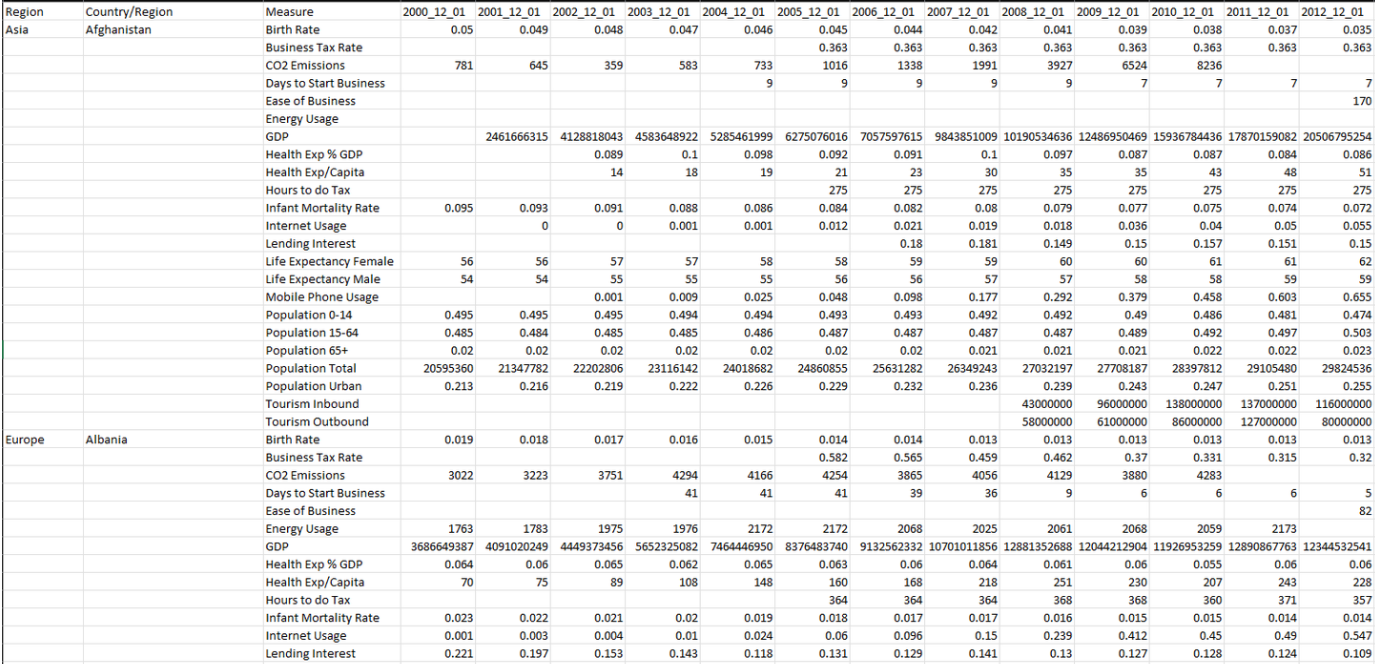
We can see that whilst the input data is relatively easy to navigate by eye, programs and databases prefer a different format to easily breakdown parts of the data as well as append new rows when needed.
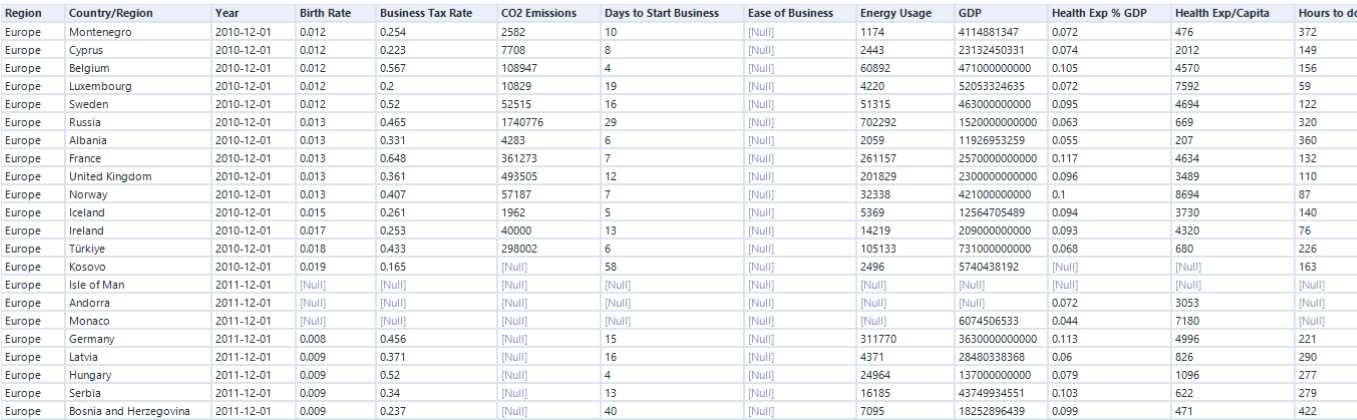
A sample of the desired output is shown below.
We can try to list out the steps to breakdown the work:
- Filling down the Region and Country fields
- Moving the Date columns to rows and Measure column to headers
These two steps might not be the right order in which you can carry out the transformations in Alteryx but it's a start and it's most likely that we need to carry out multiple transformation to carry out each step. Other steps such as updating field types can also be considered.
The filling down of the missing data can be done by Alteryx's Multi-Field Formula tool, so that will be two part transformation, one for each column. Look at a row by row basis, if the field is empty than take it from the row above if it's already populated than keep the value.
Up next we need to think about how we can switch over the Date headers to rows and Measure rows to header names. These are two distinct steps:
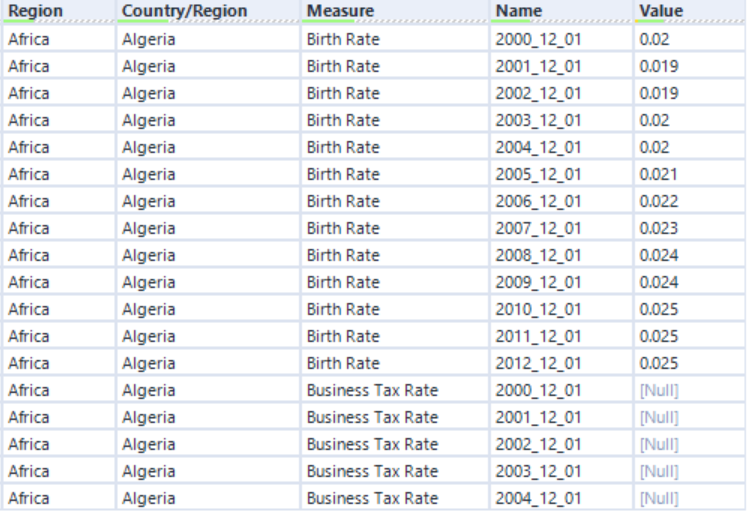
1) Make the data longer and less wide first (transpose or unpivot) by moving the Date columns down into rows.
2) Move the Measure column into separate headers (crosstab or pivot).
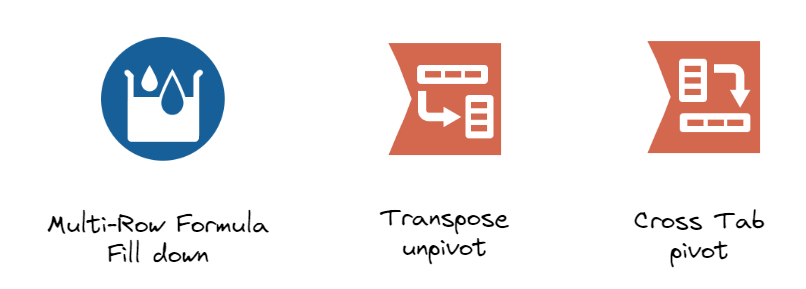
This leaves us with three tools to carry out the main parts of the transformation. Multi-Row Formula, Transpose and Cross Tab Tools.
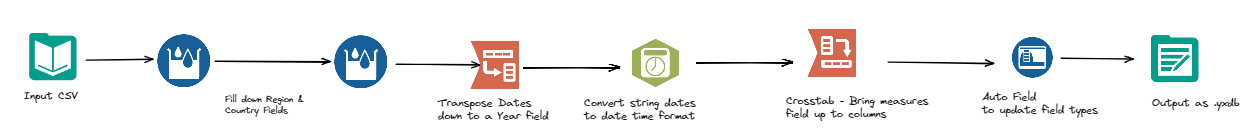
To create a full sketch of the workflow we incorporate tools to bring in the data, write out the output, change the dates to a date format and letting Alteryx update the other field types with an auto field, e viola, a workflow ready to try in Alteryx.
I've made these exercises and workflows available through GitHub if anyone would like to have a go!
 Imba456