



Transpose turns columns into rows. Crosstab turns rows into columns. That's the whole difference, yet when I first started learning Alteryx, I still managed to mix them up every time.
Reshaping matters because the shape your data arrives in is rarely the shape you need. Spreadsheets love wide data, with one column per year or month. Tableau and most analysis work best with long data, with one row per observation. Reports often want it wide again.
In this blog, I’ll explain both tools with simple sketches that show where each part of a table ends up, so you can picture exactly what each one does.
Wide vs Long Datasets
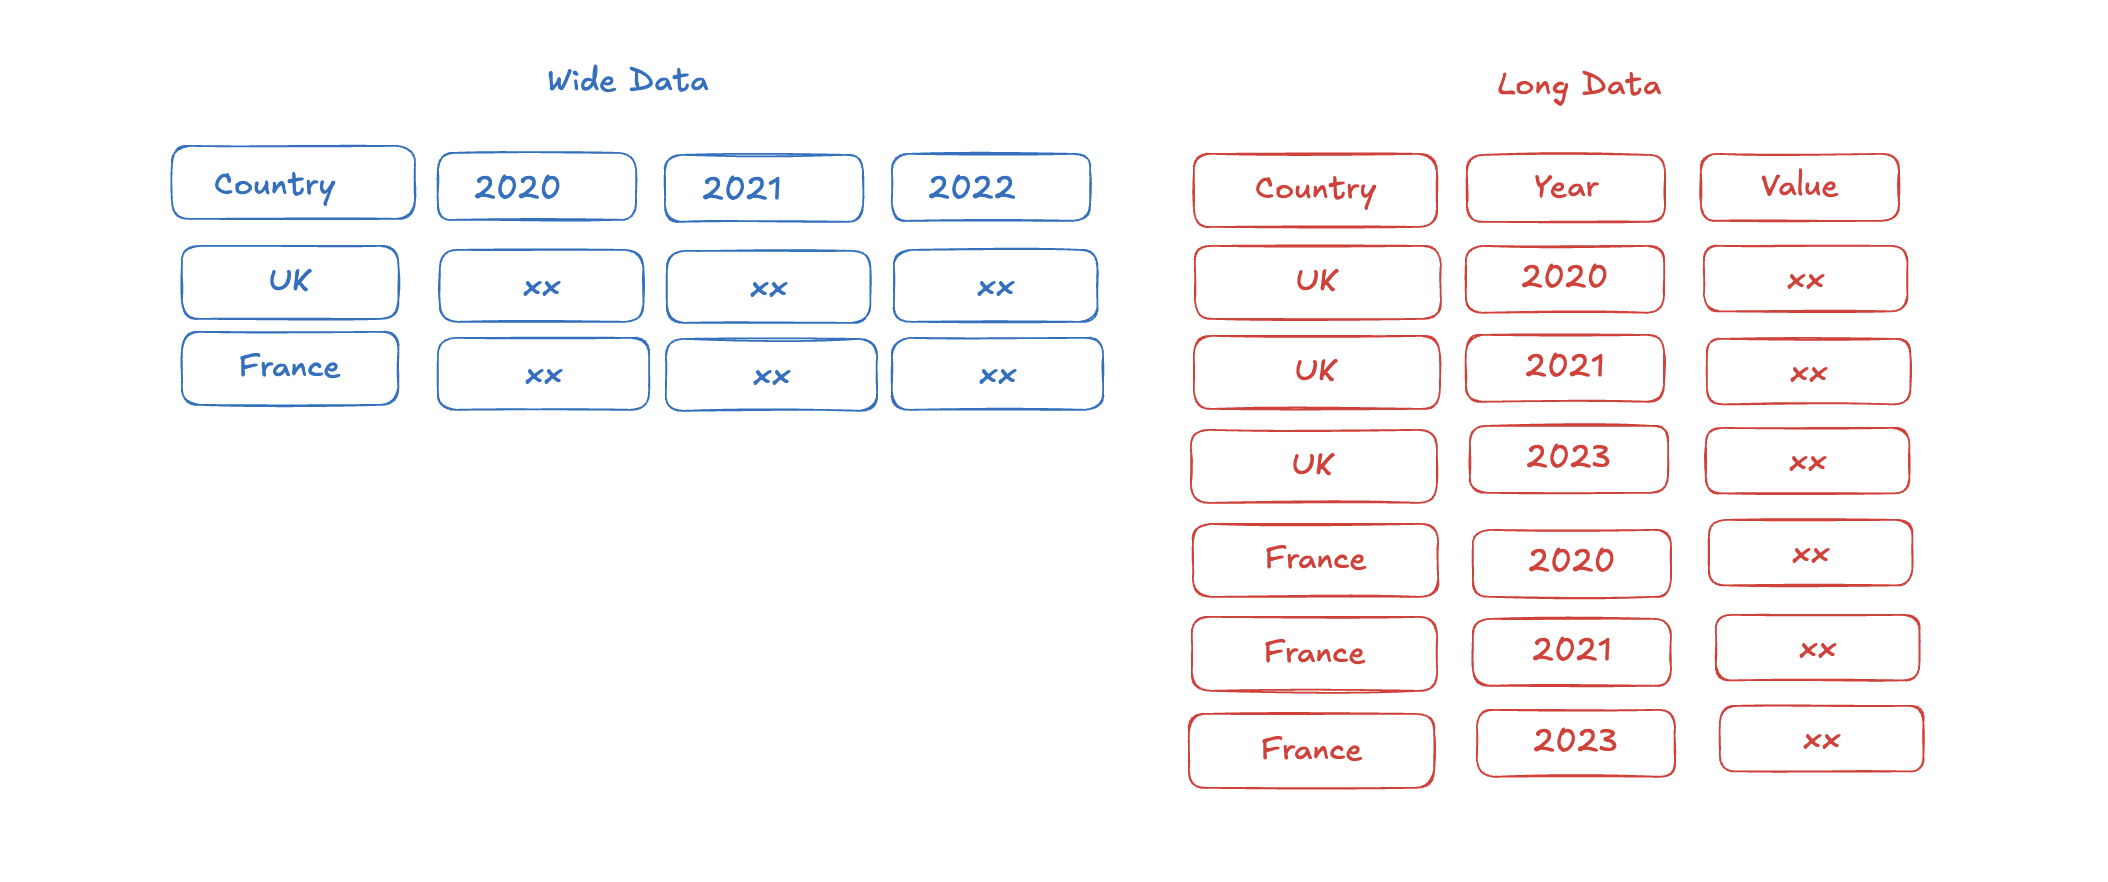
Wide Data: One column per Year
Long Data: One row per Country, per Year
Transpose: wide to long
Transpose is the process of taking the wide to a long format. It takes several columns and stacks them into two: Field Name (the old column header) and Value (what was in the cell).
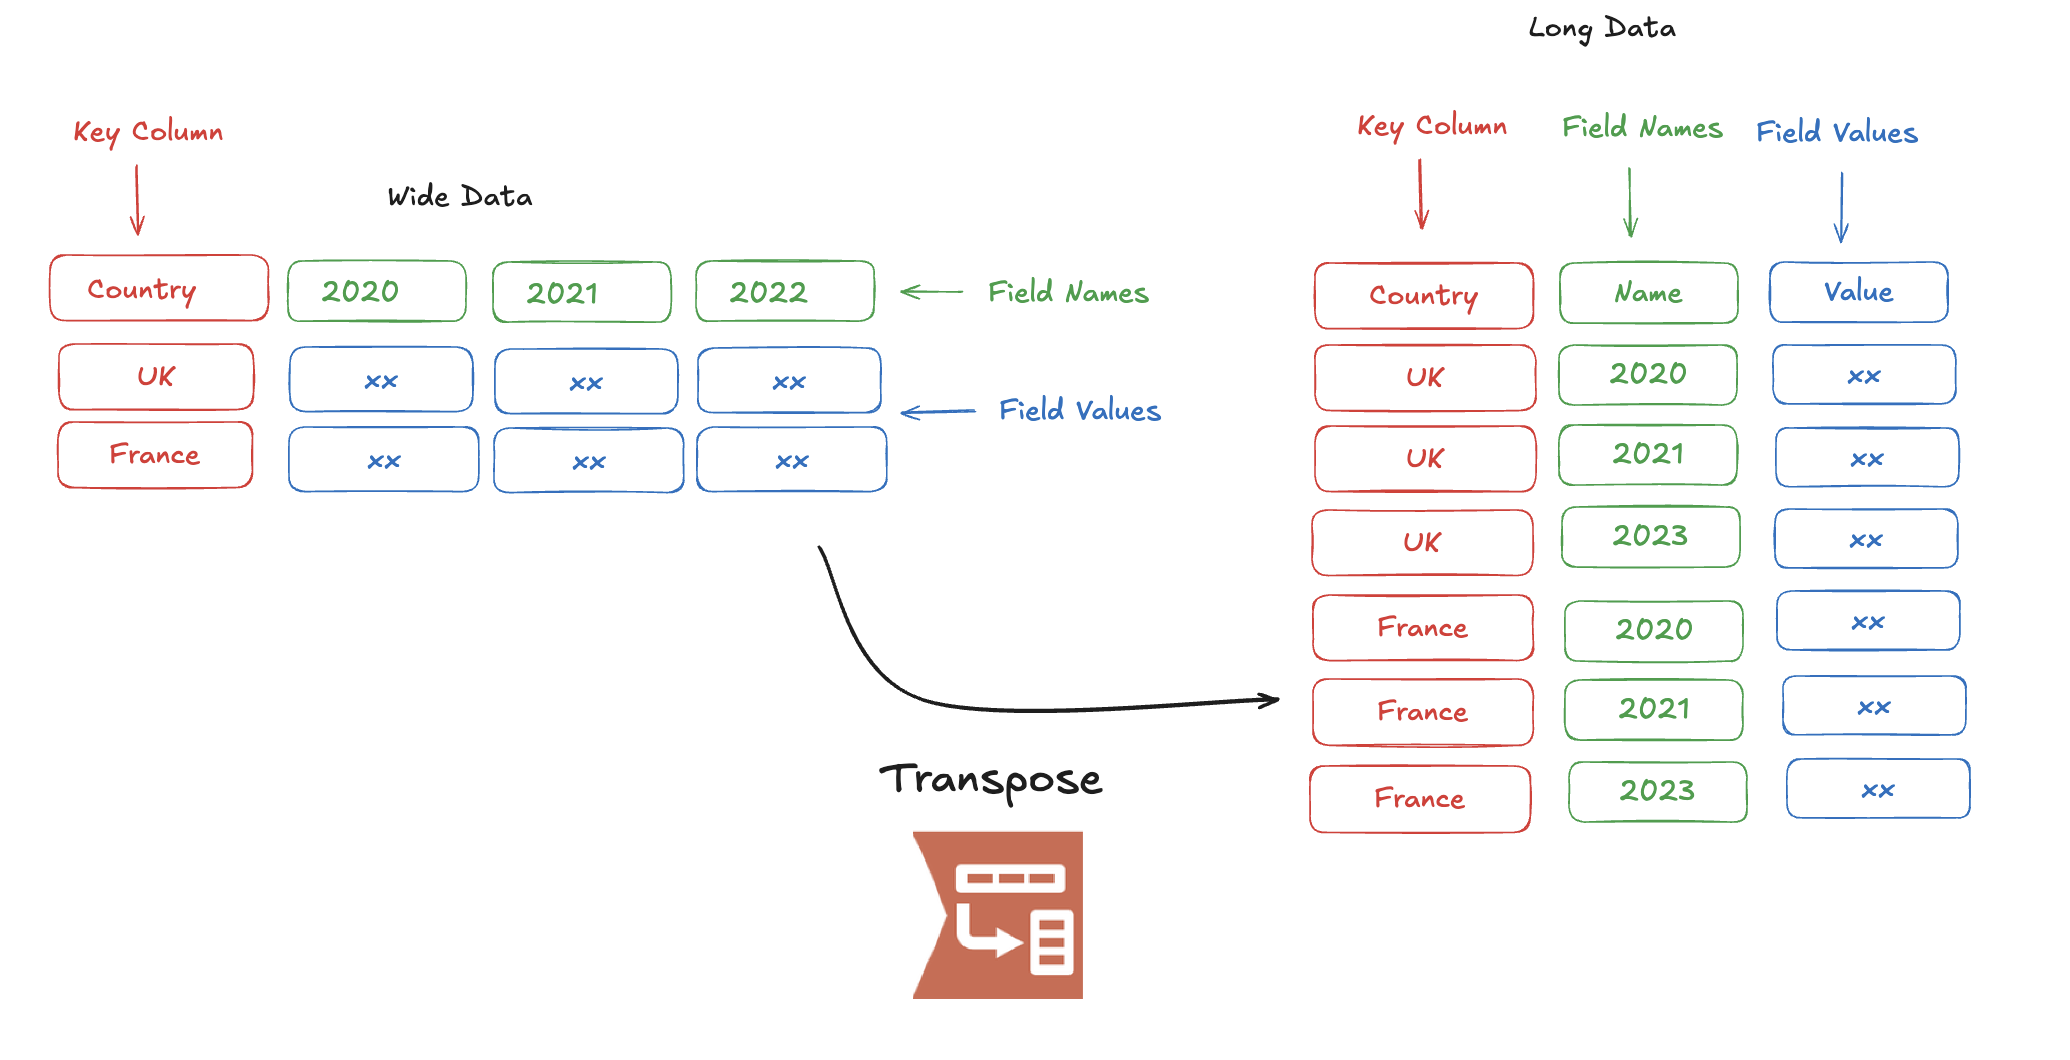
To do this, we have to drag the transpose tool and do the following:
- Under Key Columns, tick the fields that should stay as they are. Here, that's
Country. - Under Data Columns, tick the fields to stack. Here, that's
2021,2022and2023.
The output has three columns: Country, Name and Value. Each country now has one row per year. Add a Select tool afterwards to rename Name to Year
Crosstab: long to wide
Crosstab does the reverse. It takes the values in one field and turns each unique value into its own column.
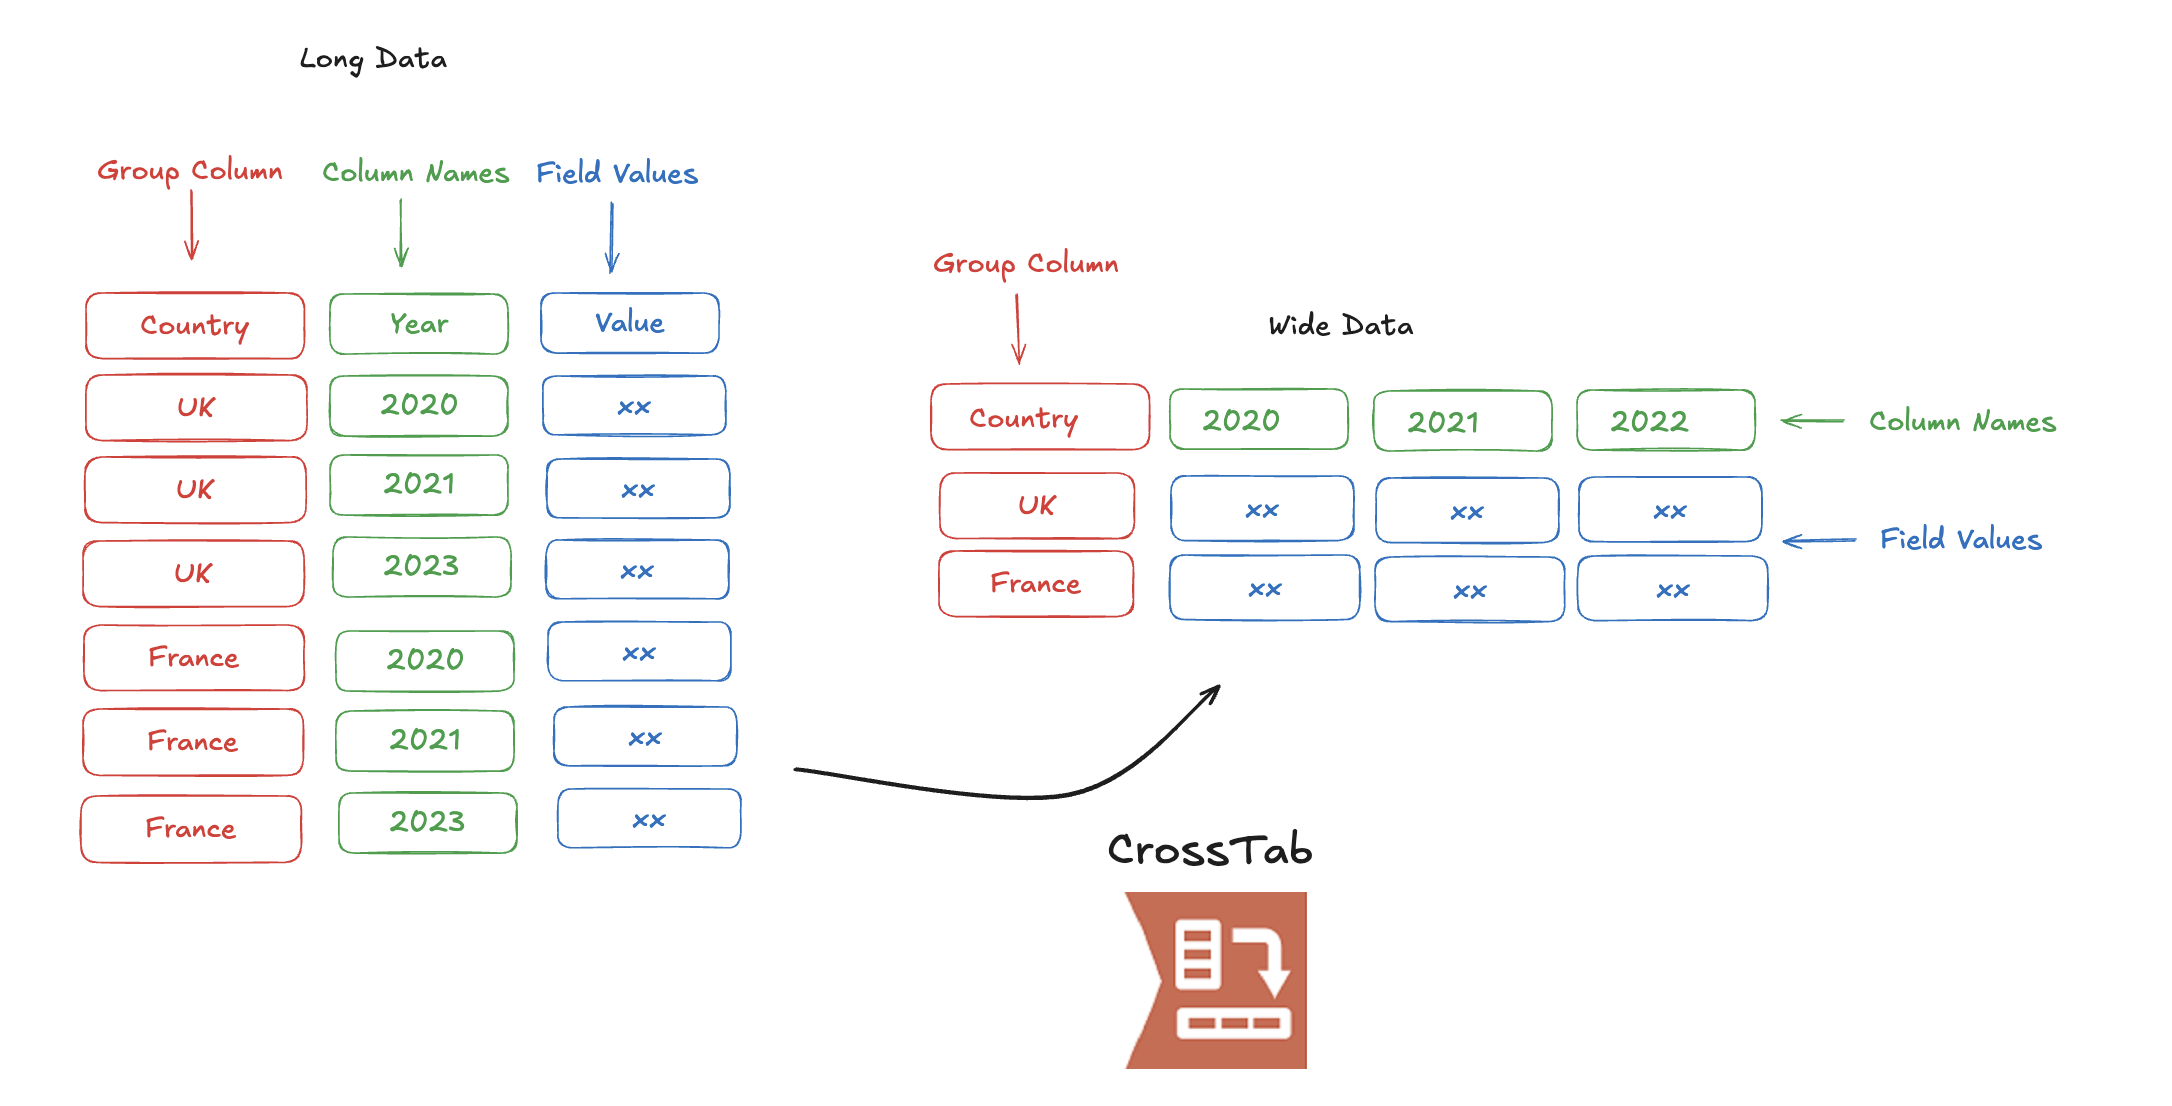
To do this, we drag the Crosstab tool into canvas and do the following:
- Under Group data by these values, tick the fields that define each row. Here, that's
Country. - Change Column Headers: pick the field whose values become the new column names. Here, that's
Year. - Values for New Columns: pick the field that fills the cells. Here, that's
Value. - Method for Aggregating Values: choose what happens if more than one row lands in the same cell. Sum, Average, First and Concatenate are common choices.
Step 4 is the one Transpose doesn't have. If your grouping isn't unique (say you forgot to filter to one metric), Crosstab will quietly sum or average the duplicates. Check your row counts before trusting the output.
Mistakes I made (So you don't have to)
- Forgetting to fix data types after Transpose. If your data columns have mixed types,
Valuecomes out as a string. Add a Select tool to convert it back to a number before doing any maths. - Ticking a key column as a data column. It gets stacked into
Valuewith everything else. If your output looks oddly tall, check the Key Columns list first. - Duplicates in Crosstab. If two rows share the same group and header, Crosstab combines them using your aggregation method, with no warning. Filter or summarise first so each cell has exactly one value.
- Losing fields in Crosstab. Anything not in the group-by, header or value field is dropped. Add it to the group-by list if you need to keep it.
- New columns next month. If your input might gain a new year column, tick Dynamic or Unknown Fields in Transpose so it's picked up automatically.