


Today, the objective was to create an analytical app through Alteryx that was focused on UK Crime Data and then build a dashboard that could be directly loaded after using the app.
There were 4 main components to the analytical app:
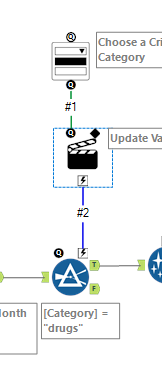
1.) Accessing the KPI: This part may have been the easiest however, I did end up going back to change the thought process later, I'll come back to it.
2.) User Crime Category Selection: The requirements of the day stated that we needed to give the user the option to select the category of crime. This was achieved by using a dropdown action using a summarized list of values for categories in the dataset. The action then updated the filter.
3.) User Postal Code Selection:
A dataset with all of the postal codes in the UK was extracted from Free Map Tools and used to append to the start and end date flow.
4.) Choosing the Start and End Date:
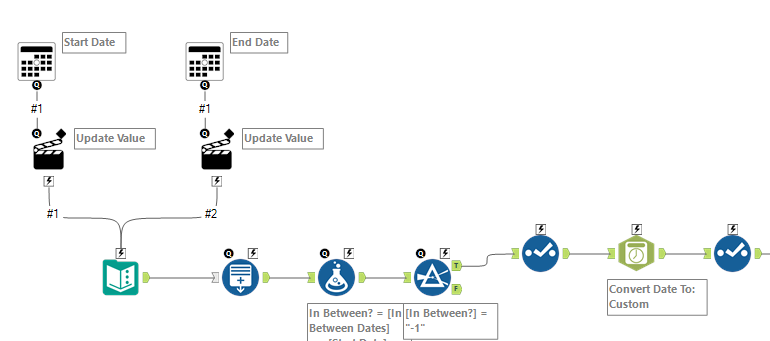
Using two actions to allow the user to select a start and end date - updating the value and creating rows for every month in between those values. This allows us to append that data alongside the selected postal code. For every postal code, there will be (x) amount of rows, depending on how many months are in between the selected months, for that postal code.
Final Workflow:
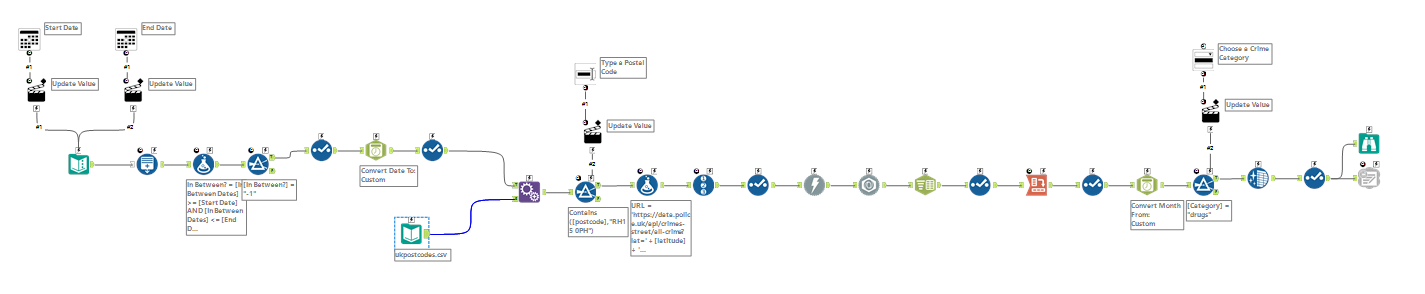
From start to finish, we start with two inputs, a date input and a postal code input - we append them together and add that information to the API. The API is downloaded and parsed through JSON. After some cleaning, a filter is applied at the end to allow the user to choose a category to focus on. The output directly uploads to Google Drive which allows us to connect directly to the data using Tableau. If a user makes changes to the analytical app, the data will automatically change in Tableau allowing for quick, easy, and dynamic visualizations.
Final Product:
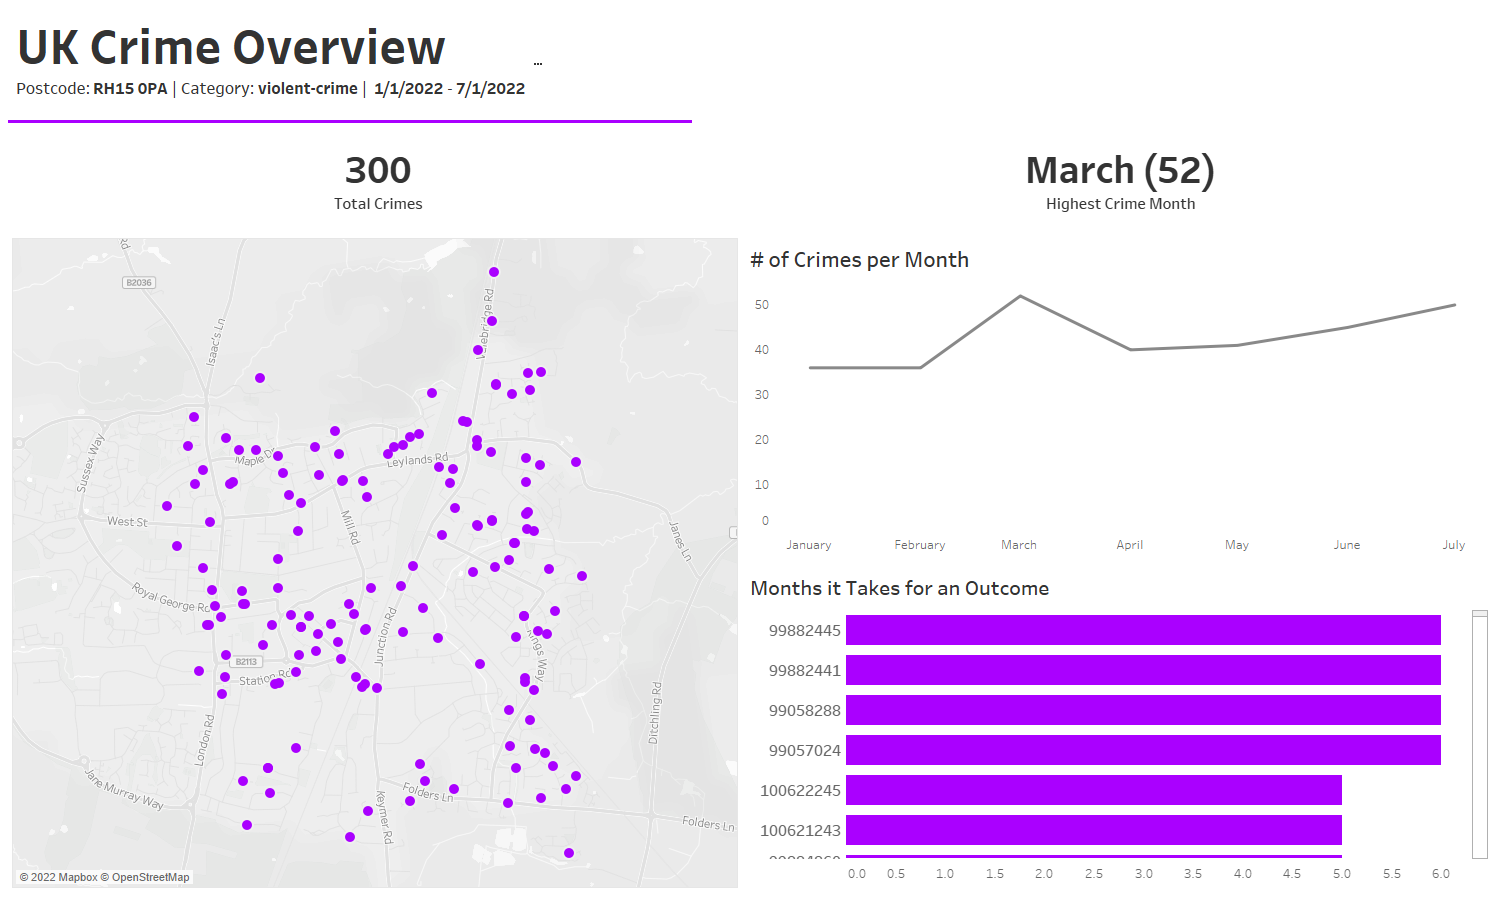
Check it out on Public! https://public.tableau.com/app/profile/quinn.serfass/viz/UKCrimeData_16643994775400/UKCrimeDashboard