


Today is our 4rth day of dashboard week. Andy gave us task to create dashboard on his favorite TV show of all time "Breaking Bad". To get the data we are supposed to use API.
Website of API: https://breakingbadapi.com/
This website has very clear direction to use API and it's free.
As I don't know much about this show so I stick with death tolls and use API to get death count and related information.
API which I have used- https://www.breakingbadapi.com/api/deaths
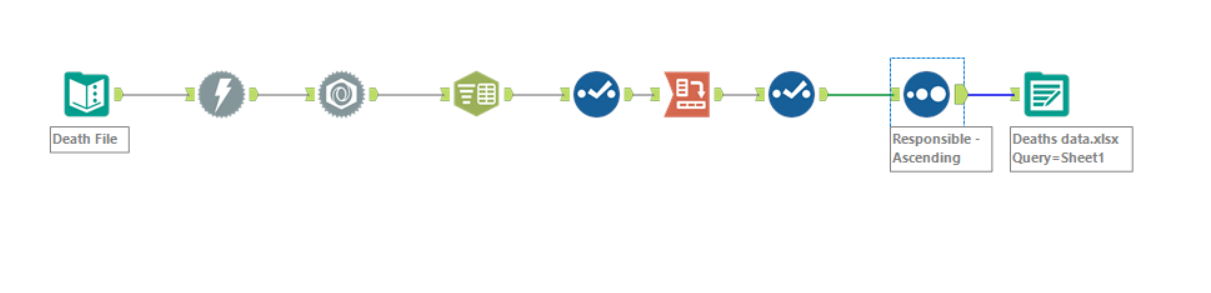
This is my Alteryx workflow-
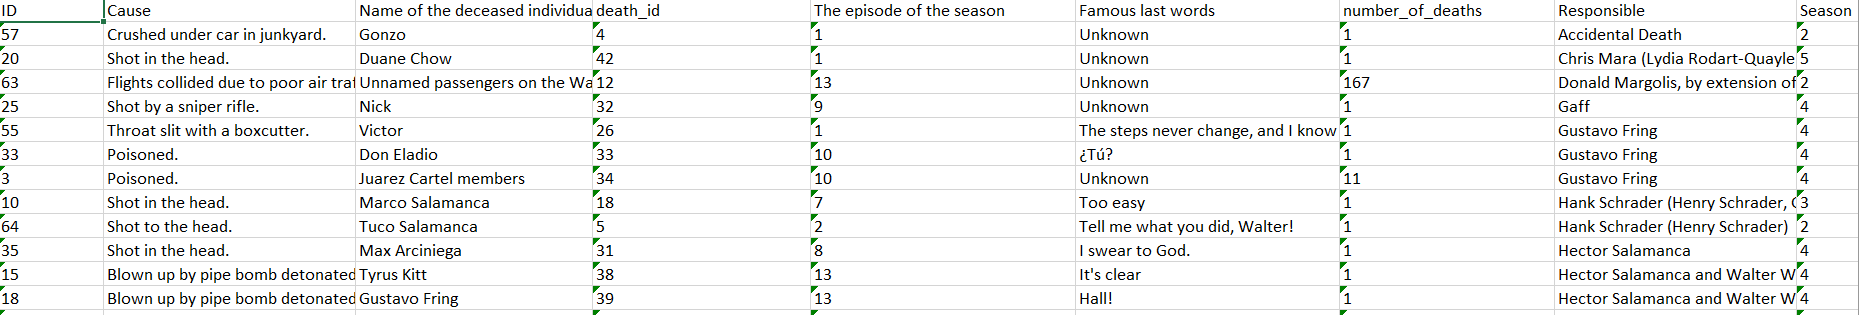
Final data file which I am using for my dashboard-
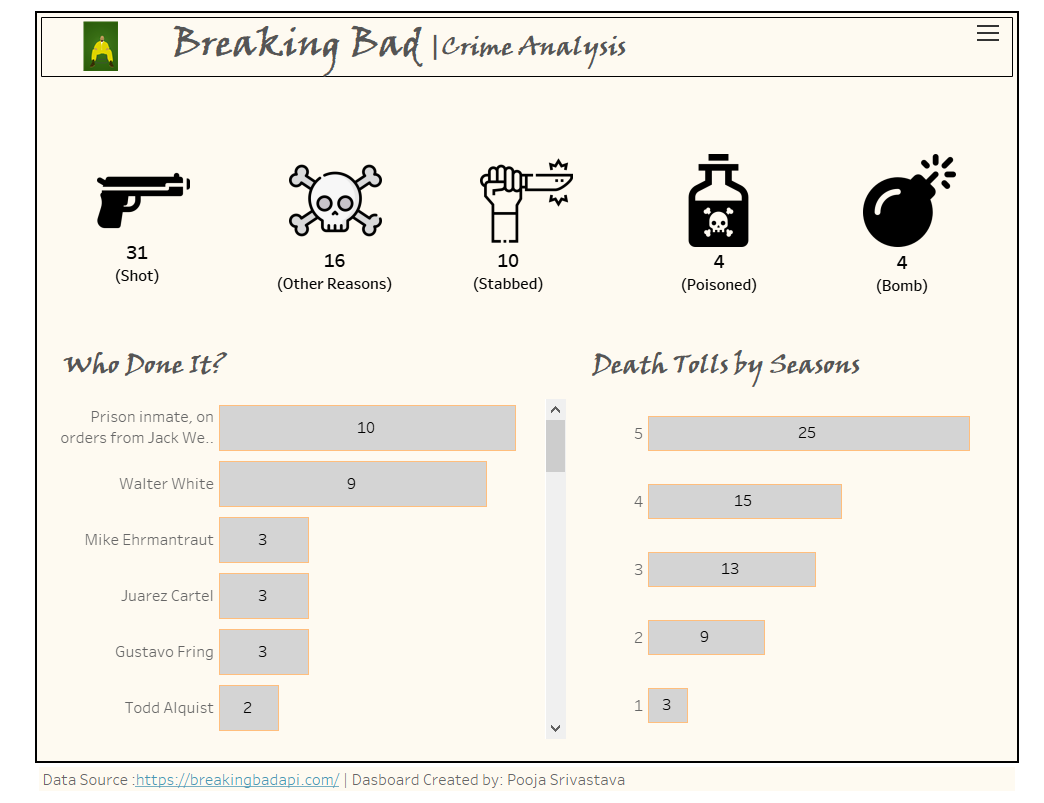
Breaking Bad dashboard- I have KPI's on top which is showing methods of killing and numbers of characters got killed by that. Left bar chart is showing killer name and number of characters they killed. Right bar chart is showing death tolls in each season.
Check out my tableau public profile to check out this dashboard in more interactive way: Breaking Bad | Andy's Favorite Show | Tableau Public