I'm incredibly proud to say my sixth, yes SIXTH, cohort here in Hamburg is well under way with their training. After an impressive start, they are coping well with the new information, new tasks, and new tools being thrown at them every day during this intense and rewarding training period at The Data School.
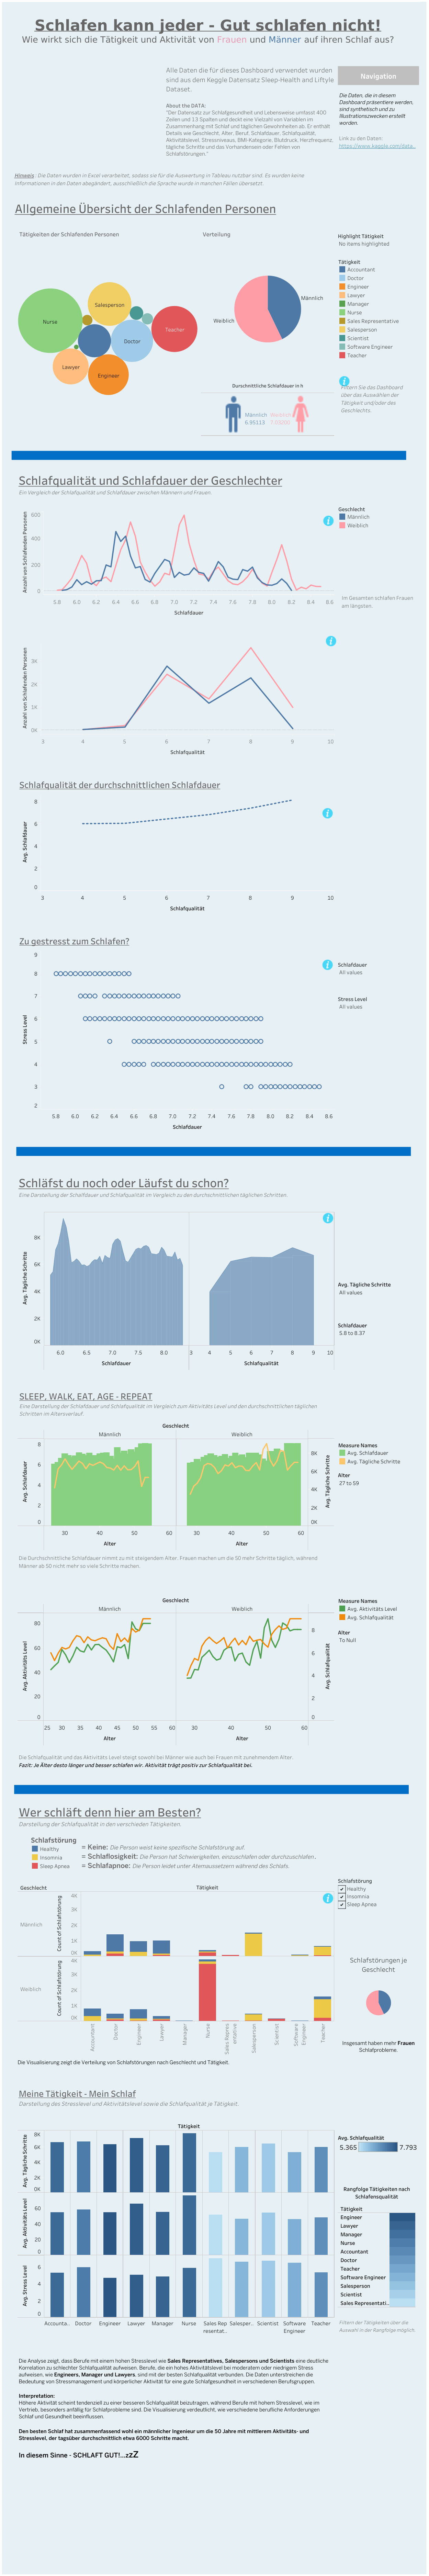
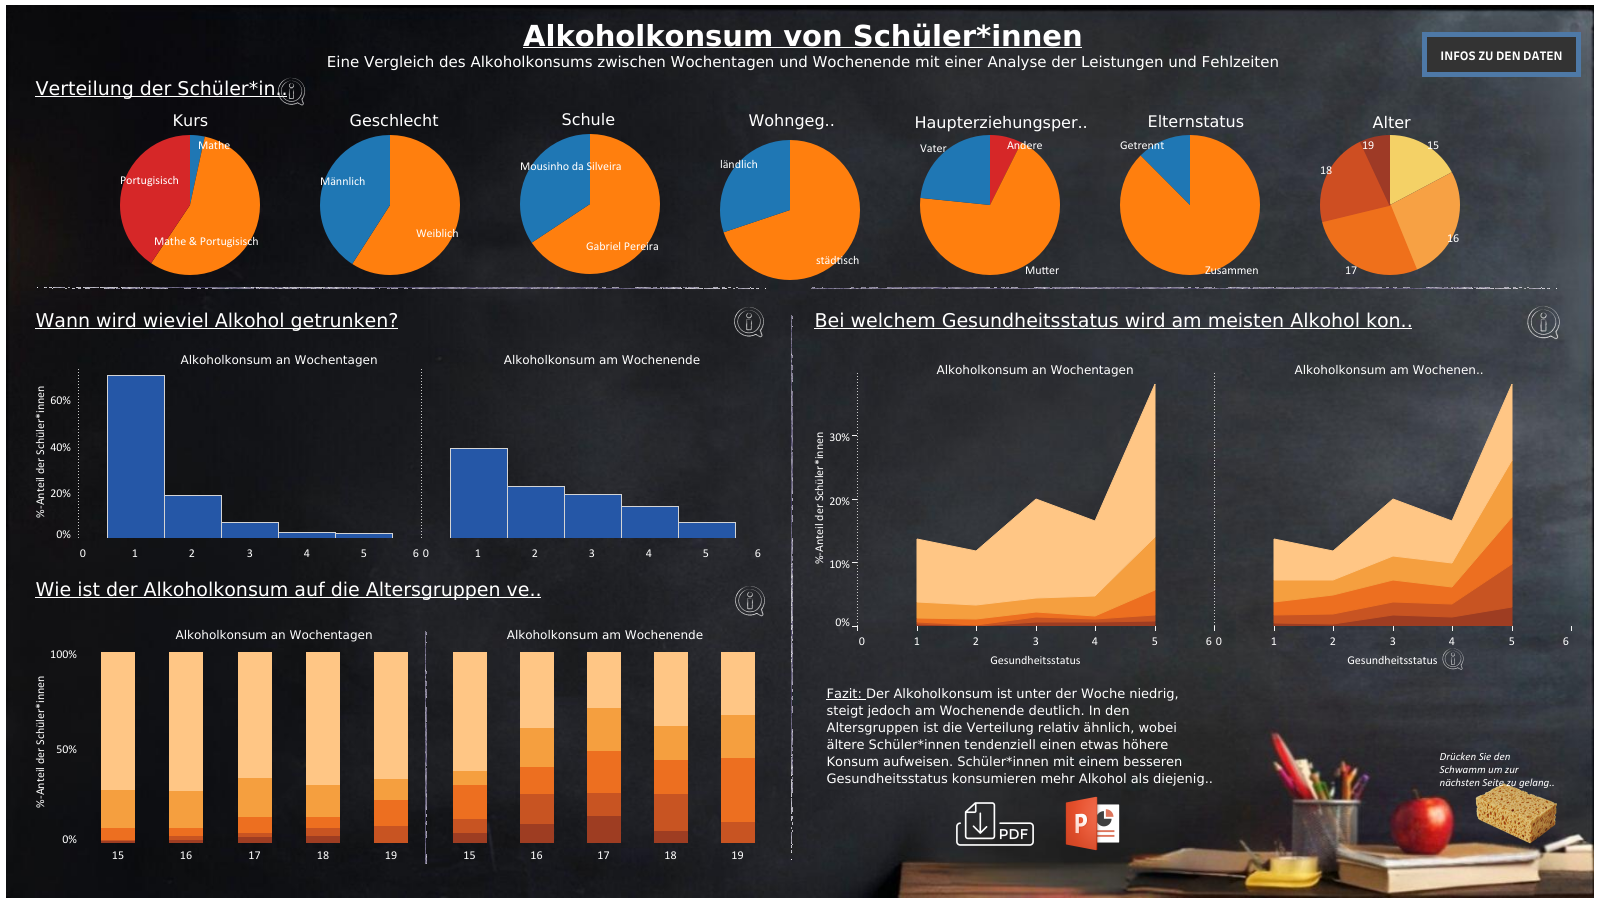
They're busy with Power BI whilst I type, but let's take a look at what they built in Tableau in order to gain an interview, and then in order to secure their spot in this cohort of 7 people. Feel free to click on their name to see their website profile and recent blogs, if you click on each viz image, you will be taken to an interactive version on Tableau Public to explore their work properly!
If you think you've got what it takes to join us, do get in touch! We are happy to help you learn during the process of applying - click here to find out more!
Birthe Claussen
Gabriela Scherbinek
Mariia Sapsai
Stefan Ladwig
Stella-Sophie Bukowski
Stephan Christner
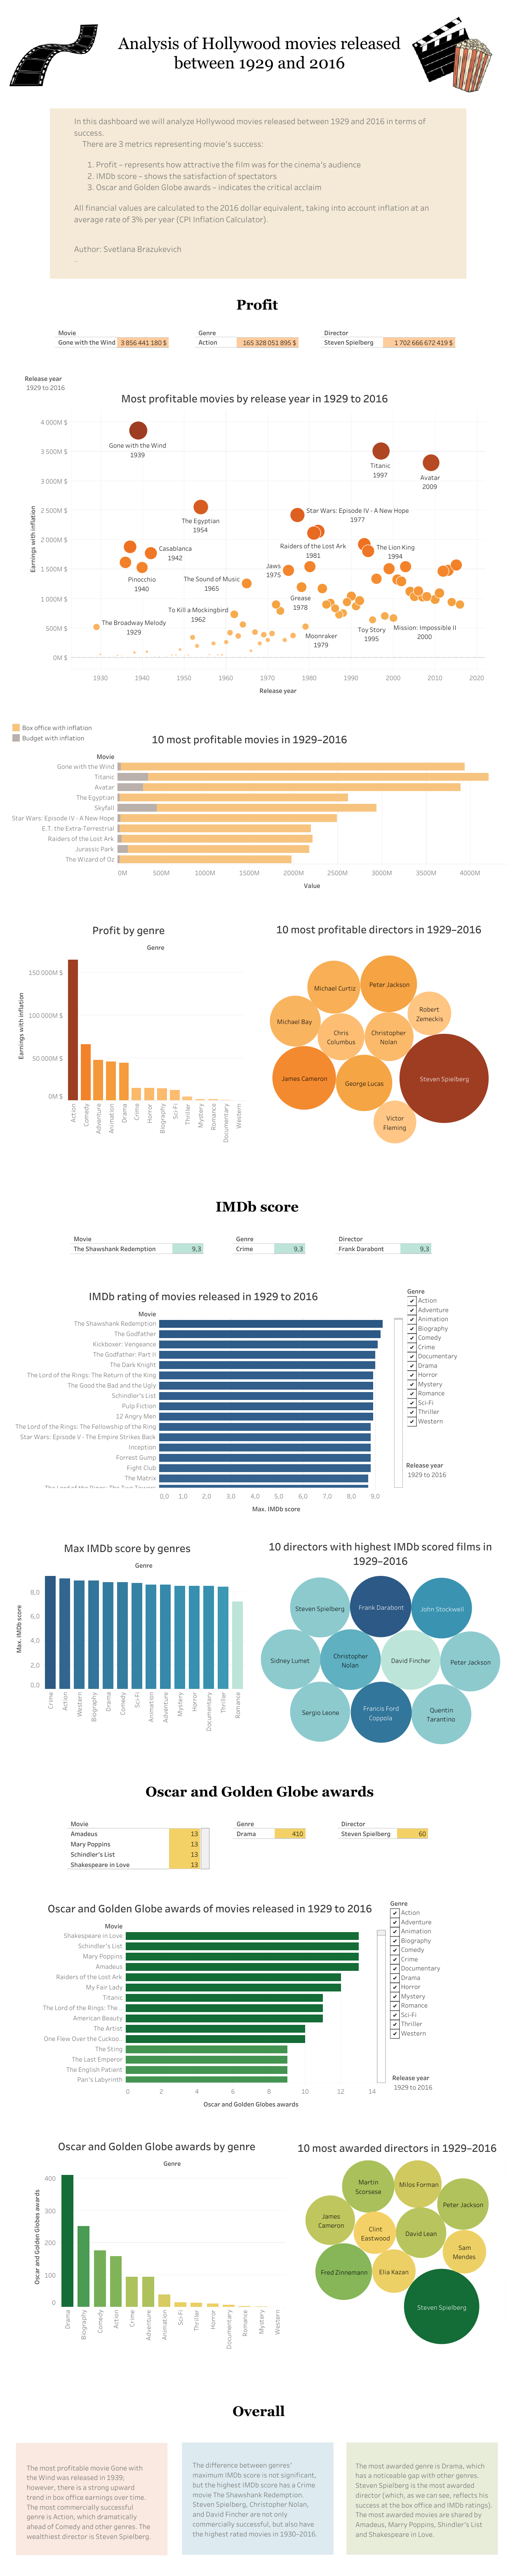
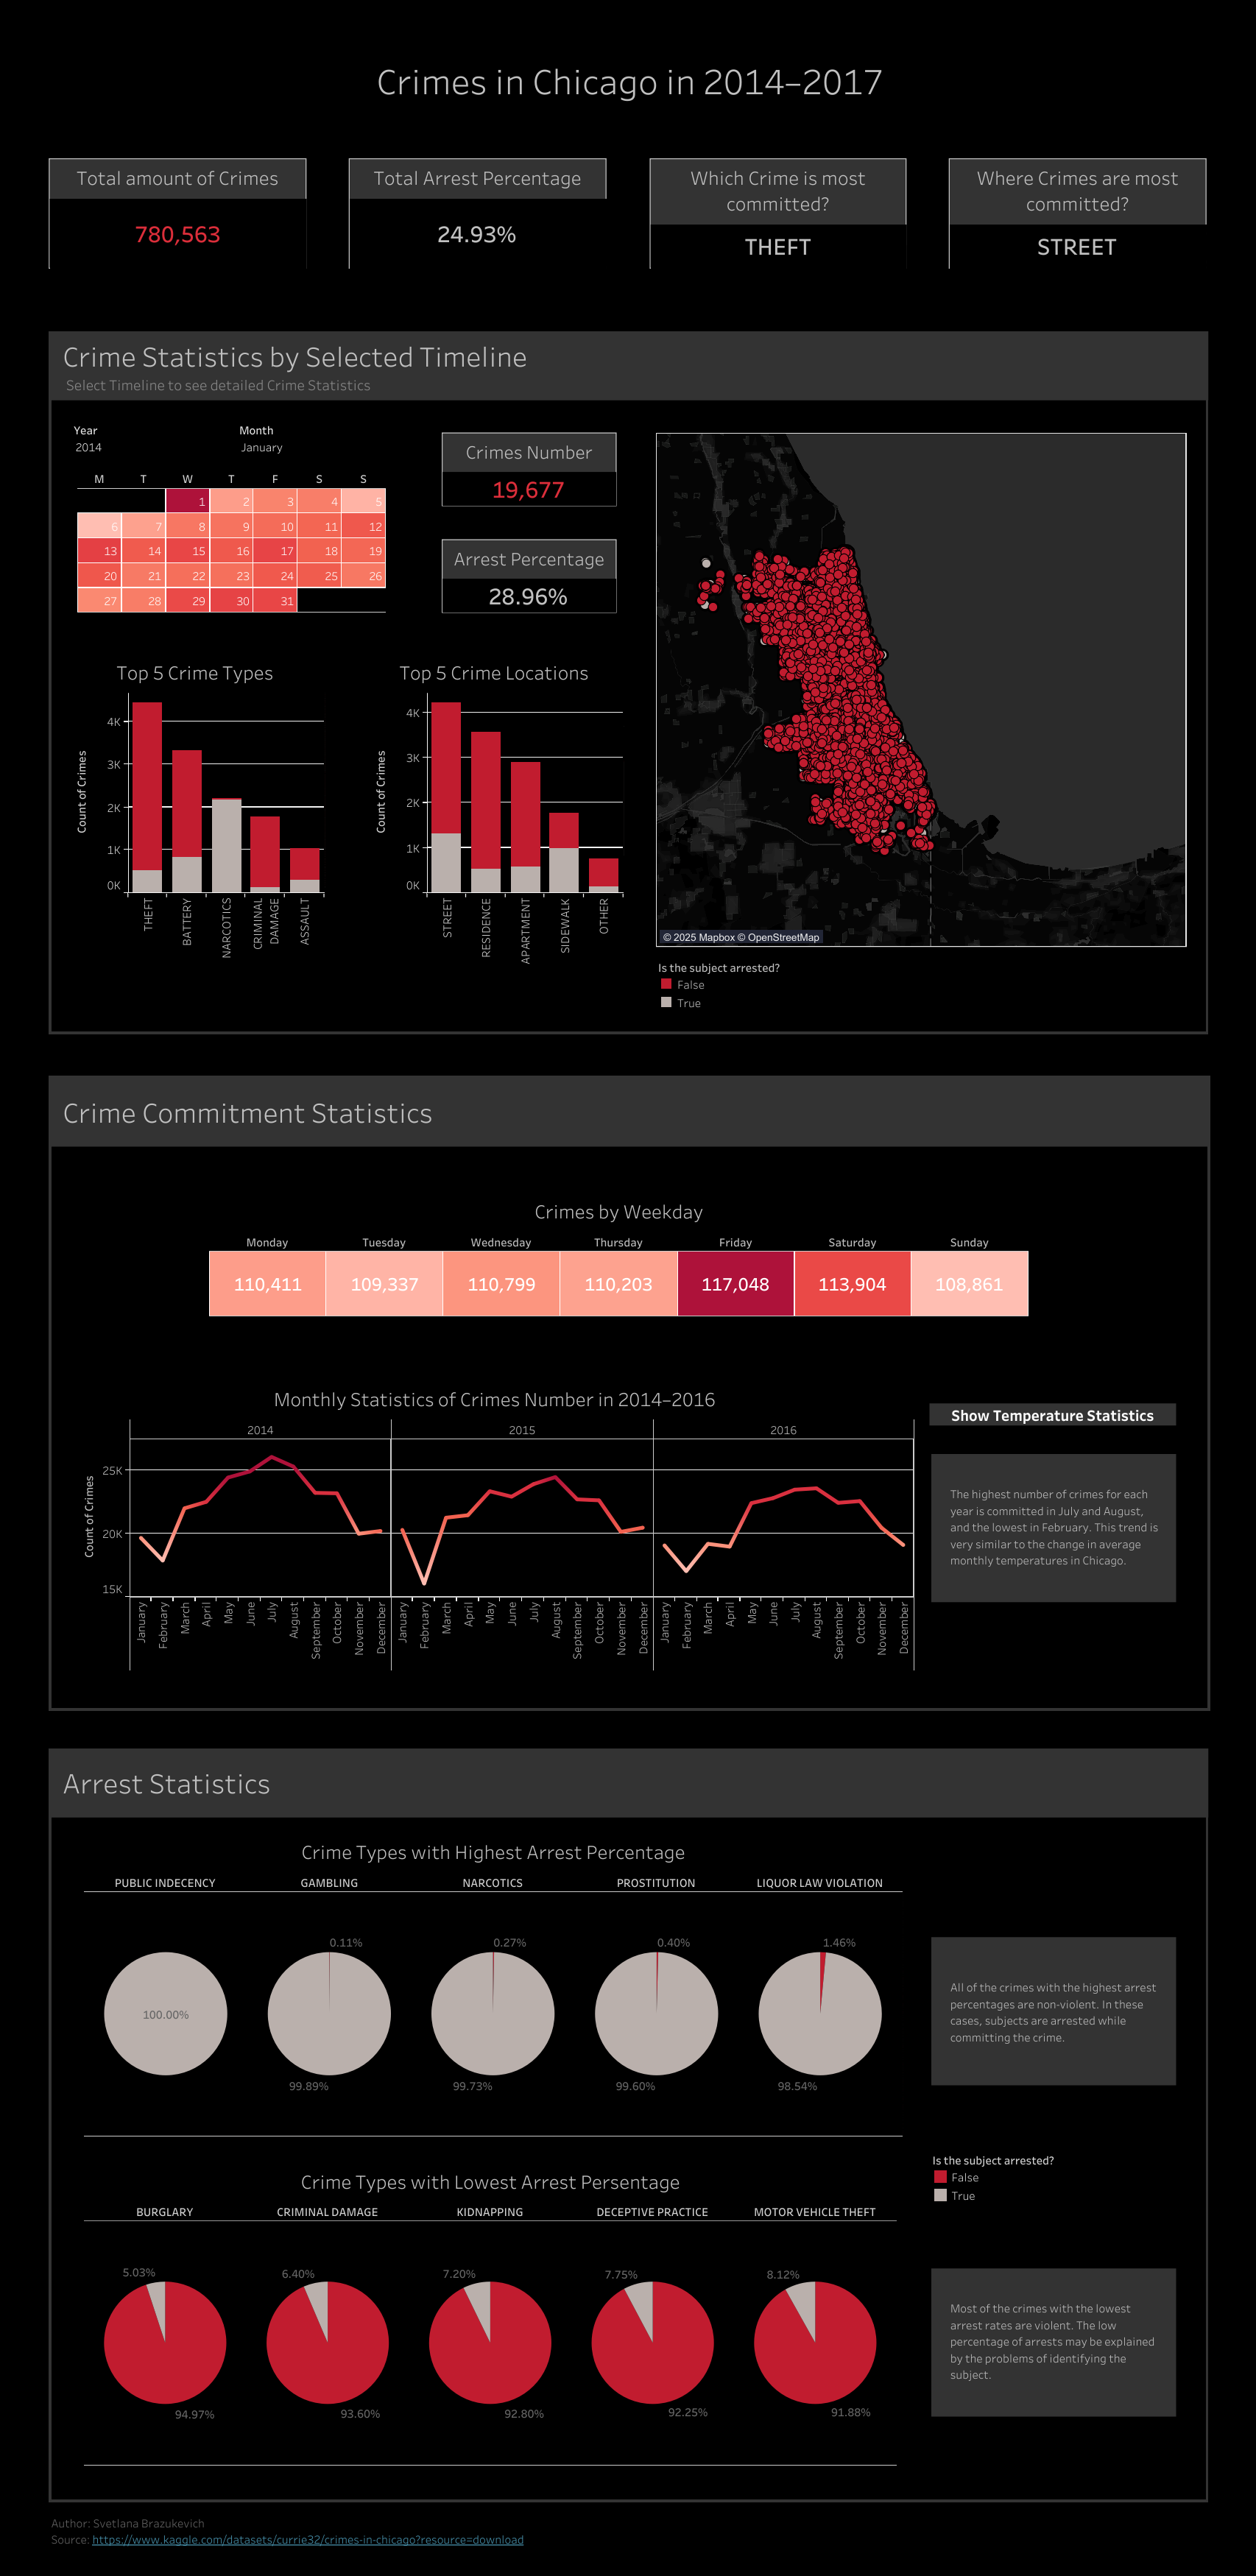
Svetlana Brazukevich