We have just started week 5 at the Data School with another very interesting training session by Alteryx Ace Chris Love, this time focus on Spatial Analytics in Alteryx. If you are interested like me in the posibilities of Spatial Analytics, Alteryx is a great tool to boost Tableau’s capabilities and make everything faster and easier, with tools to create points directly in a map, calculate distances, find nearest points between files, building polygons, splitting them, calculating trading areas, etc.
In this link is a great example from Craig Bloodworth (Tableau Zen Master and Data School Coach) of how easy can be to export the information from a Shapefile to Tableau using Alteryx. But, if you are not an Alteryx user, you can still convert Shapefiles to use them in Tableau but in a more laborious way. In this post from the Tableau Community you have a very good explanation step by step of how to do it. All you need is to download, install and use a free and open source Geographic Information System: QGIS.
You can follow the mentioned blog post to see detailed instructions of how to transform the Shapefile to a CSV that you can use in Tableau, but the main steps are as follow:
- Download and install QGIS.
- Open QGIS Browser, and then open the shapefile (.shp) through the Layer > Add layer > Add vector layer menu.
- Convert the projection to Longitude / Latitude: Go to the layers box in the main screen, and right click on layer just opened > Save As > and in CRS choose Selected CRS (EPSG:4326, WGS 84).
- Extract the nodes from the shapefile through the menu Vector > Geometry Tools > Extract nodes.
- Add geometry columns. To do so, click on Vector > Geometry Tools > Export/Add geometry columns and save it to a new shapefile.
- Create a CSV file of nodes by right clicking in the new layer > Save As and make sure to choose Comma Separated Value (CSV) in format and again in CRS Selected CRS (EPSG:4326, WGS 84).
- Finally, you will need some extra information in the file to be able to create and use the polygons on Tableau. You will have to create a column that identifies each different polygon (and sub polygon if there are any) and a column that identifies the order of the points of each polygon (you can use a formula in Excel to do it).
- After that, you can open the CSV file in Tableau, add Longitude and Latitude to Columns and Rows, the polygon (and sub-polygon if any) to the Detail Shelf and the the Order dimension to Path.
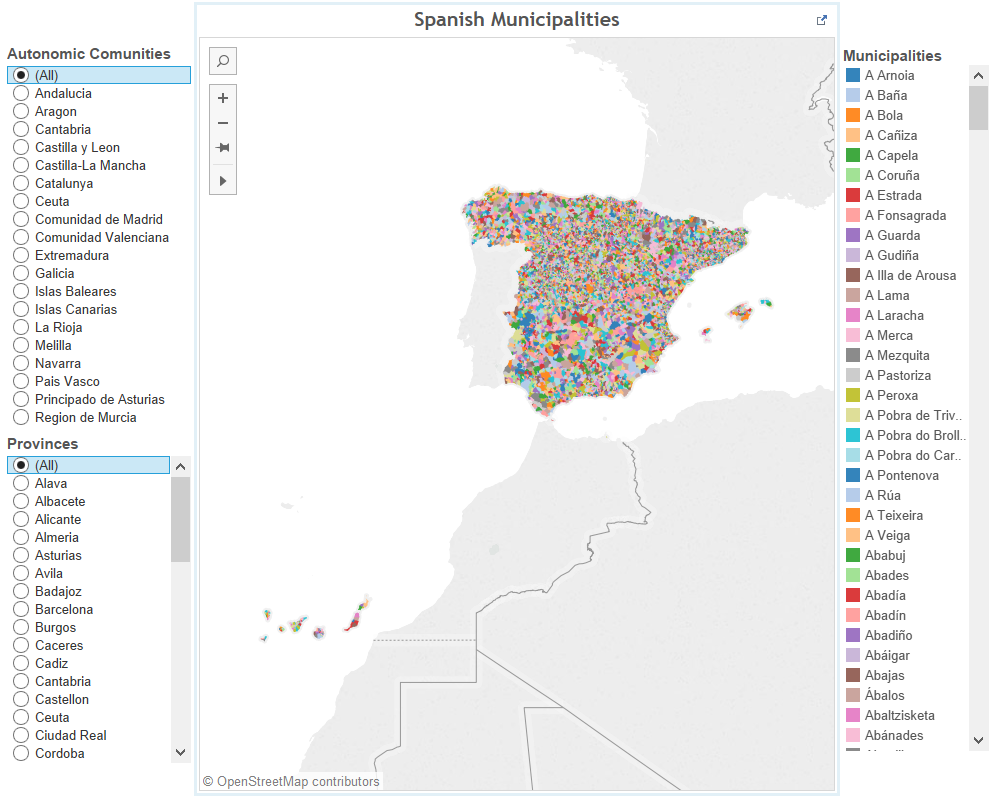
In the post of the Tableau Community I mentioned before you have all the steps explained in more detail, but finally you will have a polygon for each area define in the shapefile, as you can see in this example, where I create a custom map for all the Spanish municipalities (+3 million points):
For this Viz, I used the shapefiles available in the ©Instituto Geográfico Nacional de España website, owner of the data, that provides free and non-license access to the shapefiles that include the geographical metadata of spanish municipalities, you can see the viz also in my Tableau Public Profile. And imagine all the possibilities of spatial analytics adding to this level of detail demographic, economic, cultural or shopping habits data!

