Our coach Andy Kriebel shared with all the Data Schoolers 10 days ago this Jewel Loree’s blog post about Tableau’s Music Viz Contest. The main objective? Create a music related visualization using Tableau, and the possibility to win one of these two prizes:
- The Crowd Favorite: All the submitted vizzes will be given a unique hashtag to use for a popular vote. The most tweets gets a $500 gift card.
- And the Big Prize: Win a trip to Las Vegas to compete in the Iron Viz competition at Tableau Conference.
The basic rules are, first of all, to create a viz related to music (obvious) before the 12th of August, when the submission period ends, and then a panel of judges comprised of Tableau employees will evaluate all submissions based on the following criteria:
- 25 points: Overall Appeal
- 25 points: Design Elements
- 50 points: Storytelling/Data Analysis/Findings
The idea to have the possibility to go to the Tableau Conference in Las Vegas and compete in the Iron Viz, and in addition with a topic that I love so much left no room for doubt: I should try it and make a viz to participate in the contest. After reading some of the ideas and datasets suggested by Jewel I start thinking of a good topic and viable in the few time I have to make it, and after some Google searching I found this interesting page with a list of Music APIs that help me to think of all the possibilities available for a viz like this.
Live music is one of my biggest hobbies, so I decide to focus on this specific area and try to combine it with some additional information. After a long time thinking about it, I decided the topic of my visualization, analyze Bruce Springsteen shows during is long musical career and the moods of his songs. For this purpose I visit two main webpages:
- AllMusic.com: which has a huge amount of information about albums, reviews, ratings, song moods and song themes.
- Setlist.fm: which allows music fans to upload all the information about concerts, including setlists, localizations, etc.
To get the data available for analysis as fast as possible I used import.io, to be able to create a bulk extract and download all Bruce Springsteen’s album data from AllMusic.com (album name, release date, songs, duration, song moods and song themes), and all Bruce Springsteen’s shows data from Setlist.fm (date, city, country, venue and setlist) for more than 2,000 live shows.
After this, I start with the data preparation process, and for there’s anything better than Alteryx to create this workflow:

The main objectives or the workflow were:
- Clean all the datasets, organize them, create additional fields (ID, date formats, etc.) and discard any unnecessary fields include by Import.io.
- Join the general album information with each album’s tracklist and have all the album data available for each song.
- Join the list of Bruce Springsteen shows with the songs in each show, so as in the previous objective, I had all the information available in the same data set (this will imply the use in the viz of LOD calculations).
- Join both processes, so I had album, song, moods and shows data combined.
- And finally, make some additional extracts in the middle of those processes to have also some easy to use datasets.
During all the data preparation and analysis process I also discard some additional ideas that I had but that were not viable with the time available: like adding biographical information that could explain potential changes in the live shows song played (normally a songwriter is influenced by his/her life experience and important events of his/her life) or in the number of shows realized, or even if there’s also influence in the songs themes of important political facts, economic situation in the USA or any other facts that may influence in a musician and his work.
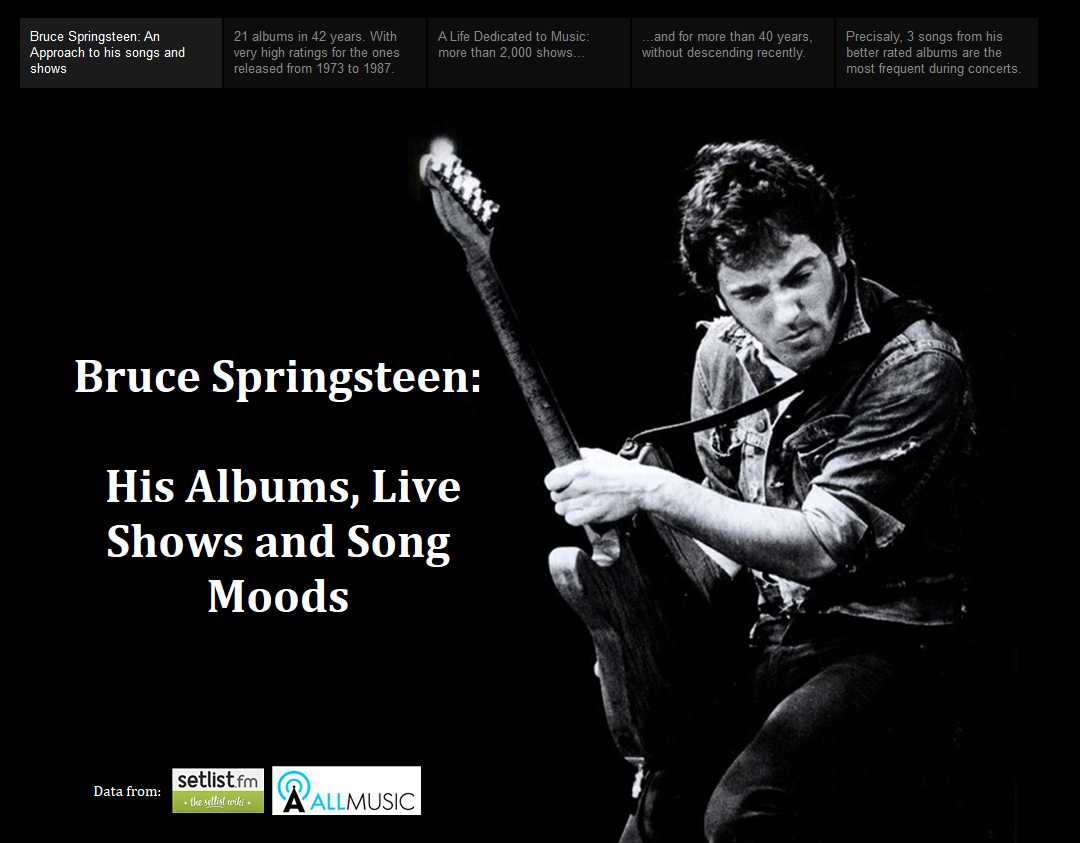
Finally, it was time to prepare the viz taht you can see in my Tableau Public Profile. The viz include a first approach at Bruce Springsteen’s albums ordered by date of release and viewing both ratings, the one from the fans and the one from the Allmusic.com reviews. Specially interesting is the descent in both ratings in 1992 with the release of Human Touch, followed by other lower rating albums until 1992, with the release of the Rising. Precisaly, this period is also a period with less concerts, specially compared to the mid 70s and first 80s and followed by a little increase in the 90s, as you can see in the trend line in the fourth story point (click on the image to access directly to the viz in a new window).
It’s also noteworthy the number of concerts realized in Latin America, Africa and one concert realized in India. In addition, to analyze some possible seasonality in the live concerts I add a heat map where you can see the months of the year and days of the week more common and more uncommon.
And last but not least, the top 100 songs played by Springsteen during his concert based on the information available in Setlist.fm including additionally a tag cloud of the moods based on the tags from Allmusic.com, with the possibility of changing the top number of songs show in the screen and to click each of them to see the specific moods for that song.
I hope you like it!

