I just got flogged by a Tableau quiz we were tasked with today (the second of two Tableau Data School quizzes). The only reason I am here to tell the tale is because of almost prophetic desire to write a blog on LODs reimagined as table calculations. In celebration of that, and because it was my plan to write a second blog to walkthrough another example, once again I am writing to you dear reader.
Example - Dynamic difference-from bar chart
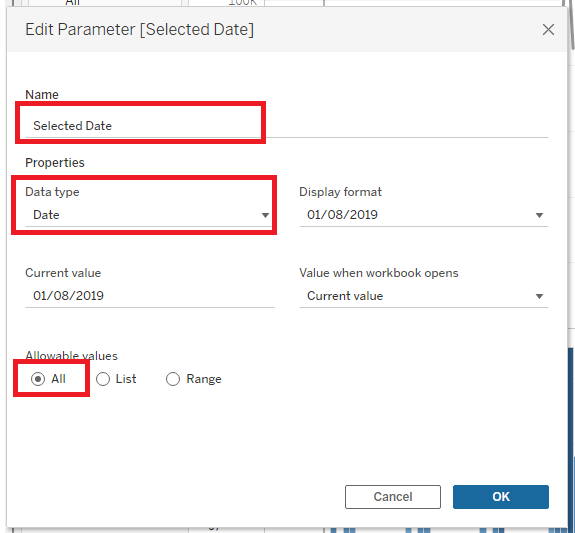
Dragging the continuous month of the order date to columns and sum of sales to rows, the base line chart is made. Both chart utilize a date parameter; it is vastly the same as any parameter. The configuration is as below. The name should be something rational, and data type a date, and allowable values all.
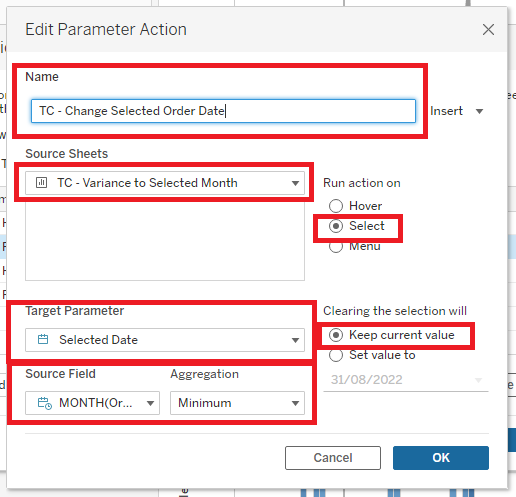
As with all parameters, it needs to be linked to a field to bring the dynamism into the view. This is done slightly differently than I am used to. Instead of creating a new calculated field, the parameter is linked to a parameter action directly - configuration below.
And now we are ready to diverge between the table calculation method and the fixed LOD method.
LOD Method
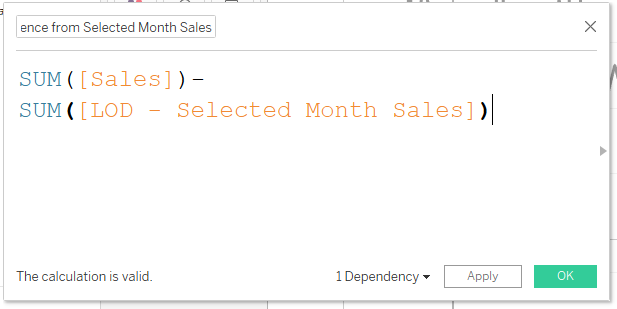
Two calculation will be needed. The first will calculate the sales of the selected order date and append it to all order dates.

Once that calculation is made, it will be taken away from the real sum sales of all dates, resulting in a 'difference from' calculation.
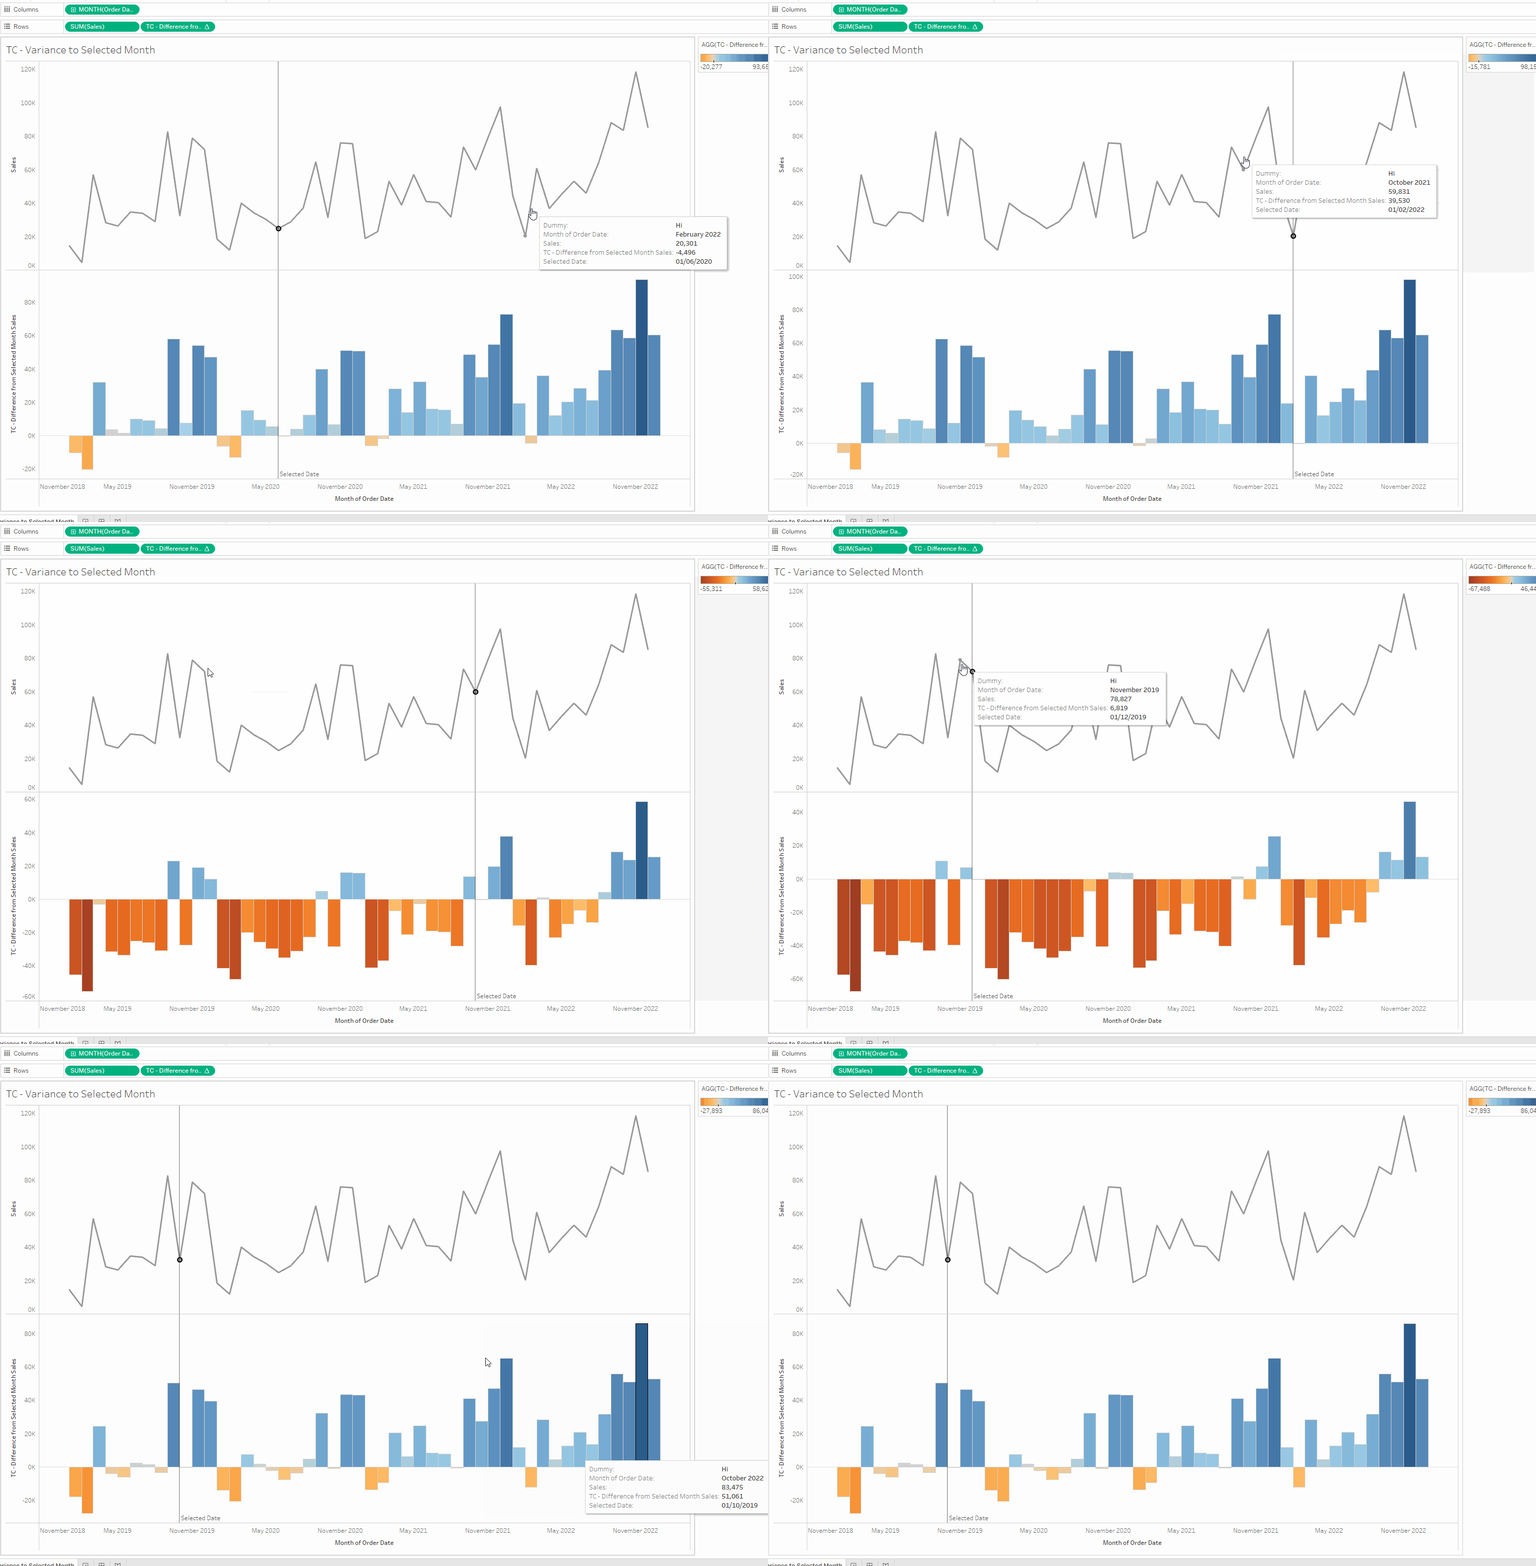
Now dragging that final calculation into the row next to the sum sales, a variance chart is created under the traditional line chart.
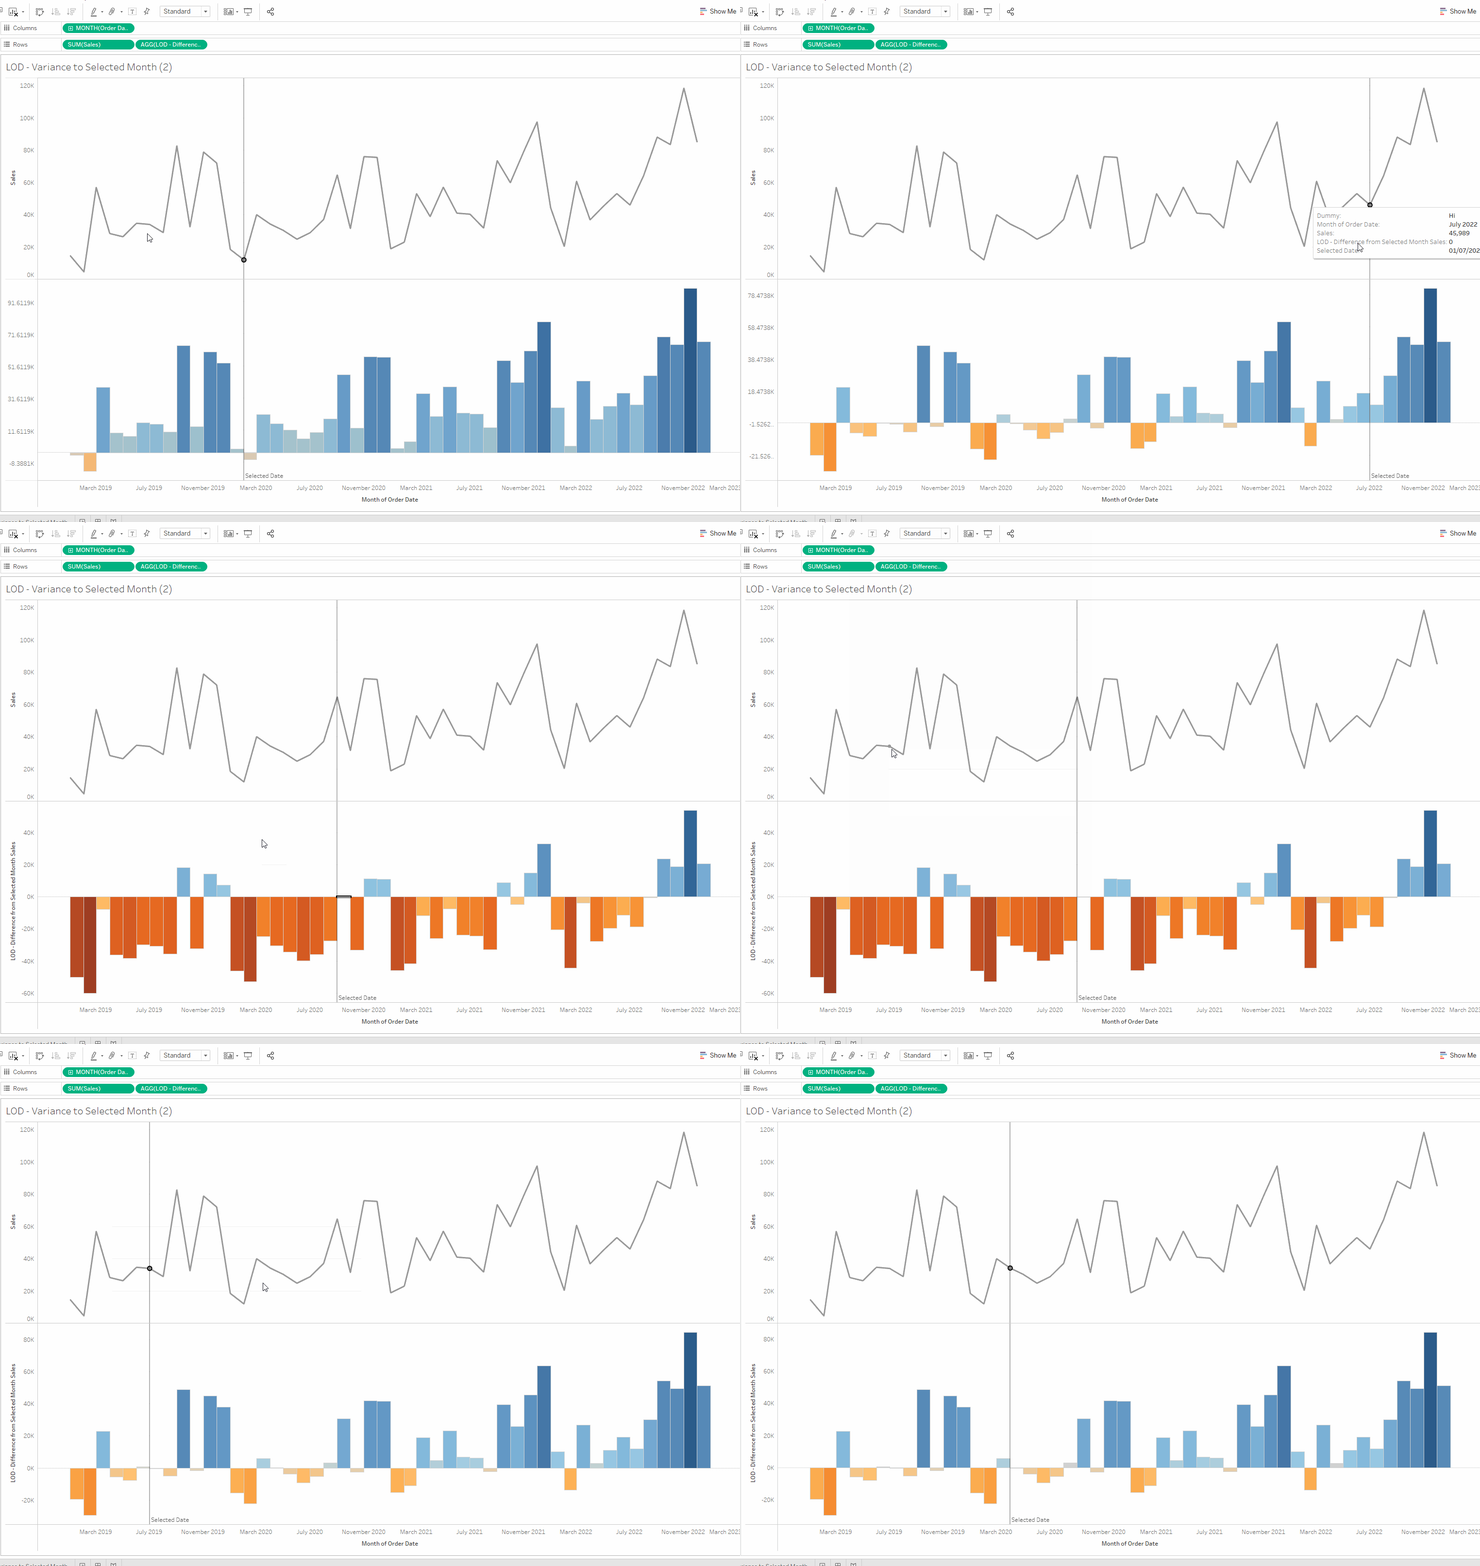
Table Calculation Method
To append the sum sales of the selected date to do further calculations as a table calculation, 'TOTAL' is used with the same 'SUM(IF...' as the LOD method.
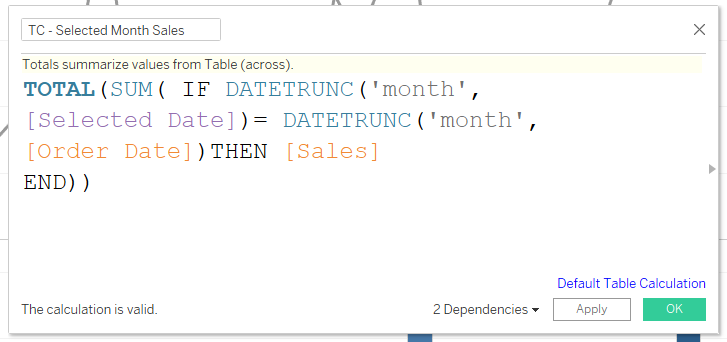
Then to calculate the difference from the selected date, a simple subtraction is made.

Dragging that calculation into the rows, we have created the same chart as the LOD method but with a table calculation! Clever us.
Follow this link for a first LOD to TC example.
A fixed LOD blog on dates will be coming soon too!
