


After having gone through comparing Tableau Prep to both Python and Alteryx, it's time to move onto another tool that we learn as part of the Data School. In part three of this series of going through different data preparation tools, this blog will be looking at Power Query and how it compares to Tableau Prep and Alteryx.
Power Query is the data preparation tool that is part of the Power BI ecosystem. It's a built-in part of Power BI desktop, allowing you to modify and prepare your data that you're using for your Power BI dashboard. It has one of the closest similarities to Tableau Prep that we will see, as Tableau Prep was designed to work with Tableau in the same way that Power Query was designed for Power BI. However, there are some difference that we will see through the rest of this blog.
To show the difference between the two tools, we will be going through the 2022 Week 22 Preppin' Data Challenge on Critical Role Dialogue. Critical Role is a Dungeons & Dragons podcast/series that has all of their sessions available on Youtube. This challenge is cleaning and preparing data for a gantt chart based on the dialogue of the cast members across their first campaign. Two sheets from the excel file that is part of the input is what we need for this challenge.
To start, we'll begin by looking at what our input looks like and what we want our output to look like. This will help us to design the way that our workflows should work, having a plan to base the real solutions off of. Most of this is based on the requirements given in the challenge, with some changes made along the way.
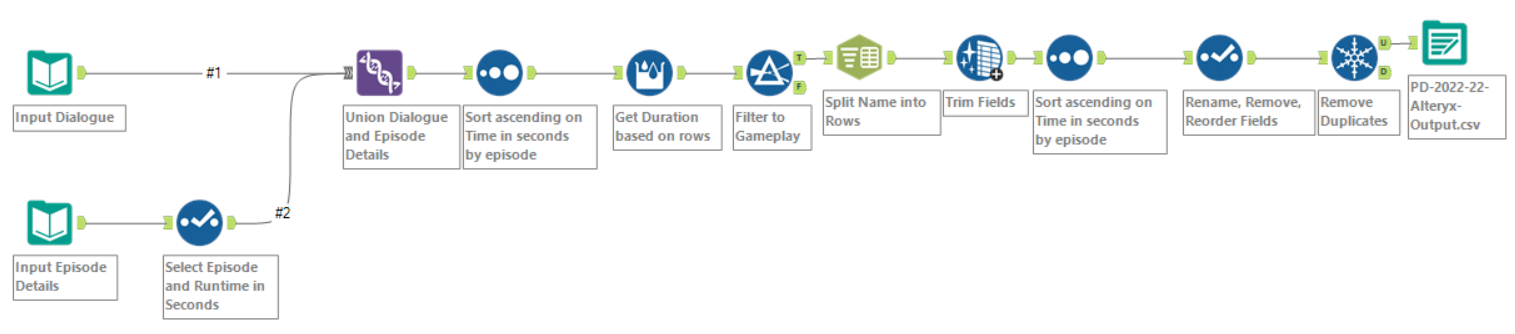
My steps for 2022 Week 22's solution:
- Input the data, using the Episode Details and Dialogue sheets.
- Remove all fields by Episode and Runtime in seconds from Episode Details.
- Union Episode Details with Dialogue, matching Runtime in seconds with Time in seconds.
- Sort ascending on Time in seconds with a grouping by episode.
- Create a new field with the difference between Time in seconds between the current row and the next with a grouping by episode.
- Filter where section is Gameplay.
- Split the name field by the delimiter ',' into rows and trim.
- Remove duplicate rows.
- Rename, reorder, remove fields then output solution.
Based on these steps, a solution is able to be made for Tableau Prep, Alteryx, and Power BI. Each of the solutions can be found below.
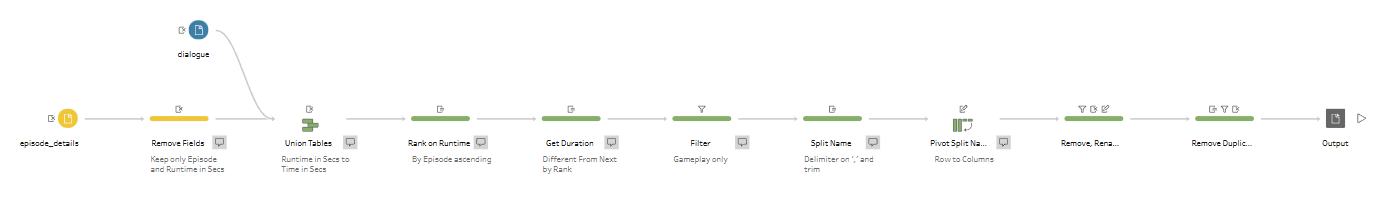
Tableau Prep was the first one that a solution was made from. I find that Tableau Prep is a nice one to begin with as it can be the quickest to get some results with. The steps follow a relatively straight forward path following the outline created in the plan for the solution. It helps as well for the rest of the tools since I now have a better understanding of how to implement it and have a structure to follow.
Alteryx was relatively straight forward to implement based on the Tableau Prep method. In the case of this problem, it was easier to split the names into rows as Tableau Prep does not have a specific tool or function that can split into rows and can only split into columns. And while somewhat visually similar, each and every step is separated into their own object, which helps to show what exactly is going on in the workflow.
Power Query was the most different from the three. After a third go around at doing the same solution, it made the process of making it the easiest. However, there were differences from how to do the same processes from Tableau Prep and Alteryx from Power Query. Power Query also needed to introduce a join to do the difference from calculation for the duration field, which added a level of complication that wasn't needed in the other tools.
All three tools were able to finish the challenge with the correct solution. However, there were positives and negatives to using each of the tools. But depending on your situation, each of the tools could be used to complete your task.
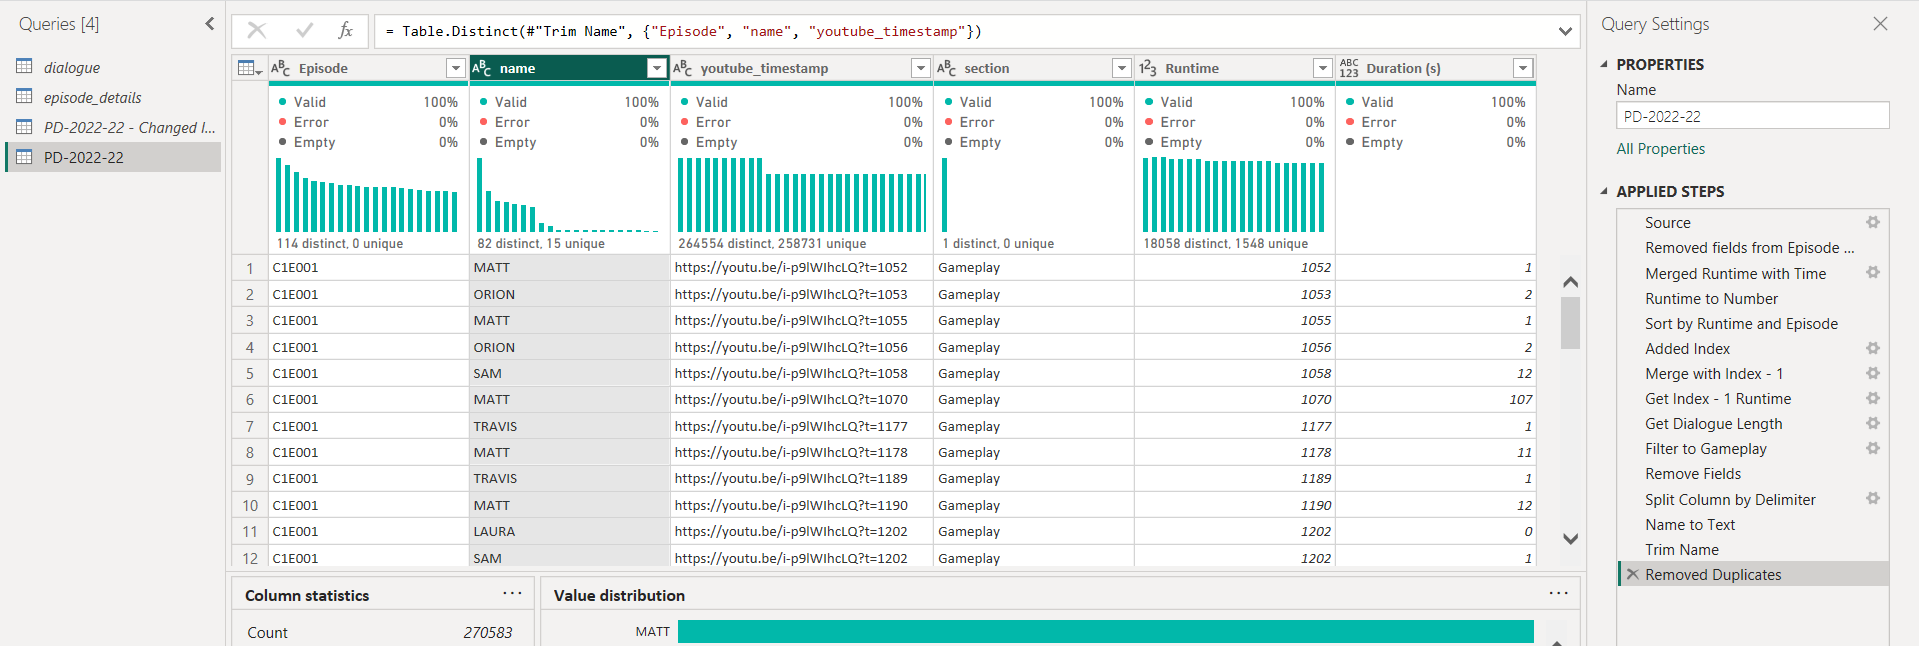
Over the three, Power Query has the most limitations for its use cases, as you can only really use Power Query for Power BI rather than more general situations. However, it does have a lot of flexibility with how it uses the language M for how each of its tools work. This makes it very easy to make changes to the step to complete exactly what it is that you need it to do. It also has, in my opinion, the best data interpreter out of the three as you can very easily see the data and the different profiles of the fields. But it is the hardest to understand the workflow at a glance, and is the least forgiving when a mistake is made and you need to undo your work.
Next would be Tableau Prep as it is able to be used to cases outside of just the Tableau ecosystem, while still having some nice integration with Tableau desktop. The visual overview of the steps helps with understanding as well. However, it isn't clear what is happening in the steps unless it has been properly documented. And is limited by Tableau own calculated fields to do more complex tasks, which it sometimes cannot do.
Overall, I would say that Alteryx is the best for general data preparation use cases. It's has the most flexibility with its tools, with the best balance between just needing to drag in the tool to coding in your solution out of Tableau Prep and Power Query. It can also import and output into many different data types, which is something that Power Query lacks with its inability to export for a different application outside of its own ecosystem to use.