


If you're preparing for the Alteryx Advanced Certification, you have come to the right place. I recently completed the exam and wanted to share my experience, along with detailed notes on the tools you need to understand.
Exam Overview
Format:
- 51 questions total
- 48 multiple-choice, multiple-response, and matching questions
- 3 practical application questions
- Uses the latest version of Desktop Designer with AMP disabled
Topic Breakdown:
- Advanced data preparation and transformation - 27%
- Analytical applications and productionising - 20%
- Macros - 18%
- Data sources - 15%
- Reporting tools - 10%
- Spatial analytics basics - 10%
My Top Tips
1. Use the "Open Example" Feature: For tools you're not familiar with or haven't used recently, open Alteryx, right-click on the tool in the toolbar, and select "Open Example." This gives you a pre-built workflow you can run and interact with to see exactly how the tool works and what the output looks like. This was very important for my preparation.
2. Budget Time for Practical Questions: I found the exam quite similar to the Core exam for the multiple-choice questions, with maybe a slight step up in difficulty when narrowing down correct choices. However, the practical questions were significantly more involved. There are only 3, but they require complex workflows and careful thinking. Make sure you allocate sufficient time for these.
3. Keep Alteryx Open During the Exam: Having Alteryx open during the exam was incredibly helpful, especially for the Spatial tools section. Some questions simply test your knowledge of configuration options and what's available in the configuration pane. Being able to jog my memory with what the configuration for each tool looks like is super helpful, so make sure you have all of the relevant tool families selected to be shown on your toolbar before the exam.
4. Practice with Weekly Challenges: Work through practical examples before the exam. You can search for "Alteryx Weekly Challenge" + whatever tool you need more practise with and go for what has been flagged as involving that tool online.
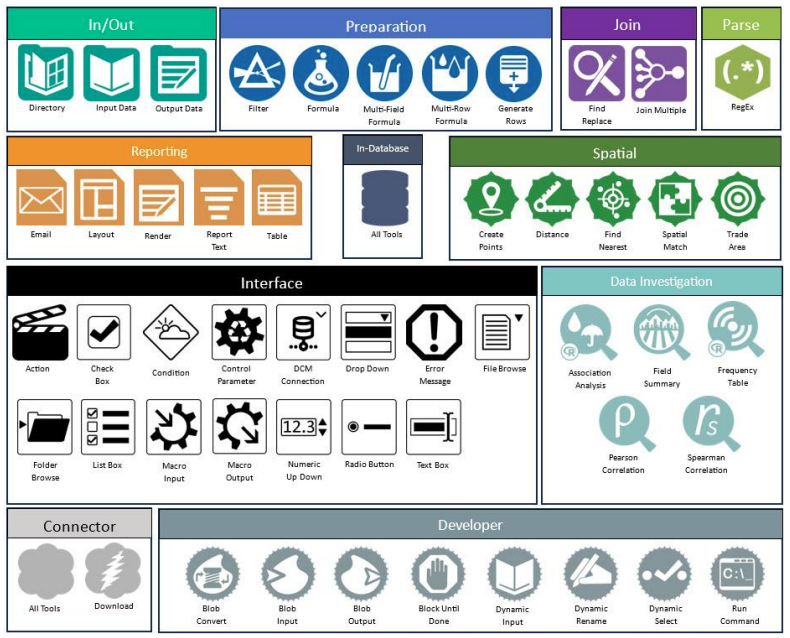
Complete Tool Reference Guide
Below is a comprehensive breakdown of every tool outlined in the exam syllabus, organised by category. I focused more on tools that are not covered in as much detail during training, and also tried to include useful resources to research and practise further.
In/Out Tools
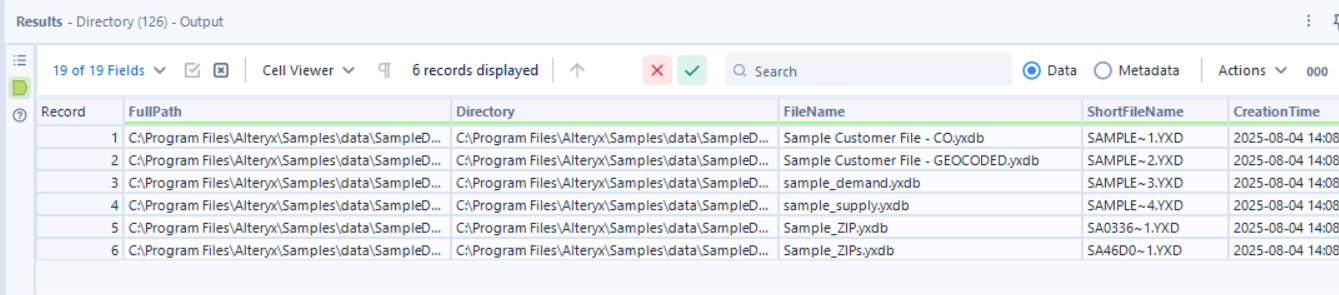
Directory
Returns a list of all files in a specified directory, including metadata like file size, creation date, and last modified date.
Configuration:
- Enter the location path or browse to the directory
- Specify file types using wildcards (e.g.,
*.*for all files,*.csvfor CSV files only) - Choose to include or exclude subdirectories
Resource: Alteryx Directory Tool & Dynamic Input by John Power
Input Data
There were a few aspects of Input Data that I noticed would be worth studying for the exam.
Firstly, knowing what file types can be inputted, helpful to have a list handy of what is supported by Alteryx for input.
Also knowing how to input multiple files from the same file path, i.e. using wildcards in the file path within the Input Data tool:
C:\folder\*.csv- brings in all CSV files from the folderC:\folder\Sales*.xlsx- brings in all Excel files starting with "Sales"C:\folder\2024*.csv- brings in all CSV files starting with "2024"
What is important to understand is that to use wildcard input, all files must have the same schema (same number of fields, same field names, same data types in the same order). Alteryx uses the first file as a template, and any subsequent files that don't match are skipped with a warning.
Also knowing that you can right-click on the Input Data tool and selecting "Convert to Macro Input" for Macro building.
Output Data
Knowing that the Output Data tool cannot be directly converted to a Macro Output. Instead, you need to:
- Use a Browse tool and convert that to a Macro Output (right-click Browse → Convert to Macro Output)
- Or add a Macro Output tool from the Interface tools palette
Preparation Tools
Filter
Splits data into two streams based on a condition:
- True anchor: Rows that meet the condition
- False anchor: Rows that don't meet the condition
Formula
Creates or updates columns using one or more expressions to perform calculations and operations.
Multi-Field Formula
Creates or updates multiple fields using a single expression. Useful when you need to apply the same calculation across many columns.
Multi-Row Formula
Creates formulas that reference values from other rows in the dataset, either rows above (previous) or rows below (following) the current row. It is like having a "window" to look at neighbouring rows. A common use case would be running totals and cumulative sums.
Key concepts:
- Row references:
[Field Name][-1]for previous row,[Field Name][+1]for next row - Number of rows: Specify how many rows to look back or ahead
- Grouping: Row references reset at each new group boundary
Resource: Using Multi-Row Formula in Alteryx by Emily Dowling
Generate Rows
Creates new rows of data at the record level. Can generate sequences of numbers, transactions, or dates.
Setting it up:
- Initialisation Expression: Applied to the first record
- Loop Expression: Increments or builds subsequent rows (e.g., add 1, add a day)
- Condition Expression: Continues building rows until this condition is false

Resource: Generate Rows: The Unsung Alteryx Tool by Harry Osborne
Join Tools
Find Replace
Finds a string in one column and replaces it with a specified value from another dataset. Can also append columns to rows.
Anchors:
- F input (Find): The table that will be updated
- R input (Replace): The table containing data used to replace or append data
Join Multiple
Combines 2 or more inputs based on common fields. By default it outputs a full outer join.
Parse Tools
RegEx
There were quite a few questions on RegEx in the exam. I would say understanding the different output methods and RegEx fundamentals is very important.
Output Methods:
- Parse: Extracts marked groups into separate columns
- Tokenise: Splits text into rows based on a delimiter
- Replace: Substitutes matched patterns with new text
- Match: Returns only rows that match the pattern
Exam tip: Have a RegEx cheat sheet handy and practice with examples beforehand.
Resources:
RegEx: An Introduction and Cheat Sheet by Sherina Mahtani
RegEx101: If you have time to test your RegEx expressions are correct during the exam
Reporting Tools
These tools work together to create formatted reports via the Render tool. We don't tend to use these tools a lot as we often focus more on the data preparation side of Alteryx, so it was good to go through all of the given examples on Alteryx to understand how to configure them and what the output of these tools are.
Sends an email for each row/record in the data stream.
- Can add attachments and view email-generated reports
- Runs as the last tool in your workflow
- Options for authentication and encryption
Layout
A reporting snippet is an Alteryx data field containing the necessary information and formatting for a specific report element (chart, table, image, etc.).
Reporting tools that create snippets:
- Table
- Report Text
- Image
- Report Map
- Interactive Chart
- Report Header/Footer
The Layout tool arranges 2 or more reporting snippets to output as a report via the Render tool.
Configuration:
- Organises snippets horizontally or vertically
- Sets width and height of columns and rows
- Adds borders and separators
You can use a Join Multiple tool to join all report snippets together before adding the Layout tool.
Render
Transforms report snippets into reports in various formats: HTML, PDF, DOCX, PPTX, PNG, etc. This is often used in conjunction with the Layout tool which is used to arrange all of the snippets, which can then be passed through the Render tool to actually output the final formatted report.
Report Text
Creates a text element to output in a report. Can use incoming data as values for the text and provides styling options.
Table
Creates a data table or pivot table to output in a report via the Render tool.
In-Database Tools
In-Database tools allow for ETL and calculations in the source system without moving data out of the database. Alteryx Designer acts as a visual SQL query builder where you drag and drop tools which get converted into SQL queries that execute in the database.
Benefits:
- Faster processing for large datasets
- Reduced data movement
- Leverages database computing power
Browse In-DB
Views data at any point in an In-DB workflow.
Connect In-DB
Creates an in-database connection in a workflow.
Data Stream In
Brings data from Designer into the In-DB workflow.
Data Stream Out
Streams data from an In-DB workflow back to Designer for further processing with standard tools.
Filter In-DB
Filters records using the native language of the database.
Formula In-DB
Updates fields in an In-DB stream with an expression.
Join In-DB
Combines two In-DB data streams by performing an outer or inner join.
Sample In-DB
Limits the In-DB stream to a specific number or percentage of records.
Select In-DB
Selects, deselects, renames, and reorders fields in an In-DB workflow.
Union In-DB
Combines two or more In-DB data streams with similar data structures.
Write Data In-DB
Uses the In-DB stream to create or update a table directly in the database.
Spatial Tools
There were quite a few questions on Spatial tools. Understanding when to use each tool and what configuration options are available is important.
Create Points
Creates a point-type spatial object by specifying input fields containing:
- X-coordinate (longitude)
- Y-coordinate (latitude)
Distance
Calculates the distance between two sets of spatial objects, with some different options of how you would like to calculate that distance:
- Ellipsoidal direct point-to-point
- Point-to-edge
- Drive distance
Find Nearest
Identifies the shortest distance between spatial objects in one file and objects in a second file.
Spatial Match
Establishes the spatial relationship between two sets of spatial objects. These relationship types include:
- Contains
- Intersects
- Touches
- Within
- Crosses
- Overlaps
It is good to know the difference between these different relationship types!
Trade Area
Creates a region around specified point objects:
- By defining a radius around a point
- By drive time from a point
Resource: Challenge 6: Spatial Route
Interface Tools
These tools are essential for authoring apps and macros. They design user-interface elements and update workflow tools at runtime based on user specifications.
Action
Updates the configurations of a workflow with values provided by interface questions.
Check Box
Displays a checkbox option to the end user in an app or macro.
Condition
Tests for entered values and returns either true or false.
Control Parameter
The input for each iteration of a batch macro. Essential for batch macro functionality.
DCM Connection
Stands for Data Connection Manager.
- Allows use of centrally stored, secure connections (database credentials, API keys)
- Prompts user to select a saved connection from their DCM vault at runtime
- Ensures sensitive passwords aren't embedded in the workflow
Drop Down
Displays a single-selection list in an app/macro.
Error Message
Displays an error message for an app/macro based on criteria in an expression.
File Browse
Displays a file browse control in an app.
Folder Browse
Displays a folder browse control in an app/macro.
List Box
Adds a list box where users can make multiple selections in an application/macro.
Macro Input
Sets the interface, tool configuration options, and anchors for a macro.
Macro Output
Controls how output anchors display for a macro tool.
Numeric Up Down
Displays a numeric control in an app/macro for entering numbers.
Radio Button
Displays radio buttons for end users to make single selections in an app/macro.
Text Box
Displays a text input box in an app/macro where users can type in values, and the user-entered value is passed to downstream tools via an Action tool. It has some configuration options such as:
- Mask text - e.g. for passwords, users see asterisks instead of their actual text
- Multiline - creates a larger textbox that allows multiple lines of text
- Default text - pre-populates the text box with example or default values
Data Investigation Tools
Association Analysis
Determines which fields in a database have a bivariate association.
Field Summary
Analyses data and creates a summary report containing descriptive statistics.
It has 3 different Output anchors that each give insight into the landscape of your data, making it a useful tool for initial data exploration:
- O Output - displays a table in the Results window with information about each column in the incoming data (e.g., min, max, median, mean, standard deviation, percentage of missing values, number of unique values)
- R Output - requires a Browse tool but produces a static report essentially visually showing the results in the table of the O output anchor
- I Output - requires a Browse tool but produces an interactive report overviewing the data via histograms
How it differs from Browse:
- Generates actual data tables and dashboards of statistics and recommendations
- Output can be used downstream in your workflow
- Better suited for data quality assessment and model preparation
- Browse is typically used for validation, Field Summary is for analysis
Frequency Table
Creates a table showing the count and percentage of every unique value in selected categorical or numeric fields.
Use case: Understanding the distribution of your data, identifying common values, spotting outliers.
Pearson Correlation
Uses the Pearson Product-Moment Correlation Coefficient (PMCC) to measure the correlation between two variables.
What it measures:
- The linear relationship between two continuous variables
- Strength and direction (positive or negative) of the relationship
- Example: As X increases, does Y also tend to increase?
Spearman Correlation
Assesses how well a monotonic function could describe the relationship between variables.
How it differs from Pearson:
- Based on the rank of data values rather than actual values
- Less sensitive to outliers than Pearson
- Measures monotonic relationships (not strictly linear)
Connector Tools
Custom tools that access cloud applications and products to read/write data or download/upload files. All of the different variations are available on the Alteryx Marketplace and are available for download as YXI files when necessary.
Examples:
- Adobe Analytics
- Amazon S3 Download
- Google Analytics Tool
- Google Drive Input/Output Tool
- Microsoft Power BI Output Tool
- Tableau Input/Output Tools
Download
Retrieves data from a URL to use in downstream processing or save to a file.
Use cases:
- APIs
- Web scraping
- Downloading files from web sources
Developer Tools
Understanding "Blob": Blob stands for Binary Large Object. It is a collection of binary data stored as a single entity that isn't necessarily interpreted as text. In Alteryx, any non-standard data type (image file, compressed ZIP archive, raw web download output) is stored in a Blob field.
Understanding "Dynamic": When "dynamic" appears in an Alteryx tool name, it means the tool's configuration is determined or changed at runtime by incoming data, rather than being fixed when you build the workflow.
Blob Convert
Converts different data types to a Blob, or converts a Blob to a different data type.
Blob Input
Reads a Blob (such as an image) by browsing directly to a file or passing a list of files to read.
Blob Output
Takes Blob data and saves it as individual file, so that each record becomes its own separate file
Example workflow:
- Download tool fetches image files from URLs
- Raw binary data for each image is placed in a field called DownloadData
- Blob Output loops through each record and saves the binary content as a unique image file
Block Until Done
Stops datasets from going downstream until the last record is processed by previous tools. It ensures operations complete in the correct order, particularly useful when writing to databases or files.
Dynamic Input
Reads from an input database at runtime and dynamically chooses what records are read.
How it works:
- Reads multiple files/database tables with similar structures without needing a separate Input tool for each
- A field in the incoming data stream contains the full path/name of the file or table
- Alteryx iterates through these paths
Use case: Processing a directory of similar files or multiple database tables with the same structure.
Dynamic Rename
Renames columns using information from an input data stream that changes with the data.
Options:
- Removing a prefix
- Using the first row as headers
- Applying rename rules based on a formula or lookup table
Dynamic Select
Selects fields based on field type or via formula, rather than by specific field names.
Selection criteria examples:
- Select all fields starting with 'ID'
- Select only numeric fields
- Deselect fields containing 'temp'
The criteria is determined by a formula applied to metadata as the workflow runs.
Run Command
Runs external command programs within Designer.
Use cases:
- Integrate scripts written in Python, R, or other languages
- Execute operating system command-line tools
- Take input from workflow → run external program → read output back into workflow
Final Thoughts
The Alteryx Advanced Certification is definitely a step up from the Core, but with thorough preparation and hands-on practice, it's absolutely achievable. Focus your time on:
- Tools you haven't used much - Use the Open Example feature extensively
- Spatial tools - Practice with real workflows, not just theory
- Macros and Interface tools - These are heavily tested (18% + 20% of exam)
- RegEx - Get comfortable with the different output methods
- Practical application - Don't just read about tools, build with them
The exam tests not just whether you know what a tool does, but whether you understand when to use it and how to configure it properly. The best preparation is building real workflows that solve actual problems.
Good luck with your certification!