


The 2023 urban climate analysis provides climate data for the entire Hamburg city area in an analysis grid with a 10-meter edge length. It delivers analyses of temperature, cold air generation and movement, and their spatial representation.
Of particular importance are stressful summer weather conditions for humans and the environment, characterized by low air movement and high heat stress. These weather conditions can be highly detrimental to health, especially for children, the sick, and the elderly.
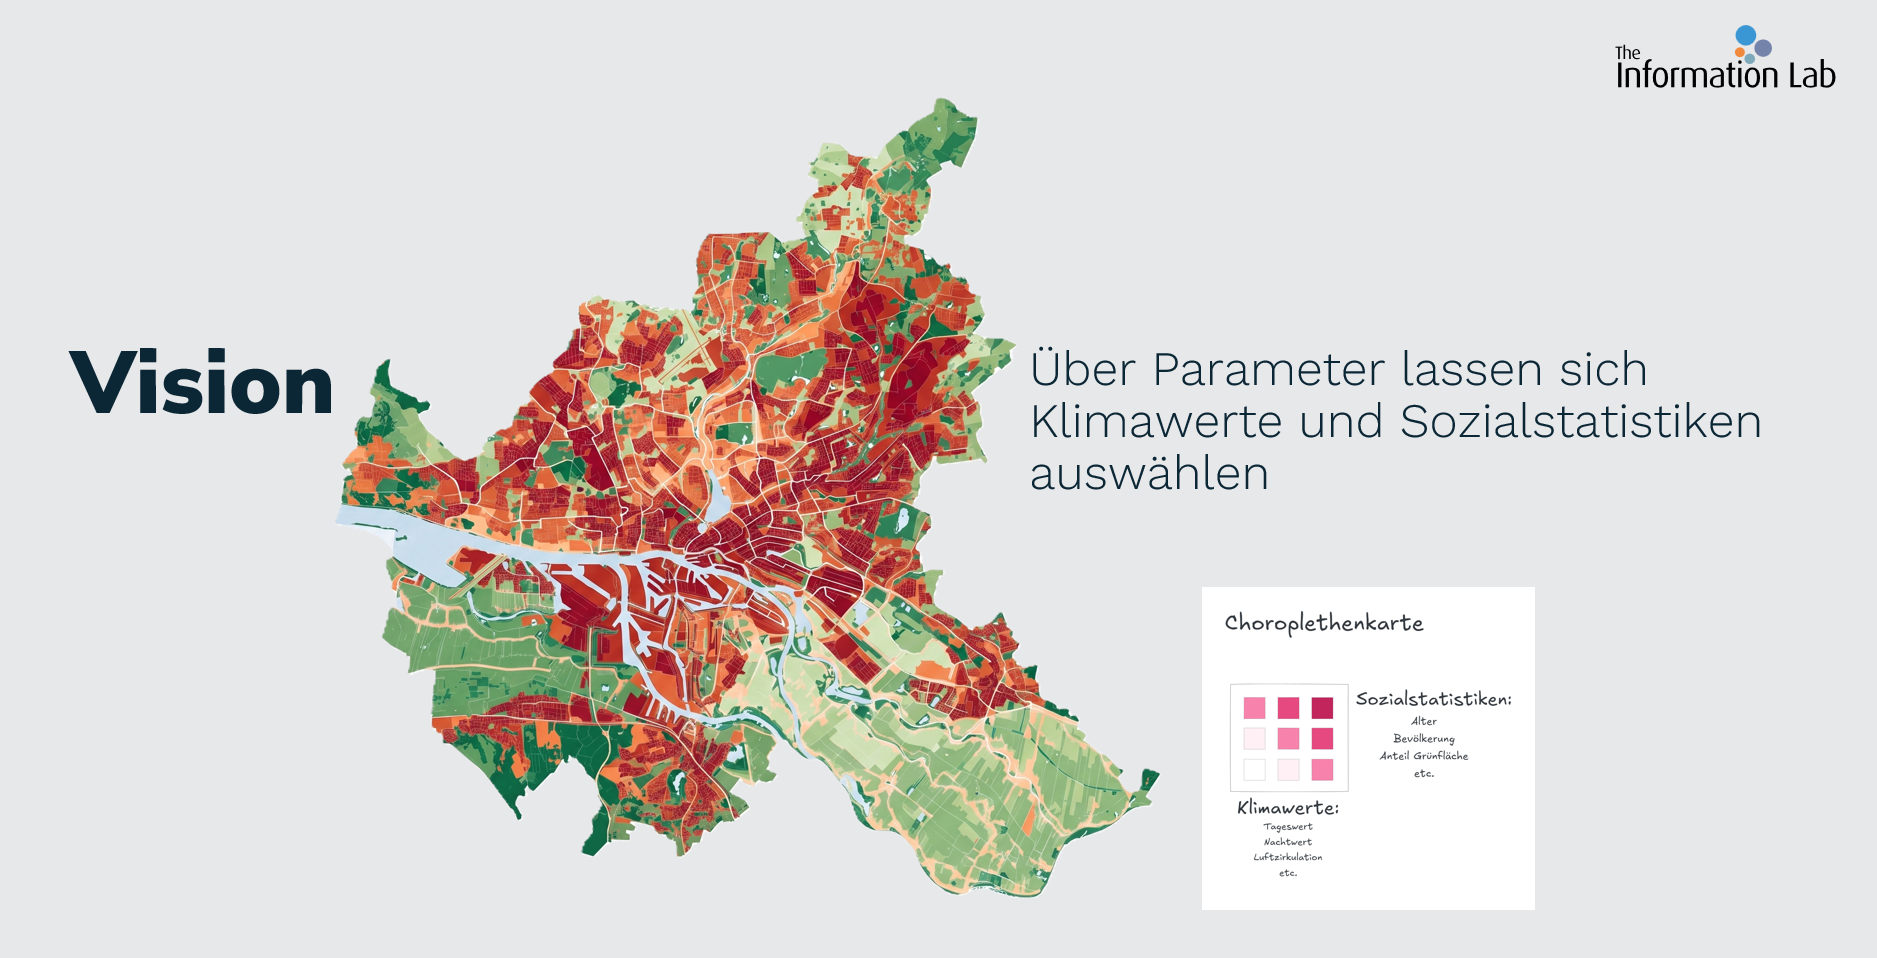
The goal of my project is to link spatial data with existing socio-economic studies from the City of Hamburg in order to locate heat islands with particularly vulnerable population structures (age structure, economic background). This analysis can support ongoing planning and transformation processes and help protect people.
After downloading the data from the City of Hamburg's transparency portal, I was able to achieve good results relatively quickly. Tableau automatically recognizes the geospatial data in my JSON file and maps it correctly to the corresponding measurements. However, as soon as I add the data from the socio-economic study and try to create an evaluation based on it, Tableau unfortunately 'implodes'.The mapping of the geospatial data must be done BEFORE the visualization in Tableau. Joining climate and statistical data is necessary for performance reason. Unfortunately, this introduces further hurdles
- Spatial Join not natively possible in Tableau Prep -> Python script required
- Alteryx lacks automatic geometry recognition like Tableau. Time-consuming, manual spatial parsing and poly-building required to reconstruct the geometry layer by layer ☹
New Title for my Project: Social Heat Map for Hamburg - Linking spatial climate data with socio-economic studies from the City of Hamburg. YAY!
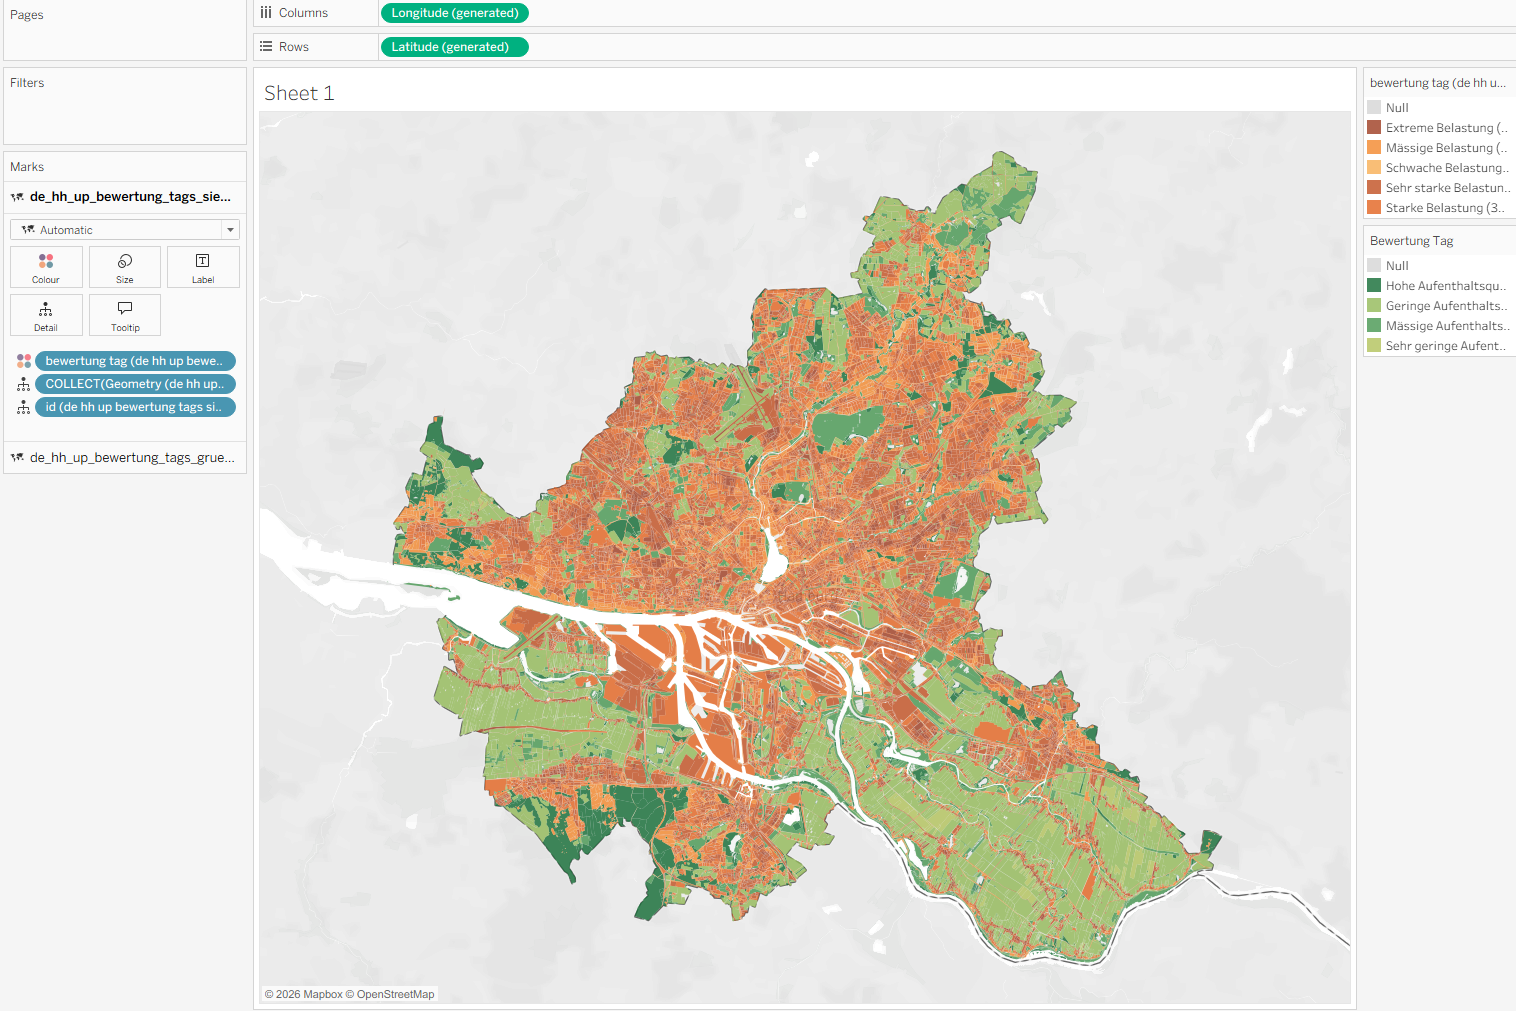
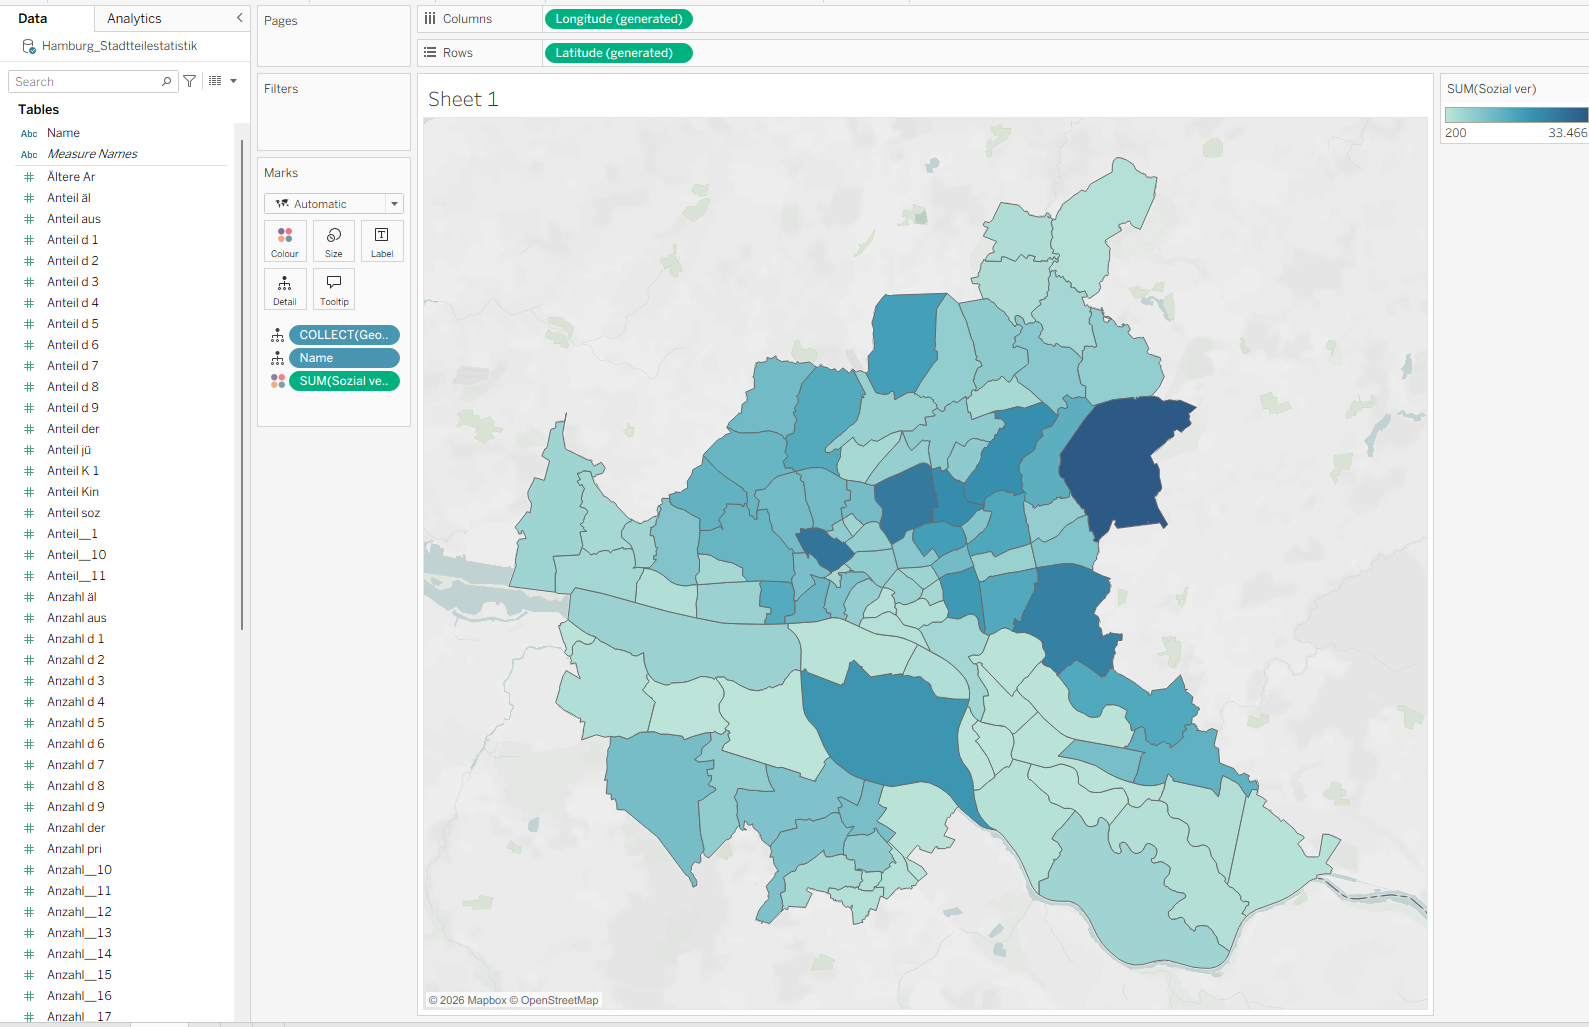
Here are two views of my initial visualizations. A next challenge is linking both datasets so that the climate data can be aggregated and analyzed at the district level.
I will continuously update this post! More to come soon!