


Why Makeover Monday?
Working under time pressure is no walk in the park. To understand how managing your own expectations can help, the Makeover Monday Challenge offers the ideal training opportunity.
The challenge is primarily about planning and efficiency. In 90 minutes, we analyze an existing visualization for errors and potential improvements. We examine the underlying data and review the story of the original representation: What is good, what works, and what could potentially be improved?
A Rough Schedule to Guide You:
- 5 min: Context Is the visualization concise and easy to understand? Does it pique your curiosity? What is the backstory and objective of the original visualization? What works well and what doesn't?
- 15 min: Explore the Data Explore the data to gain your own insights. Experiment with the data using simple charts to develop the "how" and "why." Identify questions or think about how you can expand on the original visualization. What is exciting and can spark interest in the topic? Which insights and display formats would be interesting?
- 15 min: Develop the User Story Next, it’s time to communicate the story visually. Other dashboard or visualization examples can help here. Tableau Public is a great resource for design inspiration. Research similar designs and suitable chart types on Tableau Public and start sketching!
- Don't forget! You only have 90 minutes! Time is ticking! That’s why the planning phase is crucial—you should set aside 30 minutes for it. You don't have time to implement multiple ideas or build complicated dashboards. Focus on your best idea, sketch it out briefly, and check if the data is sufficient. Focus on what is relevant and feasible.
- 40 min: Build Your Visualization! Is your planning complete? Then dive straight into implementing your best idea!
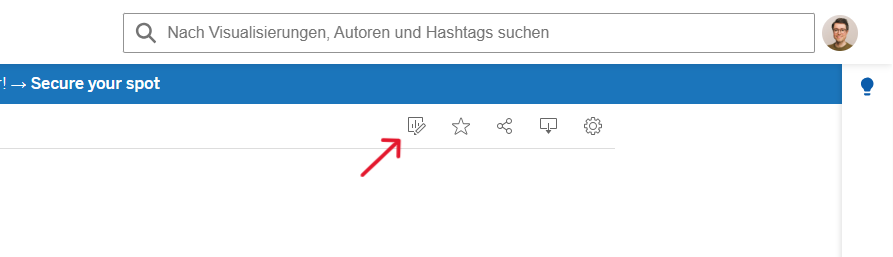
- 15 min: Formatting and Publishing to Tableau Public Finally, make sure to check your headlines, axis labels, and tooltips. Verify that the filters are correct and that your chosen colors guide the viewer’s eye. Upload your visualization in .twbx format and give it a self-explanatory title. If something goes wrong, you can make adjustments later directly on Tableau Public by clicking "Edit" in the top menu (see next image).
If you want to further improve your ability to build dashboards, you can watch this video by Andy Kriebel:https://www.youtube.com/watch?v=GYOyRhsGcWk
Why Does Makeover Monday Help Us?
A vital part of our work as a Data School Consultant is the ability to correctly estimate the scope and timeline of a data analysis project. Good time and expectation management with our clients helps us deliver projects on schedule. It is important that we define goals that are achievable within the timeframe. It makes no sense to pressure your own team with unrealistic goals, nor is it good to raise client expectations too high, only to potentially disappoint them.
That is why we work agile at the Data School and always keep the core of a project in focus.
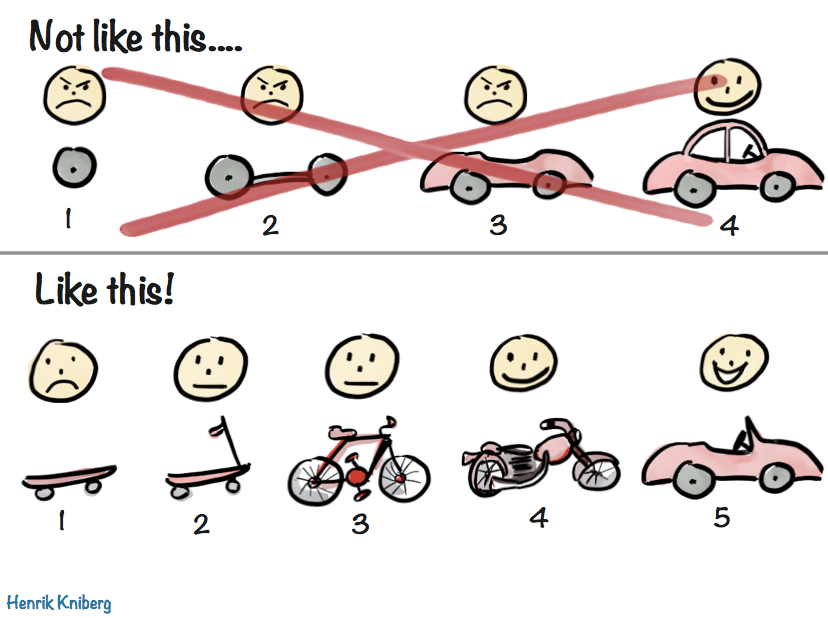
Think MVP! (Minimum Viable Product) In close coordination with our clients, we focus on the core ideas of the data analysis and create a minimum viable product. This MVP is then adapted or expanded as the project progresses.
How does this strategy help us in our daily consulting work?
- We avoid getting lost in details too early.
- We prevent overloading the product with too many requirements.
- We remain open to adjustments and expansions.
Stay tuned for my next post, where I’ll share more about my personal experience with Makeover Monday!