


This blog is part 3 of an introductory guide on how to use DAX (Data Analysis Expressions). Today will be covering logical functions within Power BI Desktop.
This and the worked examples are based on what I learned from Robbin Vernooij! *pause for applause*
Before we start, here are the Cheat Codes of the syntax for logic functions to remember for DAX:
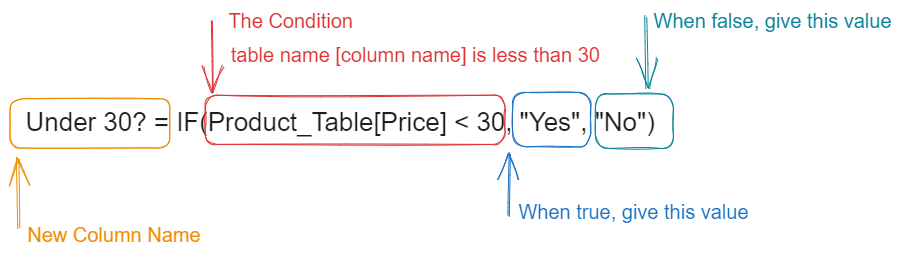
- IF (condition, the_value_if_true, the_value_if_false): For the specified condition, when what is stated is true it will give the first stated value, however, if it is false it returns the second value.
- AND (condition1, condition2, ...): If all the specified conditions stated are true, it gives true. Otherwise, it will return false.
- OR (condition1, condition2, …): If at least one of the specified conditions are true it returns as true. Otherwise, it will return as false.
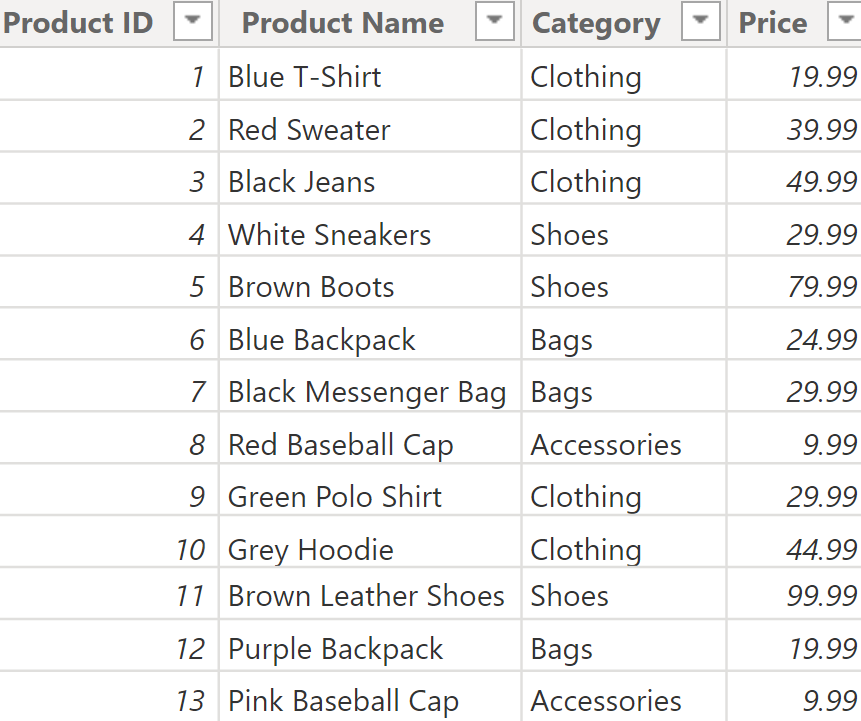
Here is a worked example that shows use cases for these functions: Find the Products that are less than £30, using a Calculated Column
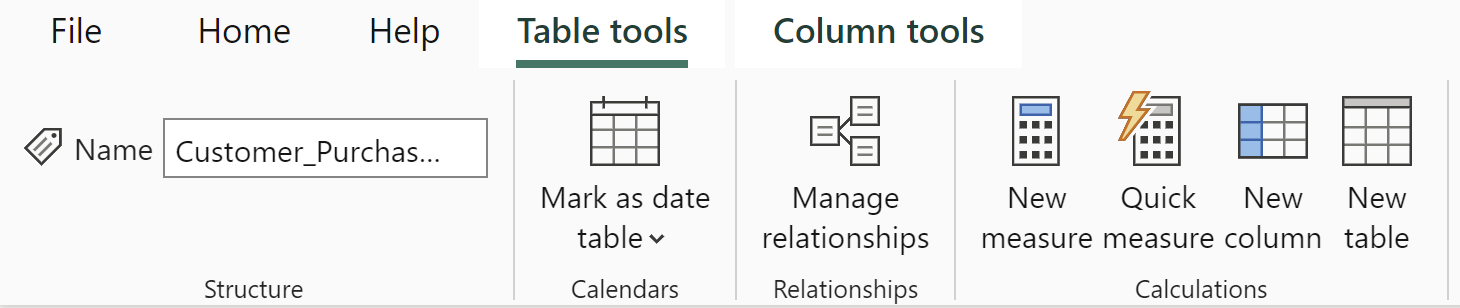
- First, navigate to 'Table Tools' in the dynamic ribbon bar at the top, here you can find the calculation tabs that we will be using.
2. In this task, we have to identify which products are under £30 within the dataset. We can use an IF function to create a column that identifies this.
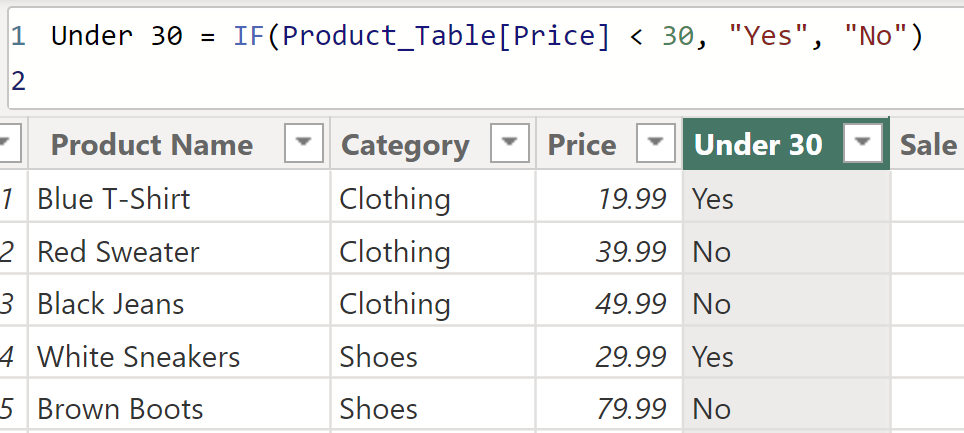
3. Here is an example of the DAX you can use
Hope that helps! Have fun trying out more DAX functions for other uses too.