In Tableau, Measures represent numerical fields that permit data filtering using various aggregations, such as sum, average, median, max, min, and more. These filters can be utilized on the filter shelves, providing choices like 'Range of Values', 'At least', 'At most', and 'Special' to fine-tune the dataset. Following the order of operations in Tableau, measure filters are applied after non-aggregated or dimension filters. This sequence ensures that data is filtered and aggregated appropriately, allowing for precise and accurate analysis in visualizations.
This blog will explore the practical implementation of measure filters and the available options through several case scenarios. To illustrate these concepts, we will be utilizing the Sample Superstore dataset for demonstration purposes.
Scenario
The store wants to know the products with total sales above $15000.
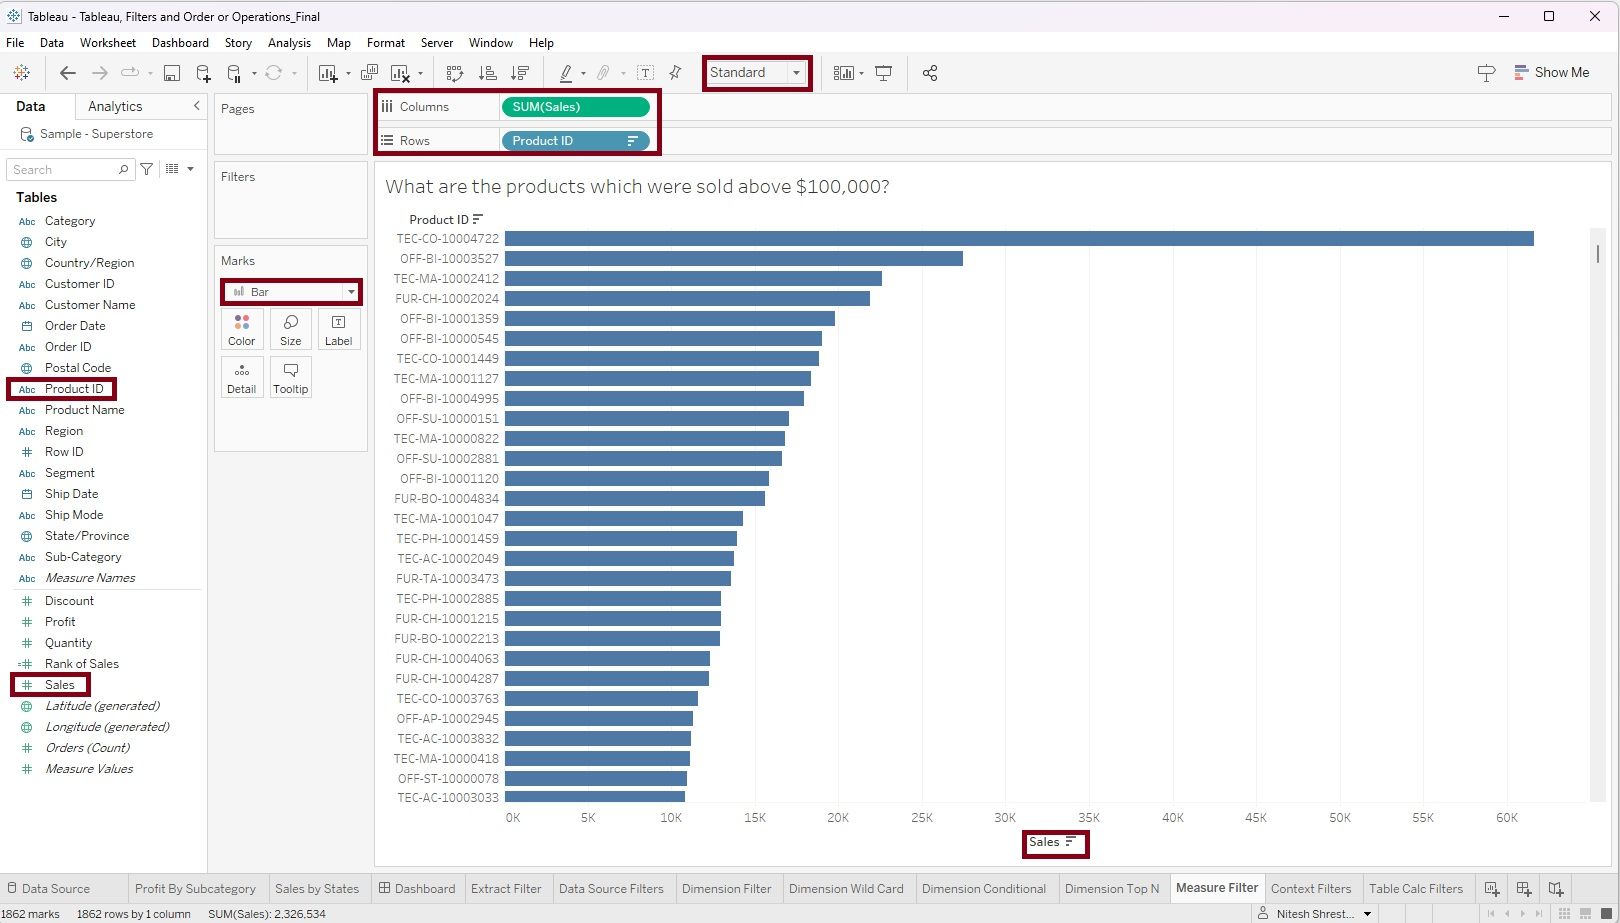
Step 1: Drag the dimension 'Product ID' in the row shelve and measure 'Sales' in the column shelve. Select 'Bar' as a chart type, select the 'Standard view', and sort the bar by 'Sales'.

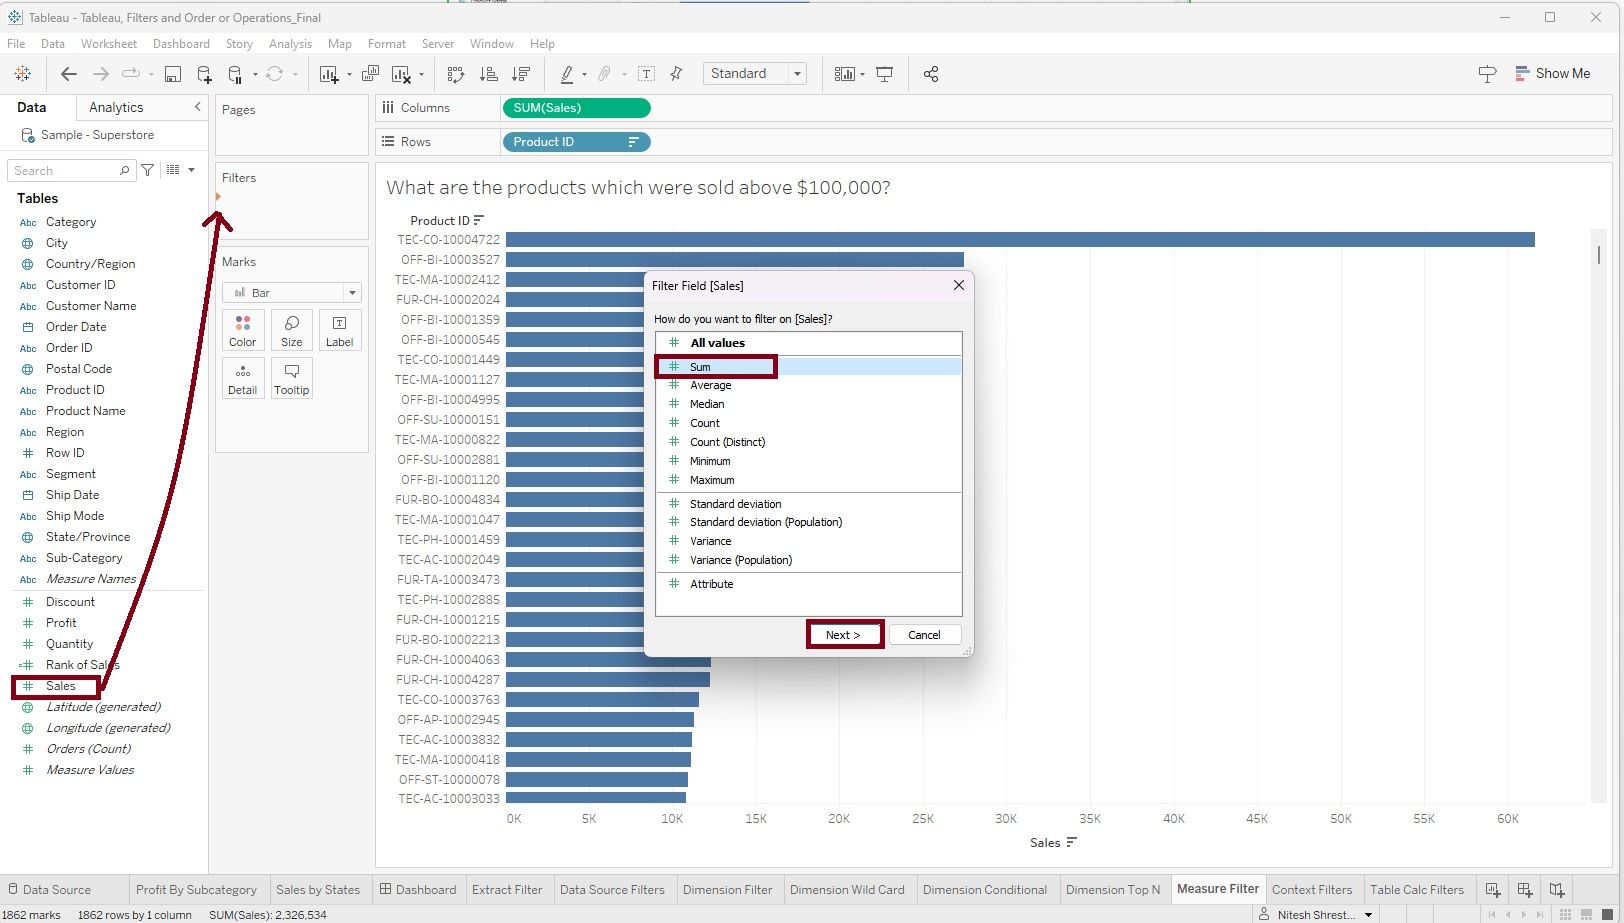
Step 2: Drag the 'Sales' into the filter shelf. A 'Filter Field' window will appear, then choose 'Sum' and click 'Next'.

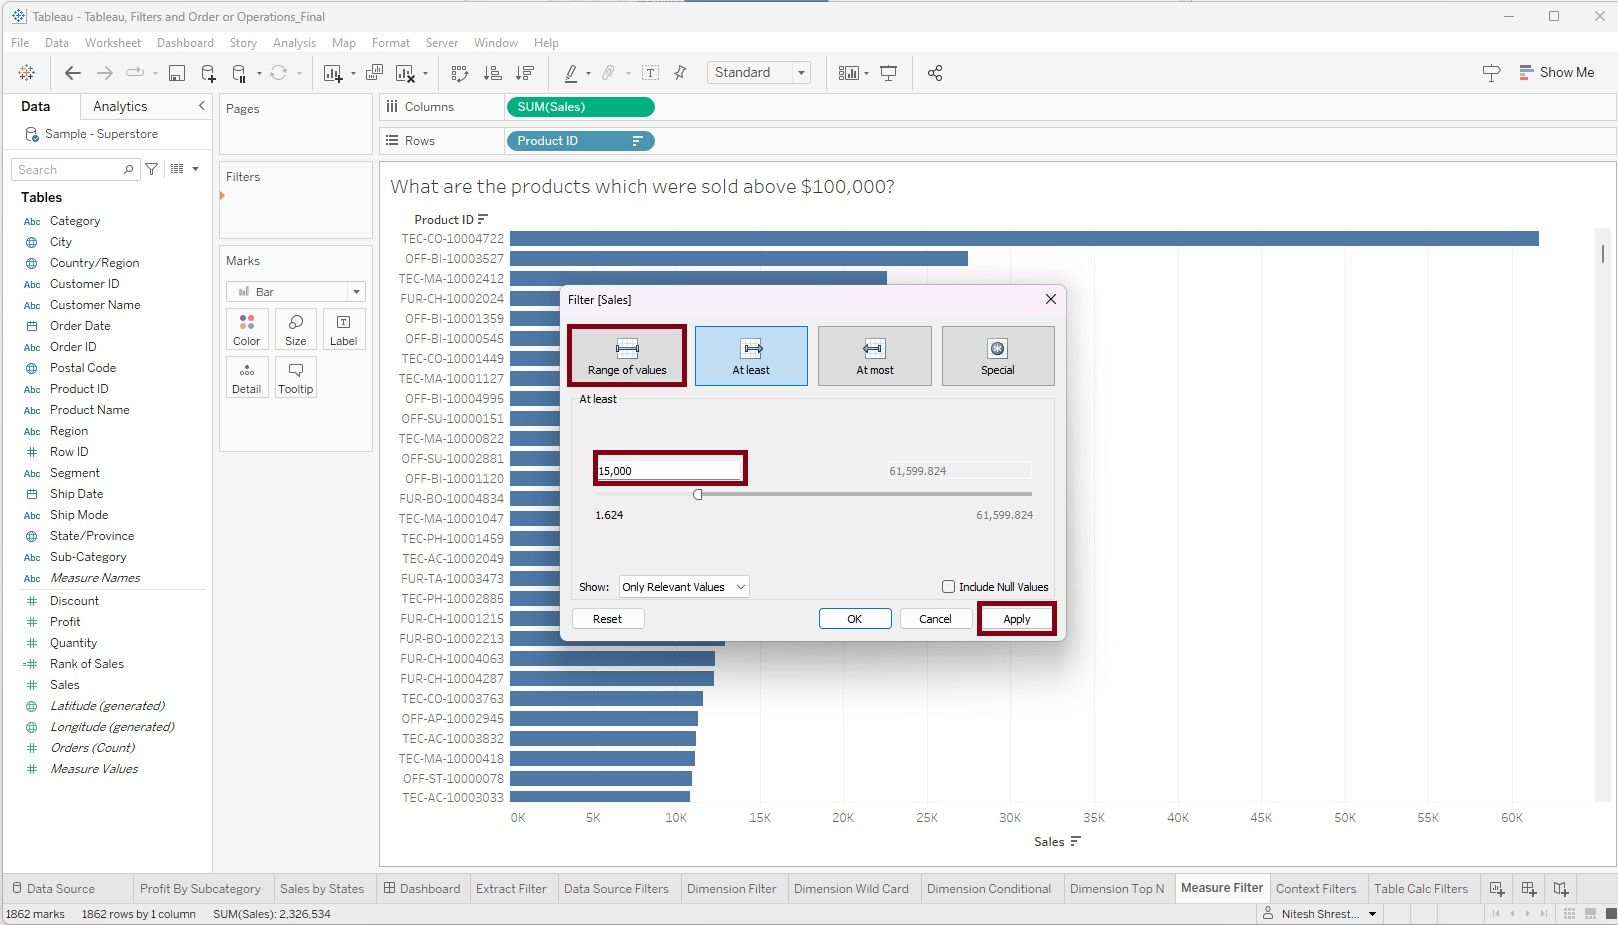
Step 3: A 'Filter' window will appear with choices like 'Range of Values', 'At least', 'At most', and 'Special'. Select the 'At least' option and enter '15,000'. Click 'Apply' and 'OK'

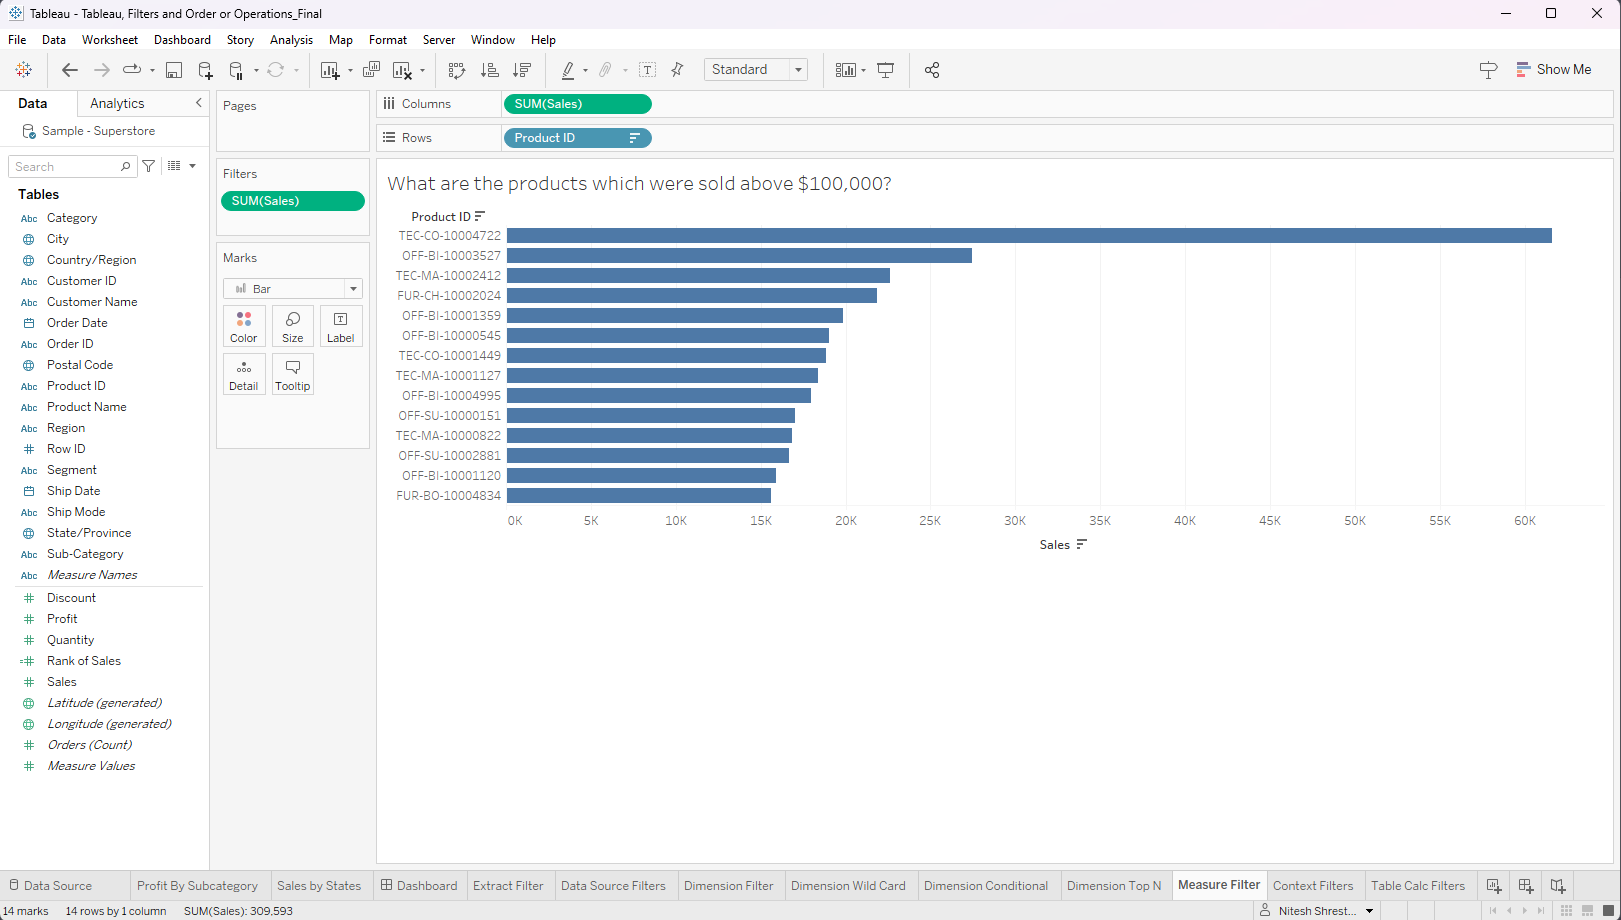
The result of applying this filter will display a bar chart with Products with total sales above $15000.

