Tableau is a pretty powerful visualization and dashboarding tool for us analysts and is pretty beloved here at The Information Lab, but not every client wants to use the same software as us and Microsofts Power BI seems to be on the rise. If you’ve always used Tableau and already reached a high level, exploring a new software like Power BI, might leave you feeling a bit out of your comfort zone. While both tools are excellent for data analysis and visualization, Power BI offers a different approach. In this post, I’ll take you through a beginner’s guide to Power BI, from importing data to sharing reports, so you can start building great dashboards in no time!
1. Installing Power BI Desktop
To get started with Power BI, head to the Microsoft Store, search for Power BI, and choose Power BI Desktop for full functionality. This version is the most robust for modeling data and creating reports, whereas the regular Power BI app is designed for interacting with existing reports.
2. Importing Your Data
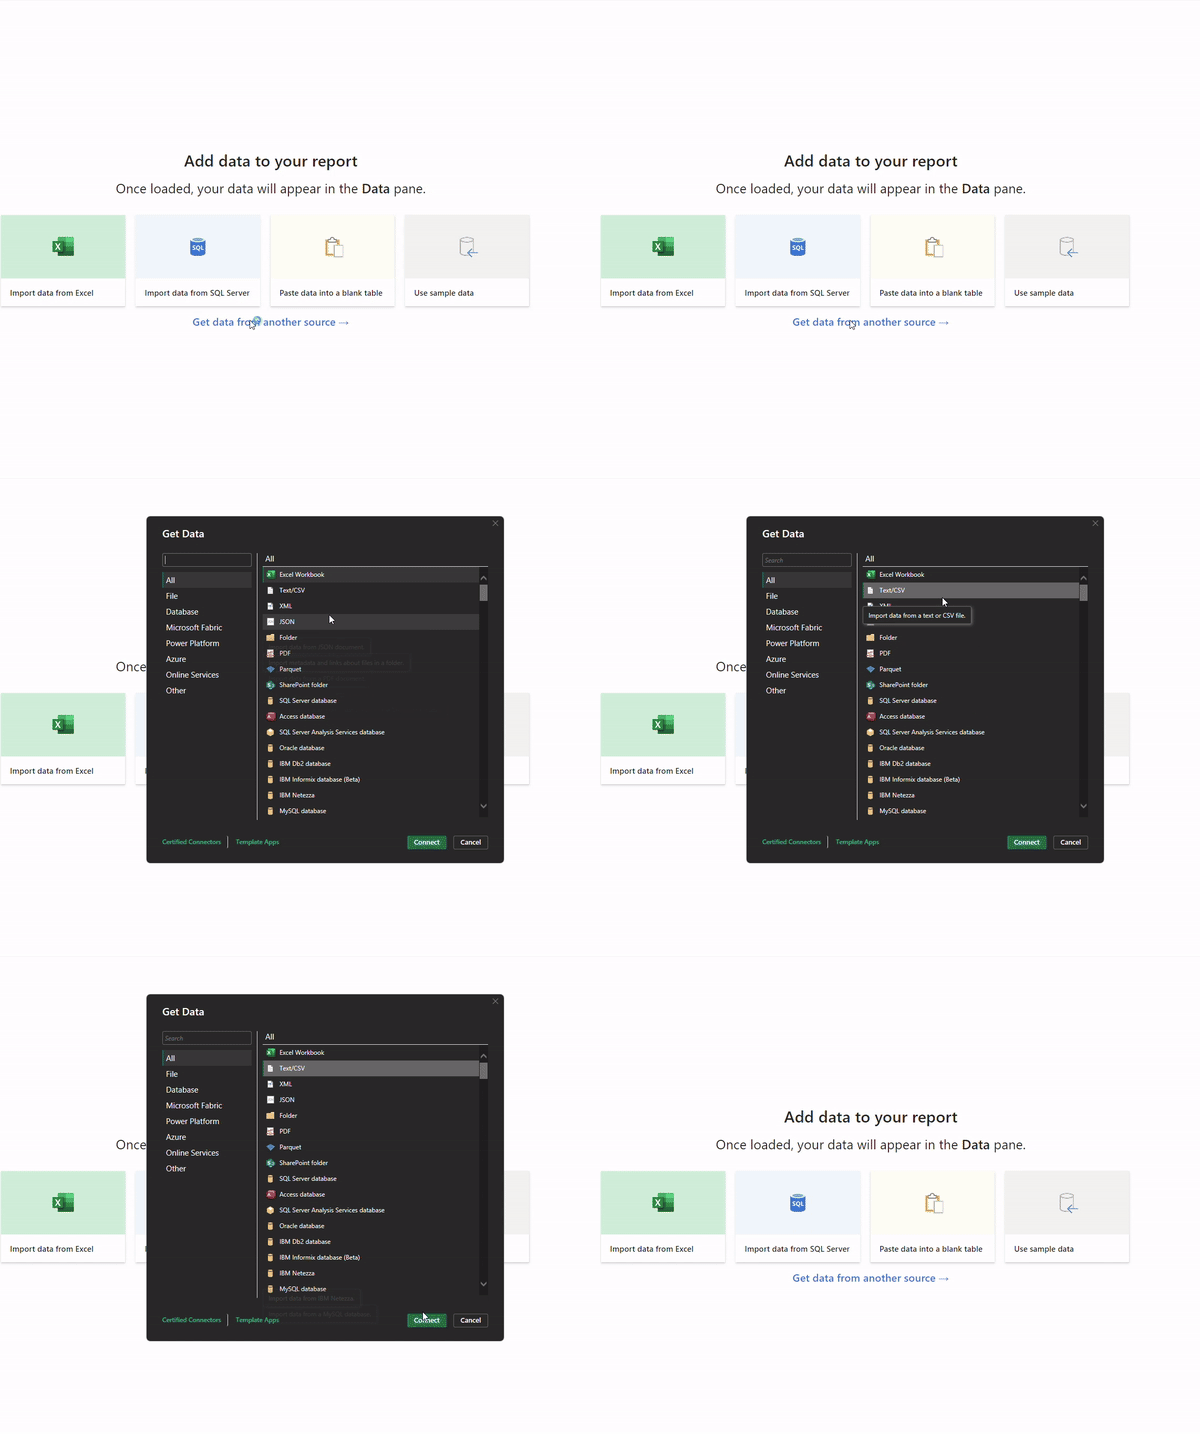
Just like in Tableau, importing data into Power BI is simple and flexible. You can connect to various data sources, including Excel, databases, and more. In this example, I’ll use a CSV of the Sample Superstore. After selecting your file, you’ll get a preview of the available tables, which you can import into Power BI with a click.
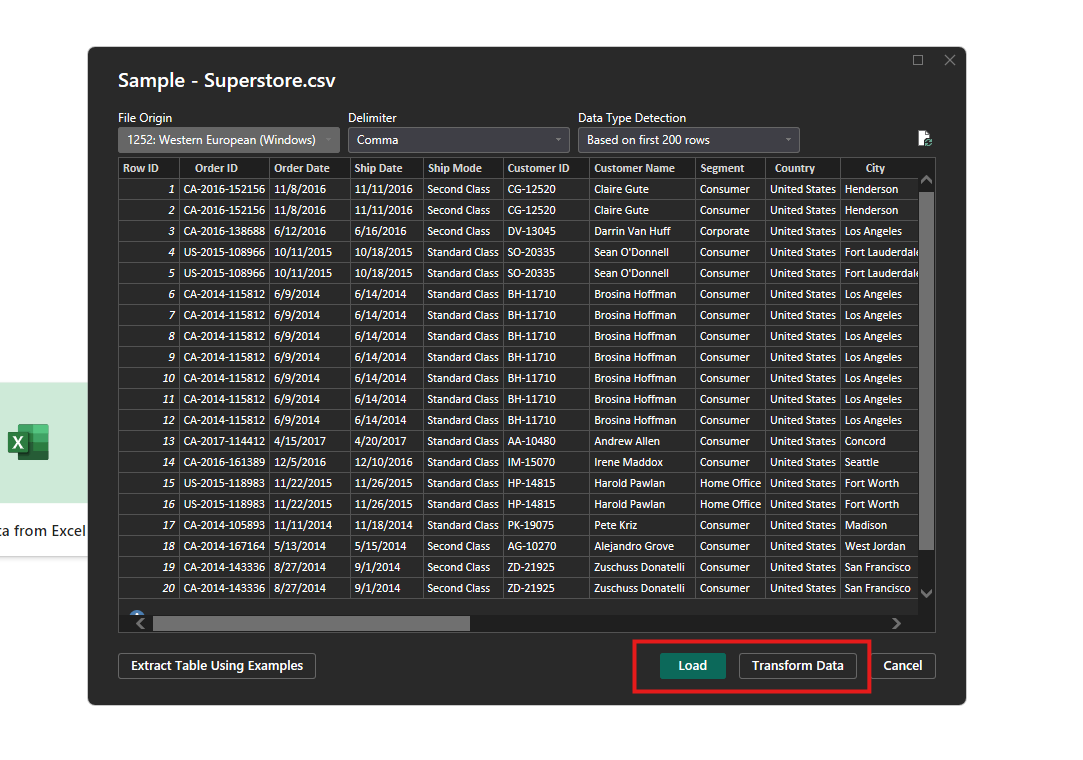
You’ll have the option to load the data as-is or clean it up before importing it by using the Transform Data feature. This is where Power BI’s Power Query Editor comes in handy, allowing you to modify and clean your data on the fly without altering the original source.
3. Transforming Your Data
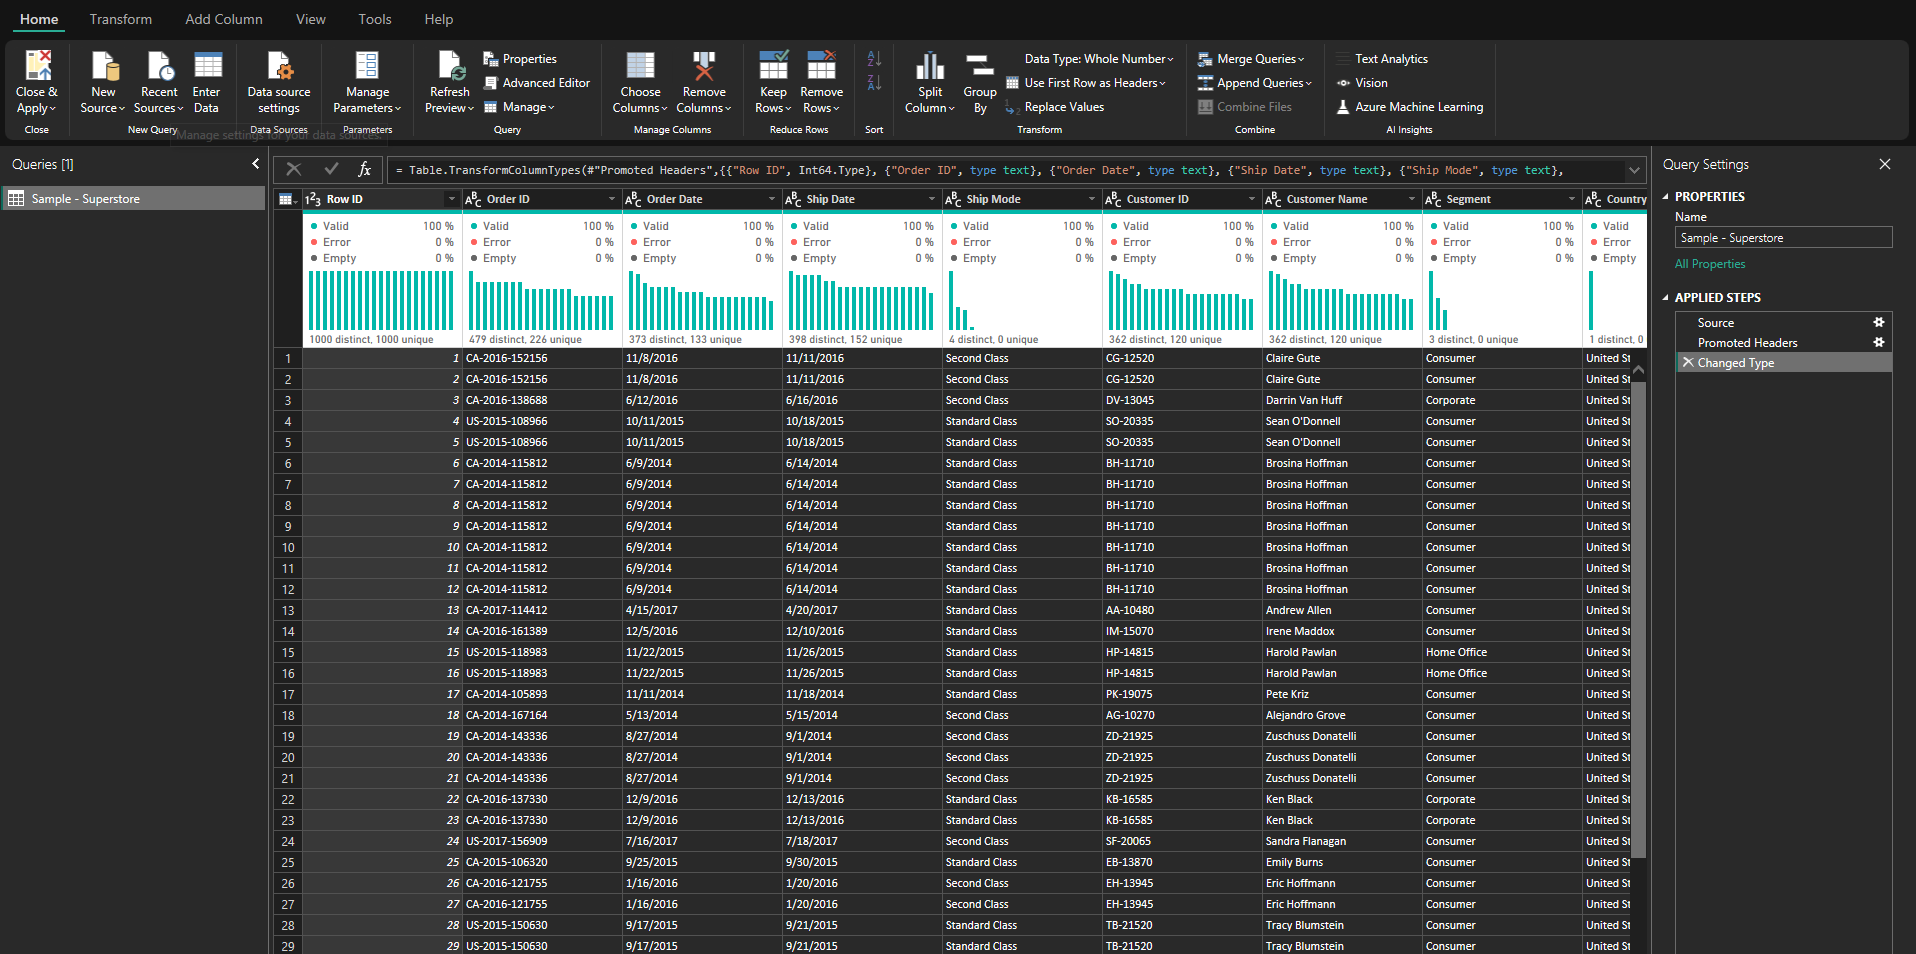
Let's say you'd want to make changes to the data you're using before visualizing so you've clicked onto transform data and a second window called Power Query opened up. This editor is made up pretty simple and intuitively since it's similar to other Microsoft products. We have our intuitively named tools on the top that are categorized rather random into Home, Transform and Add Column. On the left side, we can see all our tables under Queries and on the right is our Applied Steps history, where we can pin point and jump back to any other step of the transformation process.
4. Building Visualizations
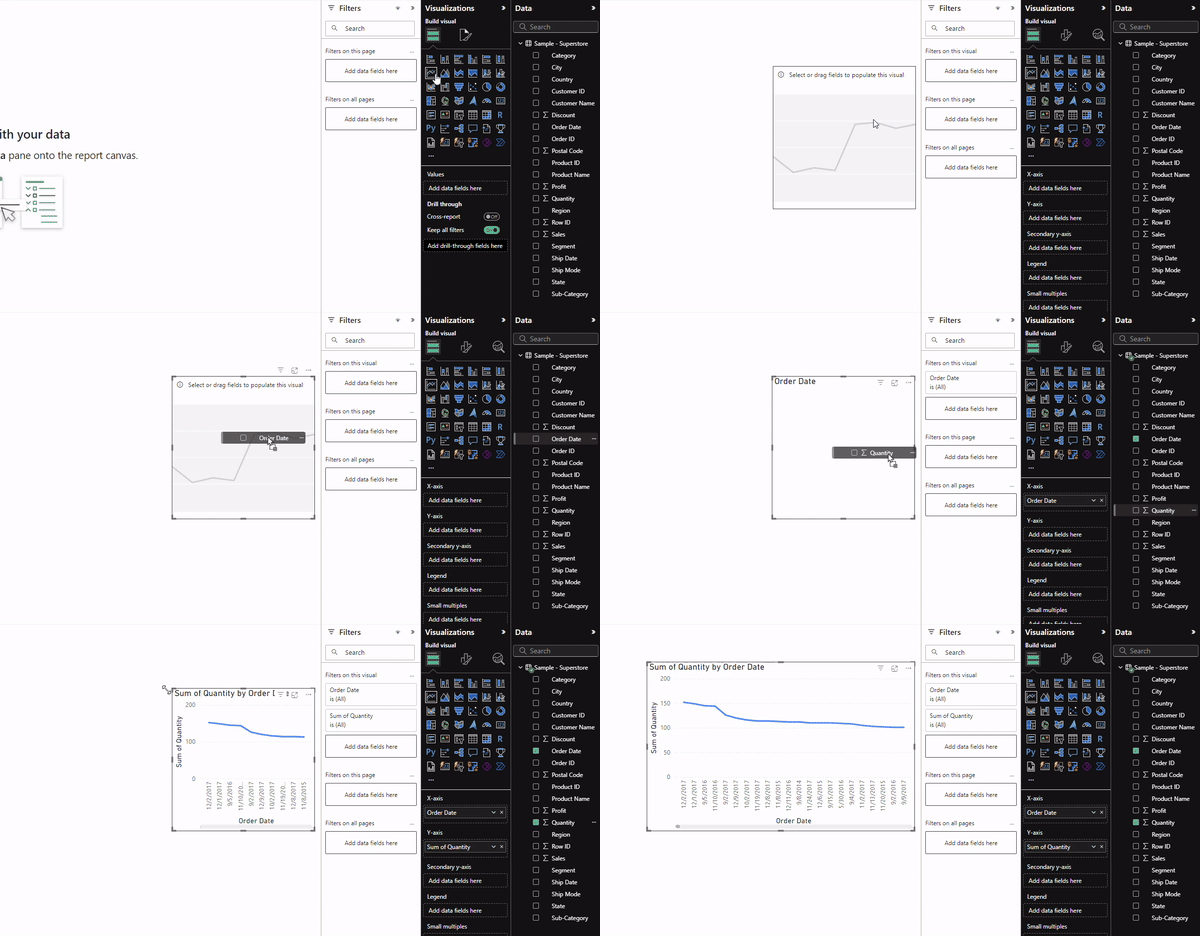
Now comes the fun part—creating your visuals. On the right, you’ll find a list of available visualizations like bar charts, line charts, tables, and more. For instance, if you want to see products sold over time, a line chart would be appropriate so we can just select it and then drag and drop the relevant fields onto the chart.
One difference to Tableau is that Power BI makes the visuals you place onto your report interactive by default. When you click on any data point, it automatically filters other visuals on the report, giving you dynamic insights across your dashboard.
5. Formatting and Refining Visuals
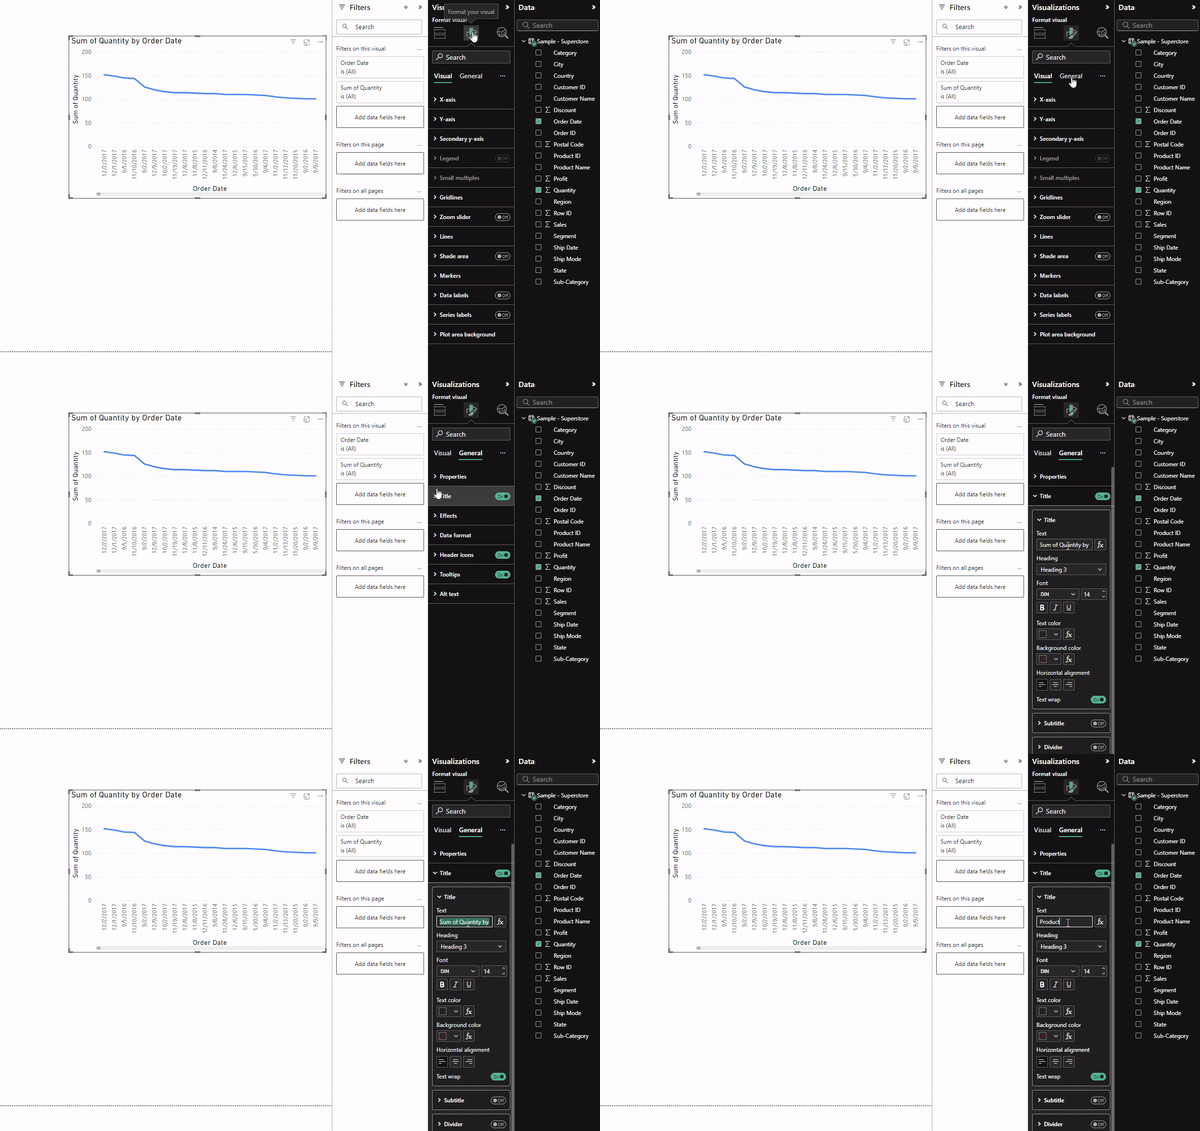
As with Tableau, you’ll want to fine-tune the appearance of your visuals. Power BI allows you to adjust titles, axes, colors, and more under the Format tab. For example, you can change the title of a chart to make it more descriptive or adjust the color scheme to match your stakeholders corporate identity.
6. Sharing Reports
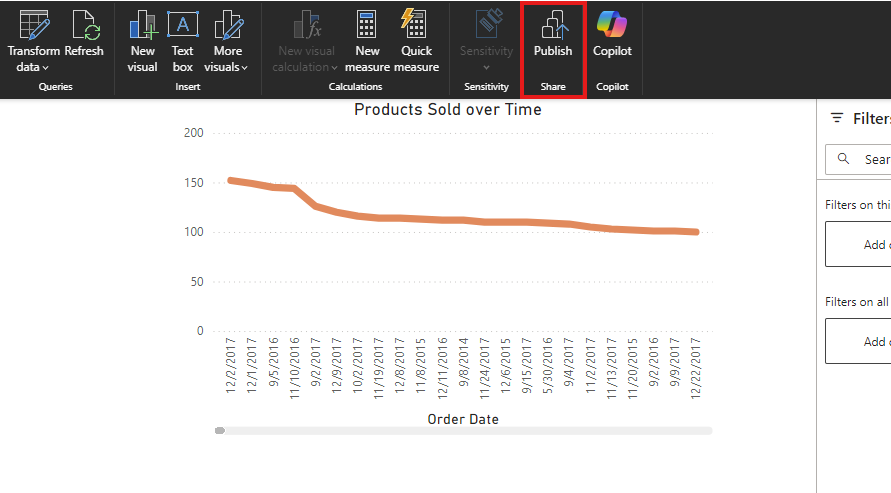
Once your report is ready, you can easily share it with others. Power BI integrates seamlessly with Microsoft tools like Teams and SharePoint, so you can publish your reports to the Power BI web service. From there, you can share a link, embed it on a website, or even export it to a PowerPoint presentation or PDF.
7. Give it a Chance
If you’re familiar with Tableau, the learning curve in Power BI might seem steep at first, but the process of data import, modeling, and visualization is pretty intuitive once you get the hang of it. Power BI’s integration with Microsoft’s ecosystem and its variety of features for data transformation and visualization can take your analysis portfolio quickly to the next level with fewer effort than anticipated.
So, if you're a Tableau lover exploring Power BI for the first time, give it a shot! You’ll be building powerful dashboards and sharing impactful reports in no time.
