What is aggregation?
It can be quite hard to wrap your head around aggregations. So in simple terms aggregation is combining multiple data points to produce a single summarising value.
There are multiple different ways that you can aggregate data, here are some common types:
SUM- returns total sum of all values
AVG- returns the average of all values
COUNT- counts the number of values
MAX- returns the maximum value
MIN- returns the minimum value
Example
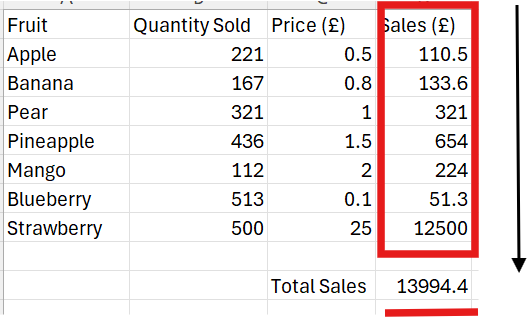
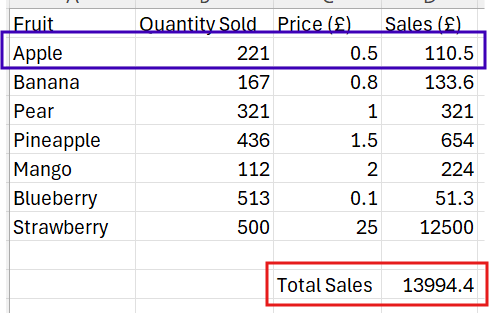
Below, there is a visual to help conceptualise what is going on with the data. In this example multiple rows, showing the sales amount for different fruit, combine to give one value - this is the sum of the sales.
Example in Tableau
Below is an example using the superstore data. Here you can see the sales for each product type within a category. The aggregated values show the sum of sales for each category.
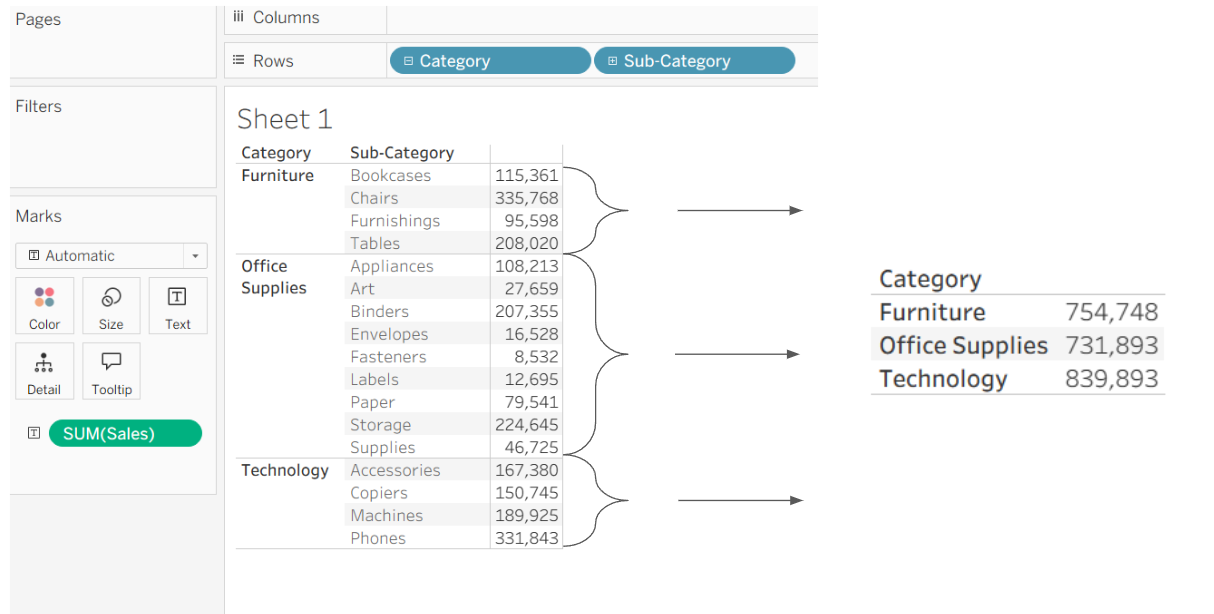
The dimension in the view controls the granularity of the measure.
Methods of Aggregation
There are two ways you can aggregate the values within Tableau
-Quick (local)- for one singular view
-Calculated field (global)- available for all worksheets
Quick aggregations
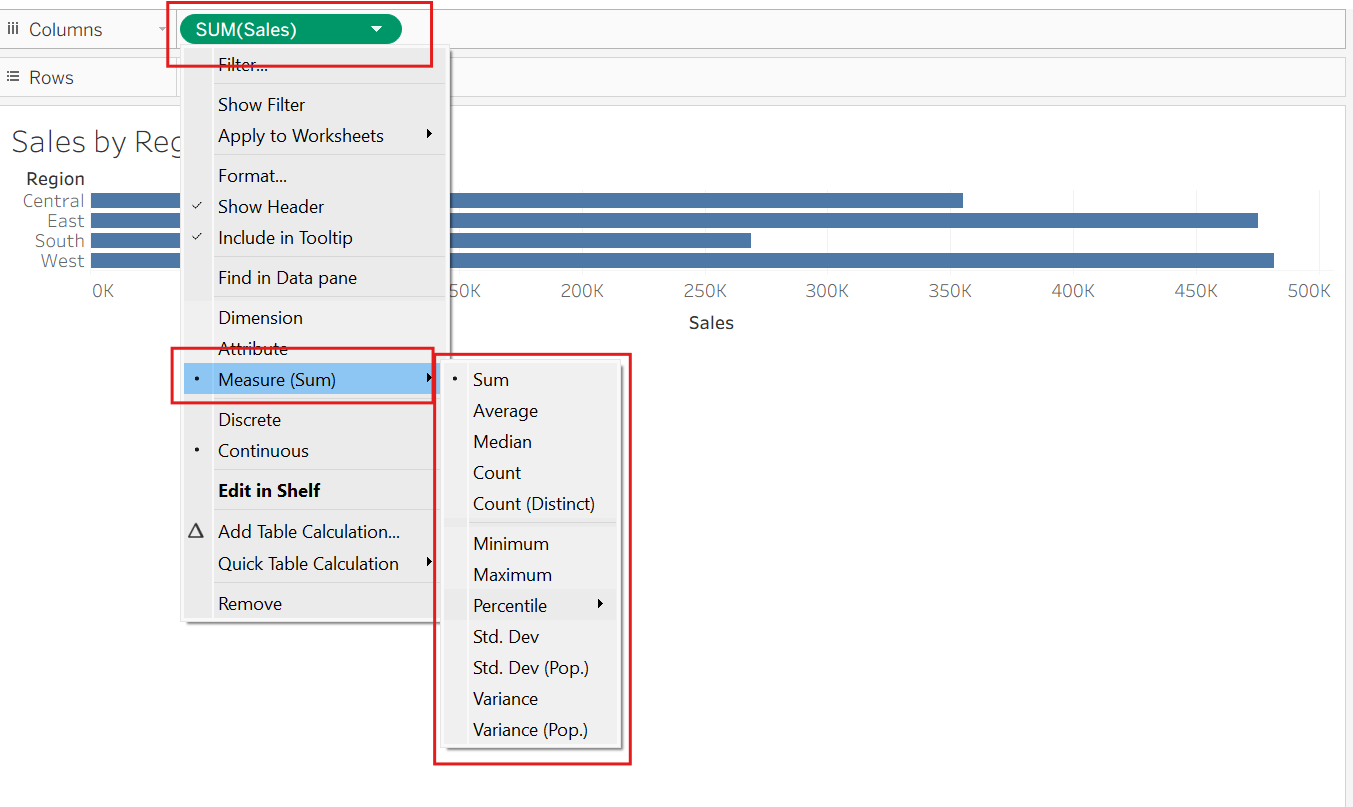
These aggregations can be made by dragging a measure onto the view. You can change the type of aggregate function by right clicking and navigating to 'Measure'.
Calculated fields
This method creates a new field that lives in the data tab. But it is important to note that this will not alter the data source
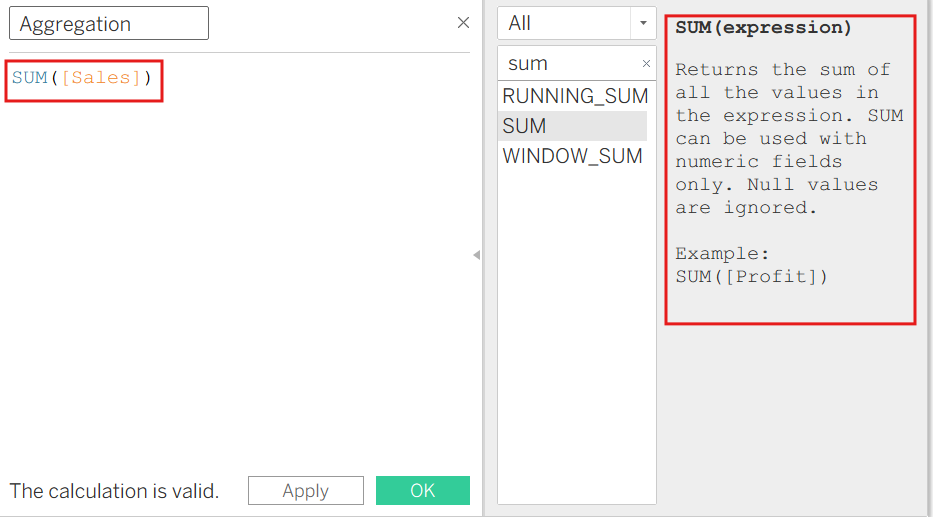
Aggregate vs Non-Aggregate
when should you aggregate values?
Aggregate values when you want to compare or summarize across groups, for examples:
-Total sales by area
-Average order value by customer
-How does a product's sales compare to total category sales?
When should you not aggregate?
You should stay row-level when you need to keep individual record detail. Some examples include:
-Profit of a specific transaction
-Find orders where the discount is more than 20% (comparing one row's own values)
-Calculations that will feed into an aggregation
Row-level of detail?
Before we move on lets clarify what is meant by row-level. A row-level value is exactly what's stored for that single row, it changes from row to row, because every row can have a different value.
The example below (blue) shows what the row level values are vs an aggregate value (red).
Why are your calculations not working?
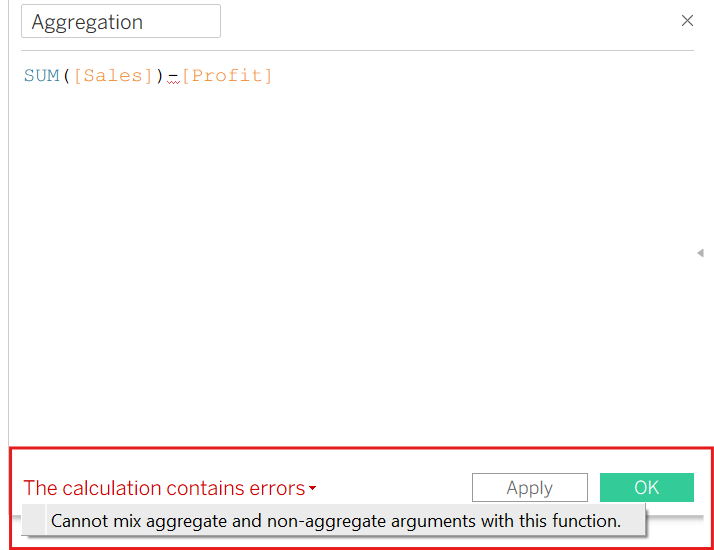
When creating calculations, you may come across this error. But this is because, you cannot mix aggregate and non-aggregate arguments.
So how do you fix this?
I would take the following steps to check my calculation:
1) Identify which parts are aggregated/non– aggregated:
Look for SUM, AVG, COUNT, MIN, MAX, MEDIAN in the formula, these functions are all aggregate functions. Anything else is row-level.
2) Be sure to think about what you are trying to calculate. Do you need an answer for every row or one value?
3) Make all arguments to the same level:
In this case, I will wrap the [profit] field inside a SUM function. The calculation is no longer erroring.
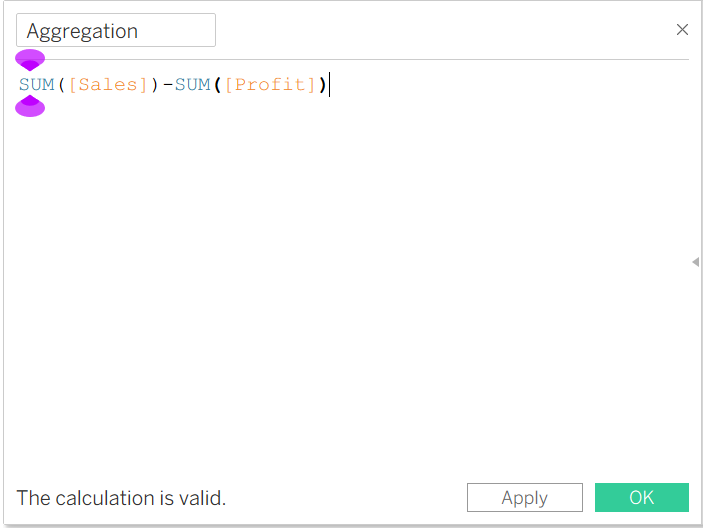
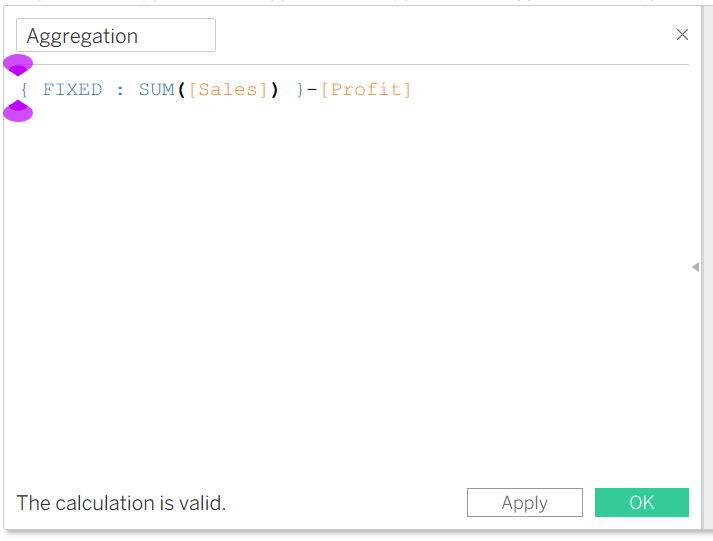
Alternatively you could, bring the aggregate down to row-level. To do this use a Level of Detail (LOD) expression so it's fixed per row. Below is an example using the equation.